Published on
September 22, 2025

Tracking Customer Acquisition Cost (CAC) is critical for SaaS companies. Without a clear dashboard, it’s hard to manage marketing and sales expenses effectively or make informed decisions. A CAC dashboard helps you:
To build a dashboard, connect your data sources, choose a visualization tool like Power BI or Tableau, and focus on actionable metrics. A well-designed dashboard simplifies decision-making, supports financial planning, and keeps teams aligned on customer acquisition strategies.
Customer Acquisition Cost (CAC) represents how much you spend on sales and marketing to gain a new paying customer. It’s a key metric for evaluating whether your growth strategy makes financial sense in the long run.
"Customer acquisition cost is how much it costs to turn a prospect into a paying customer. This number carries significant weight for SaaS businesses, which often spend heavily to bring customers in before they've earned anything from them." – Stripe
For SaaS companies, CAC is all about calculating the total sales and marketing expense needed to bring in one new paying customer. It’s a vital indicator for assessing your unit economics and determining whether your customer acquisition efforts are financially sound.
Unlike metrics that track leads or trial users, CAC focuses solely on the cost of acquiring actual paying customers. While terms like Cost Per Acquisition (CPA) or Cost Per Customer (CPC) might include costs for leads or free trial users, CAC zeroes in on the customers who have subscribed and paid for your service.
This focus is especially important for SaaS businesses, which often spend upfront to acquire customers and then recover those costs through recurring revenue. Knowing your true CAC helps you judge whether this upfront investment is paying off.
The formula for CAC is simple:
Total Sales and Marketing Expenses ÷ Number of New Customers Acquired
When calculating CAC, make sure to include all direct costs tied to acquiring new customers, such as:
However, exclude costs unrelated to acquiring new customers, like:
For instance, if your SaaS company spends $75,000 on sales and marketing in a quarter and gains 300 new paying customers, your CAC would be $75,000 ÷ 300, equaling $250 per customer.
Once you know your CAC, you can evaluate how effectively you’re acquiring customers and identify areas for improvement.
Understanding CAC goes beyond just knowing your acquisition costs - it’s about optimizing your growth strategy. By comparing CAC across different marketing channels, you can identify which ones deliver the best results and allocate your budget more effectively.
CAC is especially important for SaaS companies because they typically invest upfront in acquiring customers and recover those costs through recurring revenue. This makes CAC a key metric for investors, as it reflects whether your growth model is sustainable. Balancing CAC with customer lifetime value (LTV) is crucial; a healthy ratio indicates efficient spending, while a rising CAC could signal issues like market saturation or ineffective marketing.
Additionally, knowing your CAC helps with cash flow planning. Since acquisition costs are incurred upfront while revenue trickles in over time, understanding CAC allows you to forecast how much working capital is needed to fuel growth initiatives.
Monitoring CAC trends over time can also offer valuable insights. An increase might point to tougher competition or less effective campaigns, while a decrease could mean better targeting, improved conversion rates, or more streamlined marketing efforts. Accurate CAC tracking ensures you’re making data-driven decisions to guide your growth strategy.
Next, we’ll dive into the data sources and integrations that are crucial for creating a reliable CAC dashboard.
Creating a dependable CAC dashboard begins with sourcing data from the right places. The accuracy of your dashboard - and its ability to guide decisions - depends on how well this data is gathered and connected. Proper integration lays the groundwork for reliable performance and informed strategies.
To calculate CAC effectively, you need data from several critical systems:
Modern business systems often come with APIs, making real-time data synchronization easier. For instance, linking your CRM with your accounting software can automatically align customer acquisition dates with related marketing costs.
If an API isn’t available, tools like Zapier or other data integration platforms can help schedule regular data transfers. In cases where automation isn’t an option, manual imports can fill the gap. Just be sure to standardize the process - extract data monthly, format it consistently, and align it with acquisition dates to maintain accuracy over time.
Reliable CAC metrics depend on clean, validated data. Regularly compare customer counts in your CRM with those in your subscription management system to catch duplicates or inactive accounts.
It’s also important to review expense categorization in your accounting software. Make sure sales and marketing costs aren’t mixed with other expenses, like customer success or post-sale account management. Monthly reconciliations can help catch errors early and keep your data accurate.
According to Phoenix Strategy Group, maintaining disciplined data practices is key to accurate financial planning. By establishing consistent processes before diving into advanced dashboard tools, you not only protect the accuracy of your CAC metrics but also set the stage for smarter decisions as your business grows.
Properly integrated and validated data ensures your dashboard remains a reliable tool for guiding strategic choices. These foundational steps make managing and optimizing your CAC dashboard much smoother.
Once you've integrated your data sources, the next step is picking the right visualization tool. This choice plays a big role in how easily your team can uncover insights, track trends, and adapt as your business grows. When evaluating options, focus on three main factors: integration capabilities, scalability, and user experience.
Power BI is a strong choice for teams already using Microsoft products. Its seamless integration with Excel and Azure simplifies data importing, and it automatically formats figures in U.S. currency (e.g., $125,000). Power BI also connects effortlessly with SQL databases and, with premium plans, supports data refreshes as frequently as every 15 minutes - keeping your CAC metrics up to date.
Tableau excels in producing advanced visualizations, but it comes with a steeper learning curve and higher per-user costs. It’s particularly valuable for managing complex data relationships and allows interactive drilldowns, letting users explore CAC trends by specific channels or campaigns.
Google Data Studio (now Looker Studio) offers a budget-friendly solution, especially for startups. It integrates smoothly with Google Workspace, connecting directly to Google Sheets and Google Analytics. This makes it ideal for tracking CAC with simpler data sources. The platform also handles formatting, such as adding comma separators (e.g., 1,250) and automating percentage calculations, saving time on manual adjustments.
Metabase and Grafana are open-source tools designed for technical teams comfortable with self-hosting. They provide full customization, but their setup and maintenance require dedicated IT resources, making them better suited for companies with in-house technical expertise.
For mid-market SaaS companies, the challenge lies in finding a tool that offers advanced features without the complexity of enterprise-level platforms. The right dashboard tool should strike a balance between robust functionality and ease of use.
Scalability is a key consideration. As your business grows, your dashboard must handle more users, larger datasets, and increasingly complex queries - all while maintaining smooth performance.
Equally important is user experience. A 2024 Userpilot study found that nearly half of SaaS churn stems from poor UX rather than pricing or features. Teams across finance, sales, and leadership need dashboards that allow them to gather insights quickly and without frustration.
For many mid-market companies, Power BI hits the sweet spot. At about $10 per user per month, it combines affordability with features like elastic cloud computing, which scales resources during high-demand periods like month-end reporting.
On the other hand, Tableau is a better fit for organizations with dedicated analytics teams. Its ability to handle complex calculations, such as blended CAC across multiple channels, makes it worth the higher cost - typically $70 or more per user per month - for data-heavy operations.
For companies seeking implementation support, Phoenix Strategy Group offers data engineering services to streamline the process. Their approach focuses on connecting existing data sources first, then tailoring dashboards to match your team’s technical skills. This ensures you avoid investing in overly complex tools that end up underutilized.
The key takeaway? Choose a platform that aligns with your team’s workflow and technical abilities. The right tool should not only be powerful but also easy to use for ongoing CAC analysis. Up next, we’ll look at how to design dashboard layouts to clearly present these crucial CAC metrics.
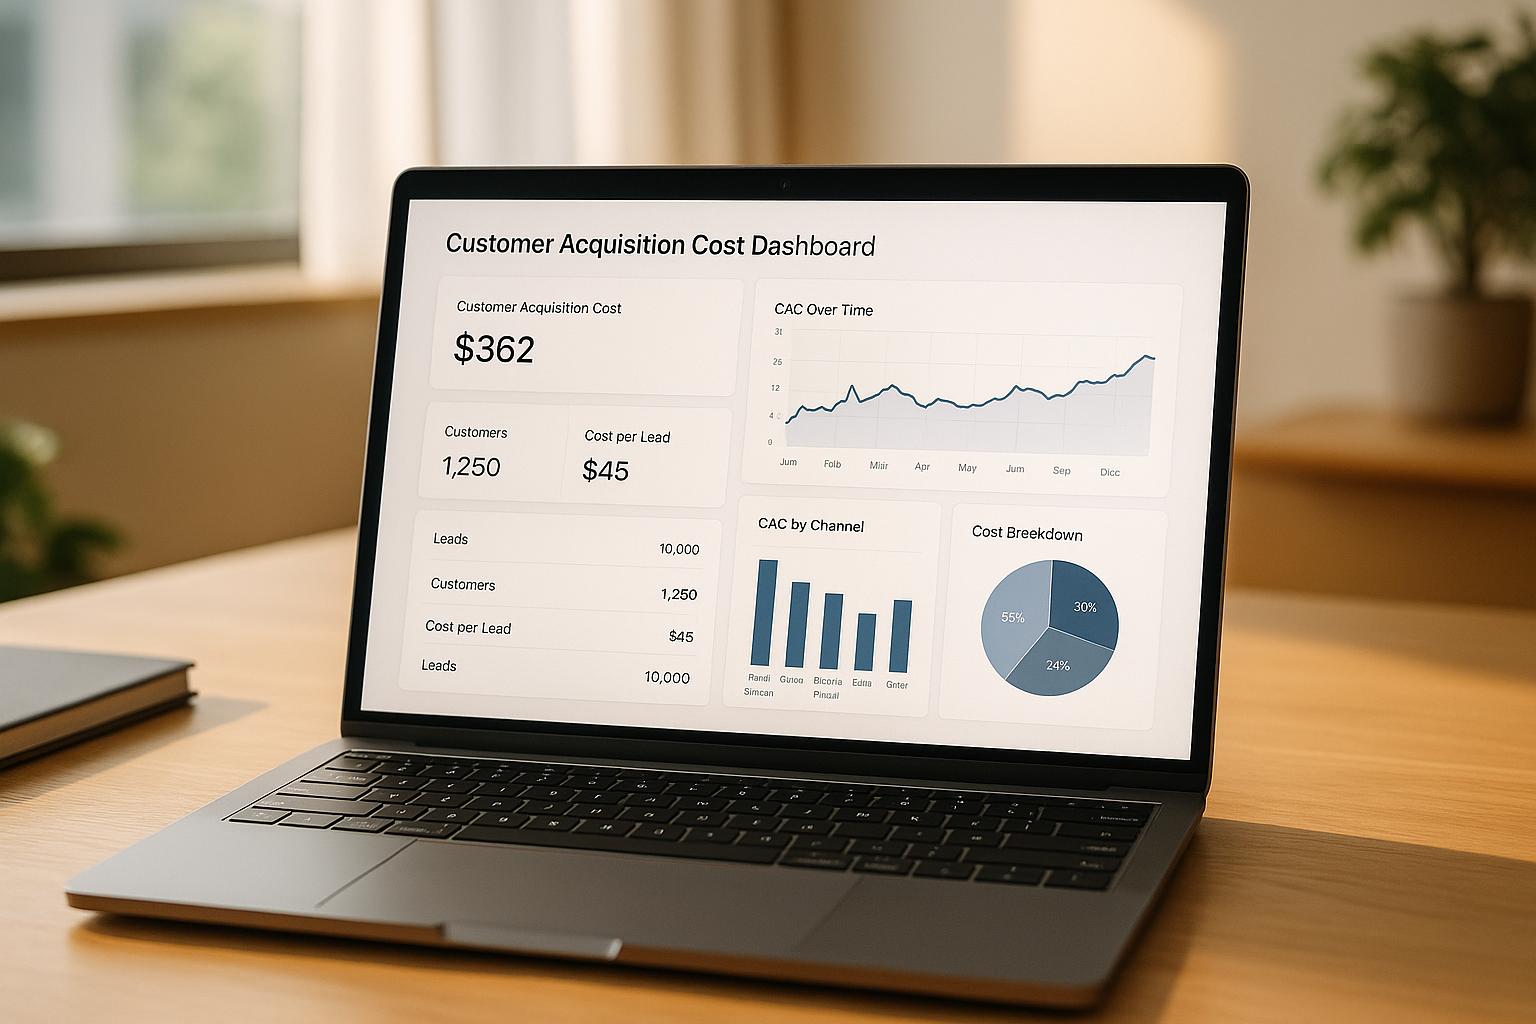
Creating an effective CAC dashboard means focusing on the metrics that truly matter for understanding customer acquisition efficiency and profitability. The challenge lies in striking the right balance: too much data can overwhelm, while too little leaves critical gaps. Using your integrated data sources, design a dashboard that highlights the financial performance metrics that drive decisions.
Here are the essential metrics to include on your CAC dashboard:
These metrics provide a strong foundation for evaluating CAC performance. Next, let’s explore how to organize your dashboard for maximum clarity and usability.
To make your CAC dashboard actionable and easy to navigate, structure it with time-based views that align with your reporting cycles. Include sections for monthly, quarterly, and year-to-date data. Monthly views support tactical decisions, while quarterly and year-to-date views help with strategic planning and presentations to stakeholders.
Maintain consistency in formatting - use U.S. currency with comma separators (e.g., $45,250) and MM/DD/YYYY date formats. This reduces confusion and allows users to focus on the insights rather than the presentation.
Finally, tailor the layout to your audience. Executive dashboards should emphasize high-level trends and ratios, while dashboards for marketing teams can dive deeper into tactical metrics and channel-specific details. The goal is to make CAC data clear and actionable for everyone involved in decision-making.
Getting your dashboard set up properly is crucial for generating insights you can trust. A solid foundation during implementation ensures reliable data analysis, while regular maintenance keeps your dashboard accurate and useful as your business grows.
Start by loading 12–24 months of historical data, formatted with consistent MM/DD/YYYY dates and U.S. dollar values. This historical data provides a baseline to identify trends and understand normal fluctuations in your Customer Acquisition Cost (CAC) metrics.
Automate daily data refreshes and schedule weekly reconciliations during low-traffic hours, like 2:00–4:00 AM EST. This keeps your data current without slowing down system performance during peak business hours.
Double-check your CAC calculations using sample periods. Pay close attention to how the system handles partial months, attribution windows, and currency conversions if you're operating internationally. Accuracy here ensures your metrics are reliable.
Set role-based permissions to tailor the data views for different teams. For example, marketing teams can access detailed data, while executives see high-level summaries. This makes the dashboard relevant and manageable for everyone.
Compare dashboard results with source reports for at least three months, documenting discrepancies to ensure consistency across your reporting systems. This step helps establish trust in your data.
Perform monthly data audits to ensure accuracy and completeness. Look for unusual spikes or drops in key metrics, verify that all data sources are updating correctly, and address any missing or incomplete records.
Update your dashboard whenever your business changes. Whether you're launching new marketing channels, adjusting attribution models, or revising pricing structures, make sure your dashboard reflects these updates. Document every change with timestamps and explanations to maintain an audit trail.
Set up automated alerts for potential issues, like missing data, unexpected metric variations, or failed data refreshes. These alerts help you catch and fix problems before they impact business decisions.
Validate your metric calculations quarterly by spot-checking results against source systems. As your business grows, even small errors can add up, so regular validation is key.
Review and update your metric definitions annually or whenever your business undergoes significant changes. For example, definitions for terms like "qualified lead" or "activated customer" may evolve as your product and strategy mature. Keeping these definitions current ensures your dashboard remains relevant and reliable.
Once your dashboard is organized, use it to interpret CAC trends in context. A slight increase in CAC might not be a red flag - it could signal a strategic move toward higher-value customer segments or reflect seasonal market trends.
"Metrics are more powerful when used in context."
Always analyze CAC alongside metrics like revenue trends, gross margins, churn rates, and operating expenses to get a complete financial picture.
Set alerts to flag critical changes, like a CAC increase of more than 20% month-over-month or when channel-specific CAC exceeds 150% of its target. These alerts allow you to act quickly and address issues before they escalate.
When you notice abnormal changes in CAC, dig deeper to find the root cause. For example, if CAC spikes for a specific channel, review campaign-level data to identify problems. Look at factors like conversion rates, average deal sizes, and sales cycle lengths to pinpoint whether the issue lies in lead quality, pricing, or market conditions.
If rising CAC puts your financial stability at risk - such as reducing your cash runway below 12 months - pause additional spending on sales and marketing. Focus on your top-performing channels and investigate underperforming areas to protect your cash flow and refine your acquisition strategy.
Use your dashboard to optimize every stage of your customer acquisition funnel. Track where prospects drop off - from their first website visit to trial activation and paid subscriptions. If you find bottlenecks, work with your product and marketing teams to reduce friction and improve both conversion rates and acquisition costs.
Leverage your dashboard insights to forecast the impact of changes. For instance, if you're reallocating budget from underperforming channels to high-ROI activities, calculate how this will affect your sales pipeline and revenue. Update your financial projections and communicate the expected outcomes to your stakeholders.
Encourage collaboration by sharing dashboard insights across teams. Schedule regular review meetings with marketing, sales, and customer success teams, and provide tailored dashboard views that highlight metrics relevant to each group. This helps everyone understand how CAC trends impact their specific goals and strategies.
For additional guidance on aligning your dashboard insights with your business growth objectives, consider consulting Phoenix Strategy Group (https://phoenixstrategy.group). Their advisory services can help ensure your dashboard not only tracks key metrics accurately but also supports data-driven decisions for sustainable growth. By following these practices, your dashboard can remain a powerful tool as you refine your customer acquisition strategies.
To create an effective SaaS CAC dashboard, you’ll need to connect your data sources, visualization tools, and align them with your business goals. This step sets up the foundation for ongoing management and optimization.
Start by mapping out how your data will flow. Your CRM system holds customer acquisition data, marketing platforms track campaign performance, and your billing system provides revenue details. These three systems should work together, feeding data into your dashboard with regular updates.
Next, choose a dashboard framework that matches your resources and budget. If you have a skilled technical team, consider building a custom solution that integrates seamlessly with your existing tools. For smaller teams or those with limited development capabilities, opt for platforms offering pre-built SaaS templates and drag-and-drop features.
Once the technical groundwork is complete, operationalize your dashboard by setting up automated reports and training users. Design the interface with a clear visual hierarchy: place key metrics like overall CAC, CAC by channel, and CAC trends at the top. Supporting metrics, such as conversion rates and customer lifetime value, can occupy secondary panels.
Use color coding to make trends easy to spot. For example:
This system allows teams to quickly identify areas of concern during daily or weekly reviews.
Enable drill-down functionality to let users explore deeper insights. For instance, clicking on overall CAC should reveal a breakdown by marketing channel, and further by specific campaigns. This layered approach keeps the main dashboard clean while still providing access to detailed data when needed.
Automate reporting schedules tailored to different stakeholders. Each report should focus on the metrics most relevant to that audience’s roles and responsibilities.
Test your dashboard for a month by comparing it to existing reports. Document any discrepancies and fine-tune the system. This testing phase will ensure confidence in the dashboard and help catch any issues early.
If you want to speed up the development process, companies like Phoenix Strategy Group (https://phoenixstrategy.group) specialize in building scalable CAC tracking systems. Their expertise in SaaS metrics and financial modeling can help ensure your dashboard tracks the right data and supports strategic growth decisions from the start.
Provide hands-on training and create quick reference guides to help your team interpret each metric effectively. Choose tools and data structures that can scale as your business grows, accommodating new marketing channels, products, or markets.
Lastly, document your dashboard specifications thoroughly. Include details like data sources, calculation methods, update schedules, and contact information for data owners. Clear documentation is invaluable for onboarding new team members and troubleshooting. Establish governance protocols to manage metric updates, data source approvals, and user access. These safeguards will protect data integrity and keep your dashboard aligned with evolving business needs.
To keep your SaaS CAC dashboard accurate and dependable when pulling data from multiple sources, start by setting specific data quality standards. These should include guidelines for acceptable value ranges, formats, and relationships between data points. Implementing automated validation tools can help you catch mistakes early and maintain consistent oversight of data accuracy.
Equally important is establishing data governance policies. These policies should clearly define roles, responsibilities, and procedures for managing your data. Regular audits of your data sources and involving key team members in the process can help spot and fix potential problems, ensuring your dashboard stays reliable and provides actionable insights.
To present SaaS CAC trends and metrics effectively, focus on making the data clear and relevant for your audience. Line charts work well for showing changes over time, while bar charts are great for comparing different customer segments or acquisition channels. It's important to adjust the level of detail based on who you're addressing - executives usually want quick, high-level overviews, while analysts might need detailed, in-depth data.
Stick to consistent color schemes, use clear labels, and keep data points concise to make the information easy to grasp. Adding real-time updates can also help ensure everyone has the latest insights, supporting smarter decisions across teams.
Customer Acquisition Cost (CAC) is a crucial metric that shows how much your business spends to gain a new customer. It’s a key indicator of how efficiently your marketing efforts are working. To get a clearer picture of your business’s performance, compare CAC to Customer Lifetime Value (LTV). This comparison helps determine if your marketing investments are paying off. A healthy LTV/CAC ratio is typically around 3:1, meaning the revenue generated from a customer should ideally be three times the cost of acquiring them.
If your CAC is higher than it should be or your LTV/CAC ratio dips below the 3:1 mark, it’s a red flag. This could mean it’s time to reevaluate your strategies - whether that’s fine-tuning your marketing channels, boosting conversion rates, or finding more budget-friendly ways to bring in customers. Keeping a close eye on CAC trends allows you to shift your budget toward what’s working best, ensuring your resources are spent wisely and your business stays on a sustainable growth path.