Published on
December 1, 2025

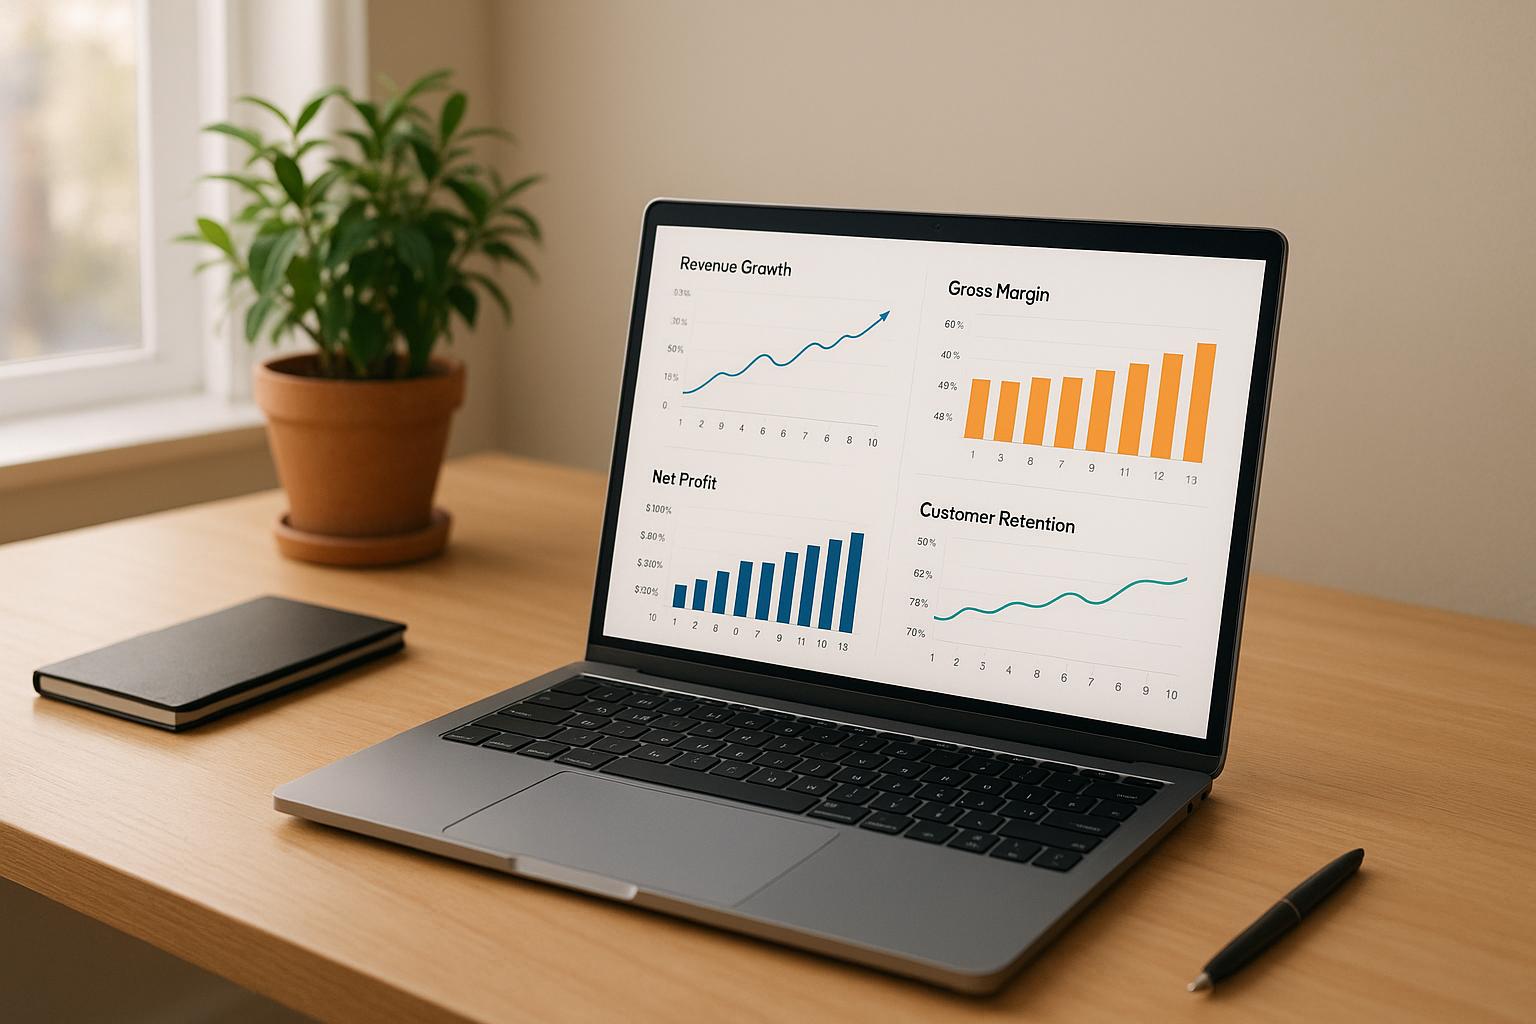
Year-over-Year (YoY) revenue growth is a key metric for tracking how much your business is expanding over time. But relying on it alone can be risky - it doesn’t reveal profitability, efficiency, or customer retention. To get a full picture of financial health, pair YoY revenue growth with these critical KPIs:

Year-over-Year (YoY) revenue growth measures how much your revenue has increased (or decreased) by comparing the same period in two consecutive years. The calculation is straightforward: subtract last year’s revenue from this year’s, divide by last year’s revenue, and multiply by 100. For instance, if your revenue in Q1 2024 was $100,000 and it grew to $150,000 in Q1 2025, the YoY growth would be 50%[1].
This metric is particularly useful because it smooths out seasonal fluctuations that can skew month-to-month comparisons, offering a clearer picture of long-term trends. YoY revenue growth highlights how well your business is expanding its market share, attracting new customers, and improving its offerings. It’s a solid indicator of momentum. When revenue climbs, companies often gain the ability to reinvest in areas like technology, talent, and product development. For subscription-based businesses, tracking recurring revenue - whether monthly (MRR) or annual (ARR) - adds another layer of insight. YoY revenue growth serves as a foundation for analyzing overall business health.
However, growth alone doesn’t tell the full story. A 5% increase is very different from a 50% jump, and rising revenue doesn’t always mean higher profitability. For example, a company might report 40% YoY growth but see its profit margins drop from 15% to 8%. This could signal issues like heavy discounting, unsustainable customer acquisition costs, or inefficiencies in operations. YoY growth also doesn’t shed light on customer retention. Are you keeping your existing customers or just replacing those who’ve left? Even negative growth needs context. A mature, profitable company with -5% YoY growth could be in a better position than a startup boasting +100% growth but burning through cash with unsustainable economics[2].
At Phoenix Strategy Group, we understand that while YoY revenue growth is a key indicator of market expansion, it’s only part of the picture. Pairing it with other KPIs is essential to determine if that growth is both sustainable and profitable.
Gross Profit Margin is calculated using the formula: (Revenue – COGS) / Revenue × 100. For instance, if your business generates $1,000,000 in revenue and has $600,000 in Cost of Goods Sold (COGS), the gross profit margin would be 40% [1]. This metric is essential for understanding whether your revenue growth is translating into actual profitability. It provides a clear view of how effectively sales increases contribute to overall profits.
While revenue growth often grabs attention, it doesn’t automatically equate to profitability. A company might post impressive year-over-year revenue growth - say, 30% - but if costs are climbing faster than sales, that growth becomes less meaningful. Gross Profit Margin helps identify whether your revenue growth is sustainable or if rising costs are eating into your profits.
Take a SaaS company as an example. If it reports 25% YoY revenue growth but sees its margin drop from 70% to 60%, this signals that increasing costs are cutting into profitability. Without addressing this, the company risks undermining its long-term growth.
Gross Profit Margin also serves as a barometer for operational efficiency. If margins are shrinking despite higher revenue, it could point to growing production costs, reduced pricing power, or a shift toward lower-margin products. For example, a margin decline from 45% to 40% over a year might indicate inefficiencies that require immediate attention. Management could respond by adjusting pricing strategies, renegotiating supplier contracts, or optimizing production processes.
Gross Profit Margin benchmarks vary significantly by industry. Retailers often operate with margins of 20–40%, SaaS companies typically range between 70–80%, manufacturing firms see 30–50%, and professional services can exceed 60% [4]. Comparing your margins over time and against industry peers can reveal whether rising costs or strategic missteps are affecting profitability.
For example, if your company achieves strong YoY revenue growth but experiences a declining gross profit margin, it’s a red flag. Causes might include inflation-driven COGS increases, supply chain issues, a shift to lower-margin products, or pricing strategies that fail to keep up with costs. Addressing these problems might involve renegotiating supplier terms, improving operational efficiency, or repositioning product offerings to maintain healthy margins.
Investors and potential acquirers closely examine both revenue growth and gross profit margin trends when evaluating growth-stage companies. A business with strong revenue growth and stable or improving margins is generally more appealing. Healthy margins demonstrate operational efficiency, pricing power, and scalability - key factors for long-term success.
At Phoenix Strategy Group, we help growth-stage companies build financial systems that accurately track key metrics like gross profit margin. Using advanced accounting tools, we ensure COGS is clearly separated from operating expenses. This enables detailed analysis by product line or customer segment, with regular data validation to support informed decision-making and drive profitability.
Net Profit Margin shows how effectively your company turns revenue into profit. It’s calculated using the formula: (Net Profit ÷ Total Revenue) × 100. For example, if your business earns $1,000,000 in revenue and $220,000 in net profit after covering all expenses, your Net Profit Margin is 22% [3]. This metric helps you understand whether your revenue growth is genuinely adding value or simply masking deeper profitability issues.
Revenue growth can be impressive, but it doesn’t mean much if profits aren’t keeping up. Take two companies, for instance, both reporting 45% year-over-year (YoY) revenue growth. One maintains a 22% Net Profit Margin, while the other sees its margin drop from 18% to 12%. While their revenue numbers might look equally strong, the first company shows sustainable growth, whereas the second may be struggling with profitability. Pairing revenue growth with a healthy Net Profit Margin - like 45% YoY growth alongside a 22% margin - provides a more complete picture of long-term success. This context is crucial for evaluating operational efficiency through deeper margin analysis.
Net Profit Margin accounts for all expenses, including costs of goods sold (COGS), operating expenses, marketing, administrative overhead, interest, and taxes. Unlike Gross Profit Margin, which focuses only on production costs, Net Profit Margin reflects your company’s overall efficiency. Factors like rising operating costs, increased customer acquisition expenses, tough price competition, or shifts to lower-margin products can all erode margins. To counteract these pressures, you can:
Additionally, retaining customers and increasing their lifetime value can significantly bolster margins over time.
Net Profit Margin benchmarks vary widely by industry. For instance, technology and SaaS companies often aim for margins between 15% and 25% due to their scalable models and lower variable costs. Retail businesses, on the other hand, typically operate with margins of 2–5% because of tight pricing and inventory challenges. Manufacturing firms usually fall somewhere in the 5–10% range [3].
For early-stage companies, it’s common to accept lower - or even negative - margins while investing in growth, but improvements should follow as they scale. Established businesses, however, should aim for margins that meet or exceed industry averages. For example, targeting 30% YoY revenue growth while improving margins from 18% to 20% strikes a balance between growth and profitability. Monitoring margin trends can also guide critical decisions, such as refining pricing strategies or adjusting your product mix.
Investors and potential buyers pay close attention to these trends. Companies demonstrating strong revenue growth alongside stable or improving margins signal operational discipline and a solid business model. On the flip side, declining margins can raise red flags about sustainability [3].
At Phoenix Strategy Group, we specialize in helping growth-stage companies track Net Profit Margin across time periods, product lines, and customer segments. Through our fractional CFO services, we provide margin analysis, cost optimization, and strategic planning to ensure your revenue growth leads to sustainable profitability and supports your long-term goals.
Customer Acquisition Cost (CAC) tells you how much your business spends to bring in each new customer. It’s calculated by dividing your total sales and marketing expenses by the number of new customers acquired during a specific time frame. For instance, if you spend $50,000 on marketing in a quarter and gain 500 new customers, your CAC would be $100. This metric is a key indicator of whether your revenue growth is being achieved at a manageable cost. Let’s break down why CAC is so important.
Revenue growth on its own doesn’t mean much if rising CAC is eating away at your profitability. Imagine a company that’s doubling its revenue but also seeing its CAC skyrocket - this paints a very different picture than a company that’s growing revenue while keeping CAC steady or even lowering it. In the first scenario, the business is spending more and more to attract each new customer, which can quickly become unsustainable.
CAC plays a direct role in your bottom line. Every dollar spent on acquiring customers impacts overall profitability. By comparing CAC across various acquisition channels, you can identify which strategies are delivering the best results for the lowest cost. Tracking CAC over time and benchmarking it against historical data can uncover trends and areas for improvement.
One way to reduce CAC is by improving conversion rates - the percentage of website visitors who become paying customers. Regularly testing different channels and refining your messaging can help you find more efficient ways to attract customers.
CAC works hand-in-hand with another critical metric: Customer Lifetime Value (LTV). Ideally, each customer should generate at least three times their CAC in revenue. Monitoring the relationship between CAC and LTV offers a clear view of your customer economics and profitability. If CAC is rising faster than LTV, it’s a red flag that your acquisition strategy might not be sustainable. This becomes even more problematic if customers churn quickly, highlighting the importance of strong retention efforts.
Analyzing CAC can reveal inefficiencies in your acquisition efforts. If CAC starts climbing unexpectedly, it’s worth investigating whether your increased marketing spend is failing to deliver proportional results, conversion rates are dropping, or you’re targeting less qualified prospects. Warning signs include steadily rising CAC, CAC nearing or exceeding first-year revenue, or significant differences in CAC across customer segments. Addressing these issues promptly is essential.
Understanding CAC is vital for maintaining healthy year-over-year revenue growth. Phoenix Strategy Group specializes in helping businesses decode complex financial metrics like CAC. Through our FP&A services, we provide the analysis and strategic planning you need to ensure your customer acquisition strategy leads to sustainable and profitable growth.
Customer Retention Rate tracks how well a business keeps its customers over a specific time frame. The formula is simple: (Ending Customers – New Customers) ÷ Starting Customers × 100. For instance, if you start the year with 1,000 customers, gain 200 new ones, and end with 1,100 customers, your retention rate is 90%. This metric is a key indicator of whether your revenue growth comes from maintaining strong relationships with existing customers or constantly replacing those who leave. It’s a straightforward calculation that opens the door to deeper insights about the stability of your revenue streams.
While year-over-year (YoY) revenue growth highlights market expansion, retention showcases the strength of your ongoing customer relationships. High revenue growth can sometimes hide instability if you're losing customers at a high rate and spending heavily to replace them. Retained customers are more predictable and cost less to maintain than acquiring new ones. This means a high retention rate not only supports steady revenue but also makes growth more cost-efficient.
Retention isn’t just about keeping customers - it’s a powerful driver of profitability. Over time, loyal customers often become more valuable as they require less support and may spend more on premium products or services. By analyzing retention across different customer groups - such as acquisition channels or product tiers - you can identify which areas of your business operate most efficiently. This kind of analysis helps prioritize resources where they’ll have the greatest impact.
Customer Retention Rate ties directly to Customer Lifetime Value (CLV). Customers who stick around longer generate more revenue over time, which reduces the need for constant acquisition efforts. On the flip side, if your churn rate is high, you’re forced to continually replace customers just to maintain your current revenue. Even small improvements in retention can significantly boost long-term profitability, making it a critical metric for sustainable growth.
Retention rate also serves as a barometer for your product’s fit in the market, service quality, or how you’re stacking up against competitors. A drop in retention often signals deeper issues that need attention. By tracking retention alongside revenue growth, you can make smarter decisions about where to allocate resources. For example, if retention is strong, it might make sense to invest in acquiring new customers. But if retention is weak, fixing operational or service challenges should take priority before scaling acquisition efforts.
At Phoenix Strategy Group, we help growth-stage companies use retention metrics as part of a comprehensive financial strategy. Just as gross and net profit margins reveal the quality of your revenue, retention metrics show whether your growth is built on loyal customers. Through our FP&A services, we create models that demonstrate how improving retention can fuel revenue growth and profitability, giving you the tools to allocate resources with confidence.
Customer Lifetime Value (LTV) measures the total revenue a business can expect from a single customer over the course of their relationship. The formula is straightforward: Average Purchase Value × Purchase Frequency × Customer Lifespan. For example, if a subscription service charges $50 per month and customers stick around for 24 months on average, the LTV is $1,200. This metric gives a clear picture of the revenue a customer brings over time.
Year-over-year revenue growth shows how fast your business is expanding, but LTV reveals whether that growth can last. A company might achieve impressive revenue numbers by acquiring new customers aggressively. However, if those customers don’t stay long enough to cover their acquisition costs, that growth becomes unsustainable. LTV helps answer the critical question: Is your business built for the long haul, or are you just chasing short-term gains?
The connection between LTV and Customer Acquisition Cost (CAC) is especially important. Ideally, your LTV:CAC ratio should be 3:1 - meaning for every $1 spent acquiring a customer, you earn $3 in lifetime value. For instance, if you spend $400 to acquire a customer with an LTV of $1,200, you’re in a good position. But if that same customer only generates $500 in lifetime value, you’re losing money on every acquisition, no matter how impressive your revenue growth might look. This is where LTV can also highlight differences between customer segments.
LTV is a powerful tool for identifying which customer segments bring the most value to your business. Not all customers are the same - some might make a single purchase, while others become repeat buyers with higher transaction values. Breaking down LTV by channel, product, or customer segment can uncover where your most profitable opportunities lie. Pairing LTV with Revenue Per Customer (RPC) also provides deeper insights. For example:
LTV doesn’t just measure revenue - it also guides decisions around pricing, product development, and customer prioritization. For instance, if a specific customer segment has an LTV of $2,000, it might make sense to invest more in premium support, personalized onboarding, or features that keep those customers engaged longer. On the flip side, segments with low LTVs might not justify high acquisition costs.
Churn rate plays a crucial role here. Reducing monthly churn from 5% to 4% can extend customer lifespans by 25%, significantly boosting LTV. This is why tracking churn alongside LTV provides actionable insights for improving retention strategies.
LTV is also a key factor in forecasting revenue and allocating resources effectively. By understanding the lifetime value of different customer groups, businesses can model how changes in acquisition, retention, or pricing strategies will impact long-term profitability. This forward-looking approach is essential for companies planning to scale, attract investors, or prepare for an exit.
That said, LTV calculations often depend on the business model. Subscription services offer more predictable LTV metrics, while e-commerce and SaaS models require adjustments to account for variability, upgrades, or one-time purchases.
At Phoenix Strategy Group, we specialize in helping growth-stage companies build LTV models tailored to their unique needs. Through our FP&A services, we create frameworks that connect LTV improvements - whether through better retention, upselling, or reduced acquisition costs - to long-term revenue growth. These insights empower leadership teams to make informed decisions about where to invest for the greatest impact.
Operating Cash Flow (OCF) refers to the actual cash your business generates from its primary operations within a specific time frame. To calculate OCF, you start with net income, add back non-cash expenses like depreciation and amortization, and adjust for changes in working capital components. Unlike net income, which is more of an accounting figure, OCF shows the real cash moving through your business.
Take a SaaS company, for instance. It might report $1 million in annual recurring revenue, but if it's spending heavily upfront to acquire customers and cash collection is delayed, its OCF could be negative. The revenue figure might look great on paper, but without actual cash flow, the company could struggle to cover payroll, fund growth initiatives, or meet operational expenses.
OCF provides a clear picture of how well revenue translates into usable cash for your business. It measures whether your growth is generating enough cash to handle daily operations, pay employees, invest in expansion, or manage debt. If revenue is growing year-over-year (YoY), but OCF is stagnant or negative, it could signal that growth isn’t profitable or that working capital is being mismanaged.
For example, a company growing revenue by 50% YoY might offer longer payment terms to customers or build up excess inventory. This inflates revenue figures but ties up cash, making growth unsustainable without external funding. By analyzing OCF alongside YoY revenue growth, you can differentiate between healthy, cash-backed growth and growth that depends on risky financial practices. This is especially critical for growth-stage companies seeking investment or preparing for exits, as investors prioritize cash flow over accounting profits.
Rapid revenue growth often impacts three key working capital components:
For instance, a manufacturing company with 40% YoY revenue growth might see accounts receivable rise by $2 million and inventory by $1.5 million, while accounts payable only increases by $1 million. This creates a $2.5 million working capital gap, reducing OCF despite impressive revenue growth.
OCF offers a cash-based view of your company’s financial health, complementing traditional accounting metrics like Gross Profit Margin and Net Profit Margin. While profit margins show what percentage of revenue remains after expenses, OCF reveals the actual cash generated. A company might boast high profit margins but still have negative OCF due to heavy investments in assets, inventory buildup, or extended customer payment terms.
Tracking your OCF Margin - the percentage of revenue converted to cash - can help you gauge efficiency. For example, if a company generates $10 million in revenue and $3 million in OCF, its OCF Margin is 30%. This indicates how effectively growth is translating into cash over time. A consulting firm might achieve a 40% net profit margin but a 60% OCF margin because it collects cash upfront before incurring costs.
If revenue grows by 30% but OCF declines, it’s a sign of poor cash conversion. A significant gap between OCF Margin and YoY revenue growth raises red flags. For example, if revenue grows 40% YoY but OCF stays flat or declines, the company might be:
Managing OCF effectively ensures that growth is supported by real cash, not just accounting profits. OCF plays a vital role in operational decision-making, as it determines how much cash is available for reinvestment, debt repayment, and shareholder returns without relying on external funding. For growth-stage companies, OCF directly influences decisions around hiring, marketing, product development, and market expansion.
A company with strong YoY revenue growth and positive OCF can internally fund growth initiatives. On the other hand, a company with negative OCF may need to cut back spending or seek external financing. For example, a SaaS company with $5 million in OCF can confidently expand its sales team or enter new markets, while a company with negative OCF must proceed cautiously.
Improving OCF involves optimizing working capital, operating expenses, and capital expenditures:
At Phoenix Strategy Group, we specialize in helping growth-stage companies develop cash flow models that align OCF trends with strategic goals. Through our FP&A services, we identify working capital bottlenecks and craft strategies to improve cash conversion cycles. This enables leadership teams to balance aggressive revenue growth with solid cash generation, ensuring they have the flexibility to seize opportunities without compromising operational stability. By integrating OCF insights with YoY revenue growth, companies can achieve both scale and liquidity.
Inventory turnover measures how often your business sells and replenishes its inventory over a set period, usually a year. To calculate it, divide your Cost of Goods Sold (COGS) by your Average Inventory. For instance, if your COGS is $2 million and your average inventory is $500,000, your turnover rate is 4. This means you cycle through your inventory four times in a year.
This metric is key to understanding how efficiently you’re converting inventory into sales. A higher turnover rate shows that products are selling quickly, freeing up cash. On the other hand, a lower turnover rate indicates inventory is sitting idle, tying up capital and taking up storage space. Like metrics such as OCF and CAC, inventory turnover provides a snapshot of how effectively your business is managing growth and operations.
Revenue growth can be misleading if it comes with rising inventory levels that aren’t selling fast enough. If inventory turnover slows while revenue climbs, you could face cash flow problems. Your cash gets tied up in unsold products, making it harder to fund further growth.
This metric also sheds light on whether your growth is driven by actual demand or overstocking. Healthy growth aligns rising revenue with consistent or improving turnover rates. On the flip side, declining turnover often signals overestimated demand, aggressive sales targets, or poor purchasing decisions. For companies in growth phases - whether expanding into new markets or launching new products - keeping turnover balanced is critical. If turnover drops, you risk holding onto obsolete stock, incurring storage costs, and straining cash reserves. Monitoring this metric alongside year-over-year (YoY) revenue growth helps you identify whether your growth is sustainable or masking inefficiencies.
Inventory turnover directly impacts profitability and operational efficiency. When inventory sits too long, carrying costs like warehousing, insurance, and spoilage eat into your margins. Businesses dealing with seasonal or fast-changing products - like fashion retailers or electronics companies - feel this impact even more. For example, a clothing retailer with 30% YoY revenue growth but declining turnover might end up with unsold inventory from last season, forcing them to offer steep discounts that shrink profit margins.
Improved inventory turnover also boosts return on assets (ROA). Inventory is a significant asset on your balance sheet, and faster turnover means generating more revenue per dollar invested. Take a manufacturing company with $10 million in revenue and $2 million in average inventory. If they improve turnover from 5 to 7 while maintaining revenue, their average inventory drops to $1.43 million - freeing $570,000 in cash for other uses without sacrificing sales.
Turnover benchmarks vary by industry. Grocery stores often hit 12 to 15 due to the perishable nature of their products, while furniture retailers might see 4 to 6, reflecting longer sales cycles. Luxury goods retailers, with high-margin items, may operate at 2 to 3. Understanding your industry’s norms helps you gauge whether your turnover rate supports your revenue goals or highlights inefficiencies.
Inventory turnover plays a vital role in shaping purchasing and pricing strategies. If certain products have low turnover, you might reduce order quantities, discontinue those items, or run promotions to clear stock. On the other hand, high-turnover items might warrant larger orders, better supplier negotiations, or expanded product options to meet demand.
Turnover analysis also informs pricing strategies. For example, a business with 40% YoY revenue growth but stagnant turnover might have pricing issues. Low prices could be driving sales volume but tying up cash in inventory that doesn’t generate enough margin. Alternatively, high prices might slow sales for certain products, leaving them unsold. By analyzing turnover at the product level, businesses can adjust pricing to balance sales speed and profitability.
Tracking turnover alongside revenue growth also enhances working capital management. Rapid revenue growth often requires more inventory investment, but if turnover rates improve, that investment pays off quickly. If turnover slows, you’re using more working capital than necessary, potentially leading to cash shortages or the need for external financing.
Growing businesses often fall into the trap of overstocking. Anticipating higher demand, they over-order, only to find sales don’t match expectations. This creates a cycle where excess inventory ties up cash, leaving less for marketing or product development, which further slows sales. Monitoring turnover helps you spot and correct these issues early.
Supplier relationships also play a role. Negotiating longer payment terms while maintaining fast turnover can improve cash flow. For example, if you turn inventory every 45 days but pay suppliers on 60-day terms, you collect cash from customers before paying for goods. This creates a positive cash cycle that supports growth without needing external funding.
At Phoenix Strategy Group, we specialize in helping growth-stage businesses align inventory management with demand and cash flow goals. Through our FP&A services, we analyze turnover trends, identify slow-moving stock, and develop strategies to optimize inventory levels. This ensures your revenue growth is supported by efficient operations, not overextended working capital, setting the stage for sustainable growth and stronger financial performance.
The current ratio shows how well your business can handle short-term liabilities using its short-term assets. To figure it out, divide your current assets by your current liabilities. For example, if your business has $800,000 in current assets (like cash, accounts receivable, and inventory) and $400,000 in current liabilities (such as accounts payable and short-term debt), your current ratio would be 2.0. This means you have $2.00 in assets for every $1.00 in liabilities due within the next year. It’s a quick way to assess liquidity and how revenue growth ties into your short-term financial health.
Revenue growth doesn’t mean much if liquidity is strained. A falling current ratio alongside rising revenue can be a warning sign that growth is stretching your working capital too thin. For instance, if a software company grows revenue by 50% year-over-year but sees its current ratio drop from 2.5 to 1.2, it could indicate that rapid hiring, extended payment terms for customers, or large upfront investments are draining cash. On the flip side, steady or improving current ratios during revenue growth suggest strong management of receivables, inventory, and other working capital components.
A solid current ratio sends a positive signal to lenders and investors. It shows you have the resources to cover short-term obligations. Most businesses aim for a current ratio between 1.5 and 3.0. Ratios above 3.0 might suggest too many idle assets, while a ratio below 1.0 could indicate trouble meeting financial obligations.
Tracking the current ratio alongside year-over-year revenue growth offers valuable insights. For example, if revenue jumps by 40% but the current ratio slips from 2.0 to 1.3, it might mean liquidity is being sacrificed for growth. In such cases, you could explore options like delaying new hires, renegotiating customer payment terms to speed up collections, or scaling back inventory to conserve cash.
To improve the current ratio, consider strategies like offering incentives for early customer payments, negotiating longer payment terms with suppliers, or refinancing short-term debt into long-term liabilities.
A current ratio below 1.0 suggests liabilities exceed assets, which could lead to tighter loan restrictions. Even a drop to the 1.0–1.2 range might signal a potential cash crunch.
"PSG saved my dream. They helped us get our financials in order and renegotiate our lending agreements." - Norman Rodriguez, Founder/CEO of ElevateHire
Incorporating the current ratio into a broader KPI dashboard - alongside metrics like year-over-year revenue growth, Customer Acquisition Cost (CAC), Customer Lifetime Value (LTV), and operating cash flow - provides a clearer picture of your company’s financial standing. This combination helps balance expansion with liquidity, ensuring growth is sustainable. A strong current ratio not only supports revenue growth but also keeps your business ready to seize future opportunities.
At Phoenix Strategy Group, we specialize in helping growth-stage businesses align liquidity management with revenue goals. Through our FP&A and fractional CFO services, we analyze current ratio trends, identify ways to optimize working capital, and craft strategies to maintain a healthy balance between growth and liquidity. This approach ensures your business can scale effectively, attract investors, and handle financial hurdles without losing sight of its goals.
Pairing year-over-year (YoY) revenue growth with the right KPIs ensures your growth is not just consistent but also aligned with your broader strategy. The key to choosing the right KPIs lies in focusing on metrics that directly support your business goals. For instance, a SaaS company aiming for profitability will prioritize different KPIs than a retail business expanding into new markets. The trick is to align your KPIs with your objectives, business model, and growth stage.
Start by identifying your primary business objective. Are you working on improving profitability, expanding your market share, streamlining operations, or preparing for a funding round? Each goal demands a unique set of metrics. If profitability is your focus, metrics like gross profit margin, net profit margin, and operating cash flow should be front and center alongside YoY revenue growth.
If market expansion is your goal, then metrics like Customer Acquisition Cost (CAC) and Customer Retention Rate are essential. These numbers reveal how effectively you bring in new customers and keep them engaged. For example, a company spending $500 to acquire a customer with a $2,000 lifetime value (LTV) is far better positioned than one spending $1,200 per customer.
Your business model also heavily influences which KPIs matter most. E-commerce businesses, for instance, need to monitor inventory turnover to avoid tying up cash in unsold stock. Subscription-based companies, on the other hand, should focus on metrics like Monthly Recurring Revenue (MRR), churn rate, and customer lifetime value to gauge the health of their recurring revenue streams. Once you’ve identified these model-specific KPIs, the challenge becomes prioritizing and tracking them effectively.
For growth-stage businesses, this can be tricky, as they often lack the financial infrastructure to pinpoint key metrics. This is where advisory services, such as those offered by Phoenix Strategy Group, can be invaluable. They assess your business model, competitive landscape, and strategic goals to help you zero in on the right data.
A good starting point is a thorough data analysis to highlight your strengths and opportunities. For instance, a growth-stage SaaS company might collaborate with advisors to establish baseline metrics for MRR growth, CAC, and churn rate. From there, they can create real-time dashboards to track these indicators. This eliminates guesswork and ensures you're focusing on metrics that directly impact scaling, securing funding, or preparing for an exit.
"As our fractional CFO, they accomplished more in six months than our last two full-time CFOs combined. If you're looking for unparalleled financial strategy and integration, hiring PSG is one of the best decisions you can make." - David Darmstandler, Co-CEO, DataPath
Advisory services also help you benchmark your KPIs against industry norms and historical data. For example, understanding whether a 25% YoY revenue growth rate is competitive in your field provides context that raw numbers alone cannot. This kind of comparative analysis helps you set actionable, realistic targets based on what’s achievable within your market.
Striking the right balance is crucial when selecting KPIs. Tracking too many metrics creates unnecessary noise, while focusing on too few can leave you blind to critical trends. Most businesses benefit from monitoring five to eight core KPIs that directly tie to their strategic objectives. These typically include financial health indicators (like current ratio and operating cash flow), growth metrics (like YoY revenue growth and CAC), and efficiency metrics (like gross profit margin and inventory turnover).
As your business evolves, your KPIs should evolve too. Early-stage companies often prioritize growth metrics like customer acquisition and revenue. Over time, as the business matures, profitability and operational efficiency metrics become more relevant. Companies preparing for funding rounds should emphasize metrics that matter to investors, such as quarter-over-quarter ARR or MRR growth, which signal overall business health.
Automating KPI tracking can significantly simplify this process. Tools like data engineering solutions can set up ETL pipelines, data warehouses, and dashboards, ensuring you have real-time visibility into your metrics. Phoenix Strategy Group, for example, offers these services, helping businesses move away from outdated spreadsheets and make decisions based on up-to-date data.
"Hire PSG if you want to make your life easier and have accurate data." - Michael Mancuso, CIO, New Law Business Model
An effective KPI framework includes weekly check-ins to review metrics and monthly planning sessions to adjust targets. This routine ensures your team stays aligned and allows you to catch issues, such as liquidity problems, early on. For example, weekly reviews can help identify cash flow challenges before they escalate.
Fractional CFO and FP&A support can turn these strategic insights into actionable steps, helping you stay on track with your core KPIs.
"As a home service business owner, understanding complex financials and Unit Economics always seemed overwhelming - until we started working with Phoenix Strategy Group." - Rob Mulvin, Founder / CEO, All Pro Shade
Selecting the right KPIs isn’t a one-and-done task. It’s a dynamic process that requires regular reassessment as your business grows, market conditions shift, and priorities change. The companies that thrive are those that continually refine their metrics, discard what’s no longer useful, and focus on the indicators that truly reflect their financial health and growth potential.
Year-over-year (YoY) revenue growth might show how quickly your business is expanding, but it doesn’t tell the whole story. To truly understand your financial health, you need to pair YoY revenue growth with other key performance indicators (KPIs). Focusing solely on revenue growth can hide underlying issues like shrinking profit margins, increasing customer acquisition costs, or cash flow challenges. By tracking multiple metrics together, you can evaluate not just the speed of your growth, but also its quality and long-term sustainability. This broader perspective lays the groundwork for smarter, more strategic decisions.
A well-rounded approach to metrics is essential for assessing real progress. Metrics such as gross and net profit margins, operating cash flow, and customer-focused KPIs provide a clearer picture of whether growth is creating lasting value. For instance, operating cash flow reveals if your growth is generating enough liquidity to support day-to-day operations and future investments. Meanwhile, customer metrics like customer acquisition cost (CAC), retention rate, and lifetime value (LTV) ensure that your growth stems from a strong, loyal customer base rather than excessive spending.
To get this complete financial picture, it’s important to choose KPIs that align with your strategic goals and business model. Different industries and business types require different metrics. A SaaS company, for example, will prioritize metrics like monthly recurring revenue and churn rate, while a retail business might focus on inventory turnover and sales per square foot. Whether your goal is profitability, market expansion, securing funding, or preparing for an exit, your KPIs should reflect those priorities.
Successful businesses often bridge the gap between finance and revenue teams to achieve measurable, unified results. As Phoenix Strategy Group puts it:
"The failures always happen because - finance and revenue teams working in silos. So we created what we wished we had: one unified team of finance and revenue experts delivering measurable results every week. That's what makes a durable company."
This integrated approach turns raw data into actionable insights. By connecting financial performance with operational metrics, you can identify potential issues early - such as strong revenue growth paired with declining cash flow - and make adjustments before small problems grow into larger ones. It also allows you to communicate your performance to stakeholders in a way that highlights not just growth, but sustainable and profitable growth.
Finally, regular KPI reviews are critical to staying agile in a changing market. Tracking KPIs should be an ongoing process, not a one-time task. As your business evolves, your metrics should evolve too, ensuring they remain aligned with your goals and the challenges of your market. When you combine YoY revenue growth with the right mix of complementary metrics and make regular reviews part of your routine, you set the stage for growth that’s not only fast but also sustainable, profitable, and strategically aligned.
To determine if your YoY revenue growth can be maintained over time, it's important to look beyond just the revenue numbers and dive into other key performance indicators (KPIs) for context. Metrics like Customer Acquisition Cost (CAC) and Customer Lifetime Value (LTV) are especially useful. Why? A falling CAC or an increasing LTV suggests you're bringing in and keeping customers in a way that's cost-effective and efficient.
It's also worth digging into metrics like customer churn rate, gross margin trends, and operating expenses as a percentage of revenue. These can shed light on whether your growth is backed by solid business fundamentals or fueled by short-term factors like one-off promotions or favorable market conditions. By examining these KPIs together, you'll gain a clearer picture of how sustainable your revenue growth truly is.
Gross Profit Margin reveals the percentage of revenue remaining after deducting the cost of goods sold (COGS). Essentially, it highlights how efficiently your business produces and sells its products or services. On the other hand, Net Profit Margin takes a broader view by factoring in all expenses - such as operating costs, taxes, and interest - to reflect your business's overall profitability.
Monitoring these metrics alongside Year-over-Year (YoY) revenue growth gives a more complete picture of your company’s financial standing. While YoY revenue growth shows how your total revenue is increasing over time, Gross and Net Profit Margins help determine whether that growth is both sustainable and profitable. Together, these indicators provide valuable insights for guiding strategic decisions.
Grasping the concepts of Customer Lifetime Value (LTV) and Customer Acquisition Cost (CAC) is crucial when it comes to shaping strategies for profitability and growth. LTV estimates the total revenue a customer will bring to your business throughout their relationship with you. On the other hand, CAC measures how much it costs to acquire that customer in the first place.
When you compare these two metrics, you get a clear picture of whether your customer acquisition efforts are both cost-effective and sustainable. For instance, if your CAC is much lower than your LTV, it’s a strong indicator that your business is on a path to healthy growth. These numbers can also influence decisions about how you allocate your budget, set prices, and develop strategies to retain customers.
Phoenix Strategy Group works with growth-stage companies to break down and optimize key metrics like LTV and CAC, helping them build scalable strategies for sustained success.