Published on
September 2, 2025

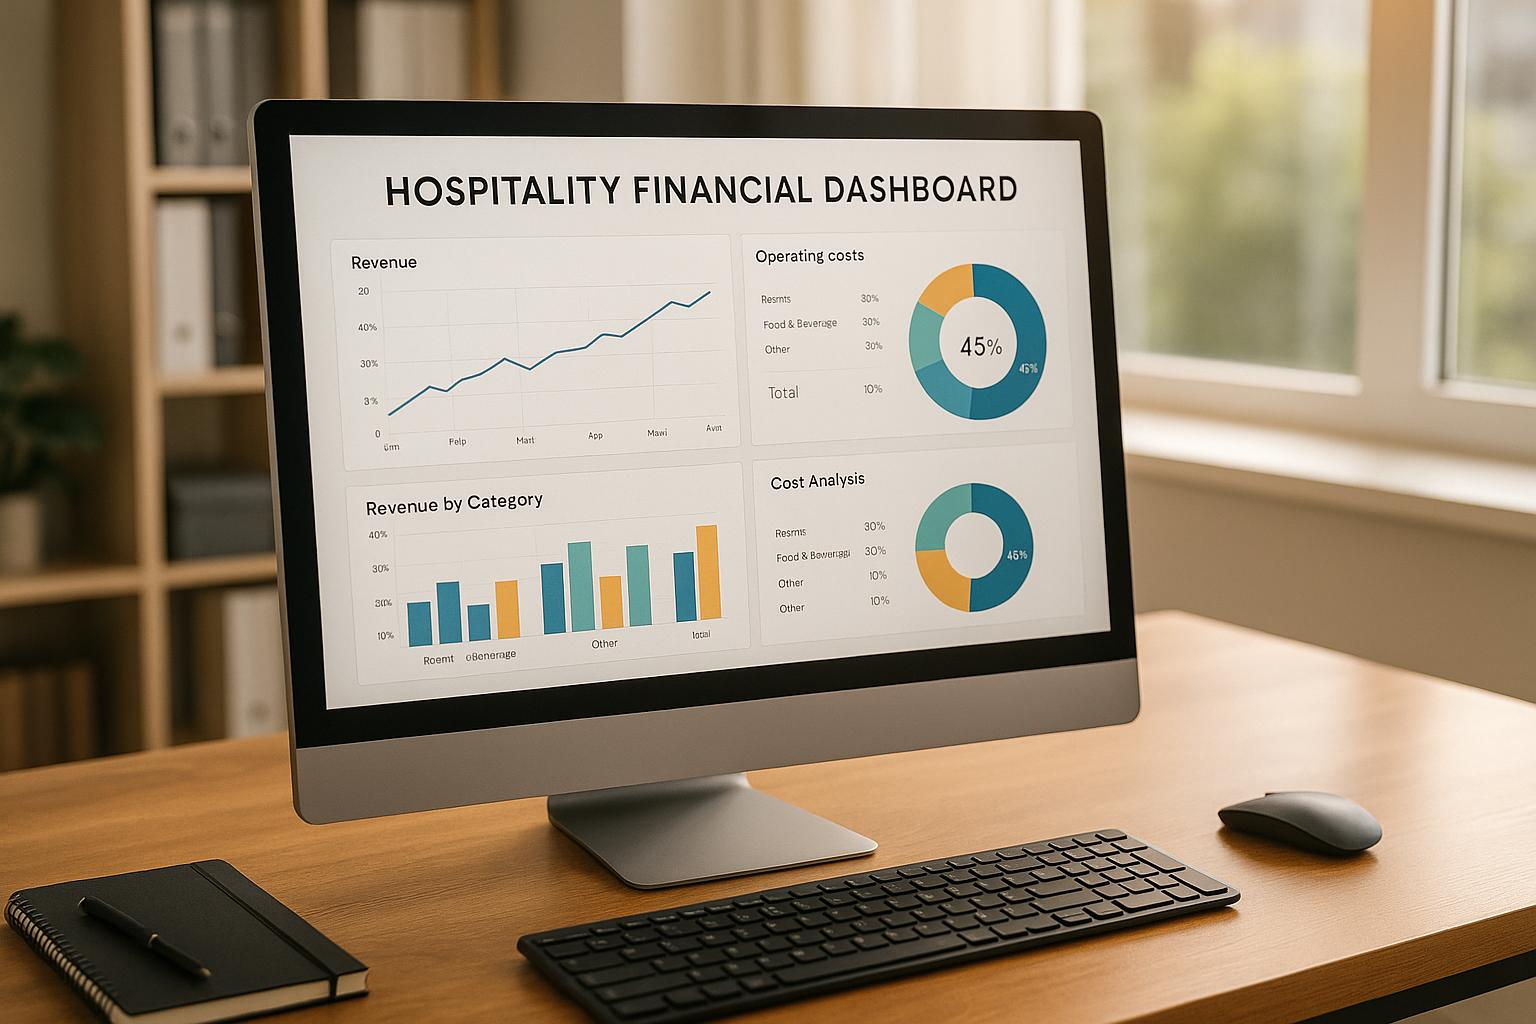
Hospitality financial dashboards are tools designed to simplify financial management for hotels, resorts, and other hospitality businesses. They consolidate data from systems like booking software, POS platforms, and accounting tools to provide a clear view of key metrics such as revenue, expenses, and profitability. These dashboards help businesses make faster, data-driven decisions, especially in an industry with complex cost structures and seasonal revenue fluctuations.
Why They Matter:
Key Features:
Setup Tips:
Best Practices:
Dashboards are not just about tracking numbers - they provide actionable insights to help businesses optimize costs, improve revenue, and stay competitive in the hospitality sector. With proper setup and maintenance, they become indispensable tools for financial clarity and decision-making.
A strong hospitality financial dashboard starts with tracking the right metrics. One of the most crucial is Revenue per Available Room (RevPAR), which combines occupancy rates and average daily rates to give a clear picture of revenue performance. A well-structured dashboard should display RevPAR alongside its two key components: Average Daily Rate (ADR) and occupancy percentage.
Another essential metric is labor costs, often accounting for 25%–35% of total revenue. Breaking down these costs by department - such as housekeeping, front desk, food and beverage, and maintenance - helps identify inefficiencies. Monitoring the labor cost percentage is particularly useful during peak and off-peak seasons when staffing needs can shift significantly.
Guest acquisition costs (CAC) measure how much it costs to attract each guest from various marketing channels. When paired with customer lifetime value, this metric helps managers pinpoint which channels deliver the best return on investment.
For food and beverage operations, profit margins need separate attention since their cost structures differ from room revenue. Dashboards should show gross profit margins for restaurants, bars, room service, and catering individually, making it easier to see which areas drive profitability.
Lastly, cash flow indicators are key for financial health. Metrics like accounts receivable aging help track overdue payments from corporate clients and group bookings, while working capital ratios assess the property's ability to handle short-term financial obligations, especially during slower periods.
Now, let’s look at how these metrics are gathered from various data sources.
Hospitality dashboards pull data from multiple systems to provide a complete financial overview. Revenue management systems are a primary source, capturing information like room revenue, package deals, and seasonal pricing adjustments.
Point-of-sale systems contribute data for food and beverage operations, including transaction volumes, average check sizes, and product mix analysis. This allows managers to see which items or dining periods generate the best margins.
Payroll systems supply detailed labor cost data, including wages, overtime, benefits, and seasonal staffing expenses. This integration makes it easier to monitor metrics like revenue per employee and labor hours per occupied room, helping managers control costs effectively.
Accounts payable and receivable modules provide insights into cash flow. Dashboards display vendor payment schedules, outstanding invoices, and collection timelines, helping managers better plan for cash needs and payment timing.
Property management systems (PMS) contribute operational data, such as maintenance costs, utility expenses, and guest service charges. By comparing these expenses to occupancy levels, managers can identify cost-saving opportunities.
Finally, procurement and inventory systems add another layer of insight, particularly for food and beverage operations. Dashboards track food costs, inventory turnover, and supplier payment terms, helping maintain the right stock levels while controlling expenses.
With these modules in place, integrating industry-specific systems takes dashboard functionality to the next level.
The real strength of hospitality financial dashboards comes from integrating with specialized platforms. Property Management Systems (PMS) act as the backbone, connecting room inventory, guest profiles, and billing information. This integration enables calculations like rooms revenue per available room and ancillary revenue per guest.
Channel management systems provide booking data from online travel agencies, direct website reservations, and third-party platforms. Dashboards use this data to calculate the true cost of each distribution channel, factoring in commission fees, processing costs, and booking volumes.
Revenue management platforms add dynamic pricing and demand forecasting data. Dashboards can show how pricing adjustments impact overall revenue and evaluate the success of yield management strategies.
Guest relationship management systems contribute customer data, combining guest spending patterns with acquisition costs to calculate lifetime value. This helps managers identify the most profitable guest segments for targeted marketing efforts.
Accounting platforms ensure financial accuracy by reconciling operational data with general ledger entries. Dashboards use this integration to verify that revenue figures align with accounting records, flagging any inconsistencies for review.
Business intelligence tools enhance analytical capabilities by processing large datasets from multiple sources. This allows for advanced features like seasonal demand forecasting and performance comparisons across properties or time periods.
Additionally, integrating with banking systems provides real-time cash flow updates. Dashboards can display daily cash positions, track credit card processing fees, and help optimize cash management during both peak and slow seasons.
Now that the key components have been outlined, the next step is putting your financial dashboard into action and tailoring it to meet the specific demands of your hospitality operation.
Start by identifying the financial challenges your business faces. For instance, larger hotel chains often require tools for managing multiple entities and consolidating reports across properties. On the other hand, smaller boutique hotels might prioritize simplicity and automation over complex features.
Take inventory of your existing systems, such as your Property Management System (PMS), Point-of-Sale (POS) platforms, and accounting software. This list will help you choose a dashboard platform that integrates smoothly with your current tools.
Next, map out your data. Determine where each key metric comes from - like RevPAR from your PMS, labor costs from payroll systems, or food costs from inventory platforms. Create a clear flowchart showing how data moves from these sources into your dashboard, including any calculations or transformations needed.
During the technical integration phase, connect your dashboard to your operational systems. This might involve setting up APIs to pull real-time occupancy and rate data from your PMS, linking POS systems for food and beverage revenue, or syncing with accounting software for expense tracking and ledger reconciliation.
Before launching the dashboard fully, test it alongside your current reporting methods to catch any discrepancies. Pay close attention to revenue recognition timing, as hospitality often involves complex booking and payment cycles.
Finally, train your team and set up access controls. Different roles require different levels of access - department heads need metrics specific to their areas, general managers need property-wide visibility, and finance teams require comprehensive access for budgeting and forecasting.
Once the system is live, customize the dashboard to fit the unique needs of your property.
Hotels and Lodging Properties
Dashboards for these properties often focus on room revenue metrics like RevPAR, Average Daily Rate (ADR), and occupancy percentage. They may also need to account for management agreements and revenue-sharing models.
Resort Operations
Resorts typically have varied revenue streams, including spa services, golf courses, activities, and multiple dining outlets. Dashboards for resorts should track these streams and include tools for managing seasonal occupancy fluctuations.
Restaurant Operations
Restaurants rely on metrics like food cost percentages and Revenue per Available Seat Hour (RevPASH). Dashboards for this sector often emphasize operational efficiency, helping managers make quick decisions in a fast-paced, low-margin environment.
Multi-Property Portfolios
For operators overseeing several properties, dashboards need to provide both a consolidated performance view and the ability to drill down into individual locations. Comparative tools can highlight top and underperforming properties.
Event Venues and Conference Centers
Dashboards for these venues focus on metrics like booking lead times, space utilization, and catering profit margins. Since revenue patterns often vary significantly based on event schedules, forecasting tools are particularly important.
The size of the operation also affects customization. Smaller independent properties benefit from straightforward dashboards with just a few key metrics, while larger hotel chains may require more advanced dashboards with extensive data and analytics capabilities.
A well-designed dashboard can make all the difference in how effectively your team uses it. Start with a clear visual hierarchy - place the most critical metrics, like revenue and profit, in prominent positions using bold colors and larger fonts. Use subtler designs for secondary data.
Color coding is another way to simplify data interpretation. For example, green can indicate positive trends, red can flag issues, and yellow can serve as a warning. Keeping these visual cues consistent across all screens minimizes confusion.
Set data refresh rates to match your operational needs. While revenue metrics might need near real-time updates, cost metrics may only require daily or weekly updates. Always display the last refresh time for clarity.
Mobile responsiveness is essential. Managers who are frequently on the move should be able to access key data on their tablets or smartphones, with the most important metrics optimized for smaller screens.
Drill-down capabilities are also a must. For instance, if food costs seem unusually high, managers should be able to click through to examine specific menu items or inventory details to find the source of the issue.
Add context to your data by pairing figures with relevant information. For example, showing occupancy rates alongside seasonal trends can help managers make better decisions.
Finally, allow users to personalize their dashboards. Team members should be able to set custom alerts, select which metrics are most visible, and create views tailored to their roles. This flexibility ensures everyone gets the insights they need without overwhelming the dashboard.
To keep things running smoothly, optimize performance so that dashboards load quickly, even when dealing with large datasets or multiple locations.
Building on a solid dashboard foundation, advanced analytics and real-time reporting take financial decision-making to the next level by turning raw data into meaningful insights. Modern hospitality financial dashboards aren't just about reporting numbers - they act as strategic tools, helping you anticipate performance trends, spot emerging patterns, and respond quickly to market shifts.
Revenue Forecasting with Historical Data
Advanced dashboards leverage machine learning to analyze historical booking trends, seasonal variations, and market dynamics. This enables accurate revenue forecasts and helps identify periods of fluctuating demand. For example, if your property typically sees a spike in occupancy during a local festival, you can adjust pricing and inventory strategies well ahead of time.
Predictive models also factor in local events, competitor pricing, and past trends to forecast key metrics. For instance, during peak conference seasons, the system might predict higher occupancy, allowing you to plan staffing and inventory more effectively.
Dynamic Pricing Recommendations
Dashboards analyze ongoing booking trends and competitor rates to suggest optimal room pricing. This ensures you capture revenue opportunities while staying competitive in the market.
Cost Trend Analysis
By comparing current expenses to seasonal norms, dashboards can flag unusual increases in food or labor costs. This gives managers an early warning to address potential issues before they hurt profitability. For example, if rising food costs are detected, the system might recommend renegotiating supplier contracts or adjusting menu pricing.
These predictive tools seamlessly integrate with real-time monitoring and scenario planning, providing a comprehensive approach to financial management.
Live Performance Metrics
Real-time dashboards offer instant visibility into key financial metrics, helping managers identify and act on deviations. For instance, if food costs unexpectedly spike during a busy dinner service, managers can investigate and resolve the issue on the spot.
Scenario Planning and What-If Analysis
Dashboards also include tools for modeling various business scenarios. Managers can tweak variables like occupancy rates or operating costs to see how they impact profit margins. This is especially useful during budgeting and strategic planning.
Adapting to Market Conditions
By integrating external data like event calendars or weather forecasts, dashboards add valuable context to financial performance. For example, if bad weather is expected to lower restaurant traffic, managers can adjust staffing levels or inventory orders to minimize waste.
These real-time insights, combined with automation, make decision-making faster and more efficient.
Smart Alert Systems
Dashboards use machine learning to understand typical performance patterns and send alerts for anomalies. Unlike generic alerts, these are highly specific - distinguishing between expected seasonal dips in revenue and unexpected downturns - so managers can focus on what truly matters.
Automated Reporting and Analysis
Automated tools compare actual performance against forecasts, generate targeted alerts, and produce custom reports. This frees up management to focus on strategic initiatives rather than routine data crunching. For example, if revenue falls short of projections, the system can quickly identify whether the issue lies in occupancy, average daily rates, or ancillary spending.
Operational Integration
Advanced dashboards link financial data with operational metrics to create a complete picture of business performance. For example, they can connect guest satisfaction scores to revenue per guest or tie maintenance costs to property condition ratings.
These connections often reveal insights that purely financial analysis might miss. A property with higher maintenance spending, for instance, might see improved guest satisfaction, leading to opportunities for premium pricing and higher revenue.
Advanced dashboard technology can be a game-changer, but its true value lies in how it’s implemented. Many hospitality businesses struggle to turn raw data into actionable insights, which is where financial advisory services step in. These services provide the expertise needed to connect powerful technology with strategic financial management, ensuring dashboards deliver real results.
Financial advisors play a key role in transforming business data into strategic decisions, especially in the hospitality sector. With its multiple revenue streams and intricate cost structures, this industry demands a higher level of analysis. Advisors don’t just help with the setup - they also refine systems and guide actionable strategies.
System Evaluation and Data Prioritization
Advisors start by assessing existing systems and identifying reporting needs. They focus on maximizing the use of data by prioritizing metrics that drive impactful decisions. The goal is to pinpoint which dashboard elements will make the biggest difference for the business.
Process Automation and Efficiency Gains
A major benefit of bringing in advisors is their ability to identify repetitive, manual tasks that can be automated through dashboards. The rule of thumb? If a process is repeated three or more times, it’s time to automate it.
This is particularly useful in hospitality, where managers often spend hours compiling reports like occupancy rates, food cost analyses, and labor efficiency metrics. By transitioning these tasks to automated dashboards, advisors help reduce errors and free up time for more strategic work.
Strategic Implementation Planning
Advisors often recommend starting with the finance team when rolling out dashboards. This allows businesses to test automation and analytics within a controlled environment before expanding to other departments.
Data Visualization and Trend Analysis
Advisors also help businesses uncover hidden insights by creating effective visualization frameworks. These frameworks reveal trends and connect operational metrics to financial outcomes, making it easier to identify opportunities for improvement.
Using these methods, Phoenix Strategy Group has developed a hands-on approach to optimizing hospitality dashboards.
Phoenix Strategy Group specializes in enhancing dashboard implementation with advanced financial modeling and real-time data integration. Their expertise, particularly with growth-stage companies, makes them a valuable partner for hospitality businesses looking to scale and improve financial transparency.
Integrated Financial Modeling
Phoenix Strategy Group goes beyond basic dashboard setups with their Integrated Financial Model, which connects all aspects of hospitality operations. For example, they link room revenue with ancillary services, align labor costs with occupancy trends, and model the financial impact of seasonal shifts or special events.
Real-Time Data Synchronization
The group’s data engineering capabilities ensure seamless connections between hospitality systems and dashboards. Their Monday Morning Metrics approach provides managers with a clear view of key performance indicators (KPIs) at the start of each week, covering everything from revenue per available room to food cost percentages and labor efficiency.
Strategic KPI Development
Phoenix Strategy Group also develops tailored KPIs that align with specific business goals. Instead of relying on generic metrics, they focus on measurements like guest lifetime value, seasonal revenue optimization, and department-specific profitability, all of which help drive meaningful improvements.
FP&A Systems Integration
Their expertise in financial planning and analysis ensures dashboards are not just operational tools but also strategic ones. By connecting daily metrics with long-term forecasting models, Phoenix Strategy Group helps hospitality businesses make informed decisions about expansion, renovations, and market strategies.
What sets Phoenix Strategy Group apart is their focus on practical solutions. Their dashboards are designed for real-world use, helping hospitality managers make better decisions on both a daily and strategic level. Their experience with revenue analysis and unit economics is especially valuable for businesses managing multiple revenue streams and complex cost structures.
Even the most advanced dashboards can fall short if they're not regularly updated or aligned with your business goals. In the fast-moving hospitality industry, dashboards need to stay accurate, relevant, and actionable. Knowing how to maintain these tools and avoid common mistakes can turn them into a powerful asset instead of a source of confusion.
Accurate data is the backbone of sound decision-making. In hospitality, where margins are tight and decisions are often made on the fly, even small errors can lead to costly missteps. Regular maintenance and validation are critical to keeping your dashboard reliable.
Set Up Regular Data Audits
Schedule routine data checks to catch errors early. Focus on key metrics like revenue per available room, food costs, and labor expenses. Use a checklist to compare dashboard data with figures from systems like your property management software or point-of-sale platforms.
Keep an Eye on Data Source Connections
Dashboards pull data from multiple systems, and connection issues can cause delays or gaps. For instance, if a key performance indicator suddenly deviates from the norm, the system should flag it for immediate review.
Ensure Cross-System Consistency
Revenue figures on your dashboard should match your accounting records. Even small discrepancies could point to integration issues. Regularly reconciling dashboard totals with financial statements ensures accuracy and builds trust in the data.
Define Your Metrics Clearly
Avoid misunderstandings by documenting what each metric represents. For example, clarify whether "occupied room revenue" includes taxes and fees or just the base rate. Clear definitions make it easier to spot and fix errors.
Dashboards are most effective when they directly support your business goals. Unfortunately, many hospitality businesses track metrics simply because they’re available, not because they lead to meaningful action.
Start with Your Strategic Goals
Design your dashboard around your core objectives. Are you trying to boost guest satisfaction, control labor costs, or grow revenue? Each goal will require a different set of metrics and visualizations.
Link Daily Metrics to Big-Picture Goals
Good dashboards show how daily operations affect long-term outcomes. For example, tracking daily labor hours alongside monthly profit margins can highlight how operational efficiency impacts overall profitability.
Tailor Dashboards to Roles
Different team members need different insights. Front desk managers might focus on real-time occupancy and guest service alerts, while general managers benefit from financial trends. Finance teams need detailed cost breakdowns and variance analyses.
Focus on Controllable Metrics
Concentrate on metrics your team can influence. While market-wide occupancy rates provide helpful context, they’re largely out of your control. Instead, prioritize metrics like upselling success, operational efficiency, and guest satisfaction scores.
Even with best practices in place, some common missteps can undermine your dashboard’s effectiveness. Here’s how to sidestep these pitfalls:
Too Much Information
Overloading your dashboard with data can overwhelm users and obscure key metrics. Stick to a handful of critical metrics to keep the focus on what matters most.
Overemphasis on Financial Metrics
While financial data is important, dashboards that only track revenue and costs may miss other valuable indicators. Include metrics like guest satisfaction and employee retention for a more complete picture.
Ignoring Mobile Accessibility
Hospitality managers are often on the go, so dashboards that only work on desktops can be limiting. Make sure your dashboard is mobile-friendly to allow real-time access to critical data.
Skipping User Training
Even the most intuitive dashboards require training. Teach your team how to interpret and act on the data. Explaining the reasoning behind the numbers can improve financial understanding across your organization.
Failing to Update Metrics
As your business evolves, your dashboard should too. Regularly review and update metrics to ensure they align with current goals and market trends.
Overlooking Data Security
Protect sensitive information with strict access controls. Assign user permissions based on roles, and conduct regular security audits to safeguard your data.
Dashboards should be treated as living tools that adapt to your business's needs. By keeping them well-maintained, aligned with your strategy, and free of common errors, you’ll create a system that supports smarter decisions and improves overall performance. These practices ensure your dashboard remains a valuable resource for your hospitality operations.
In today’s fast-paced hospitality world, financial dashboards have become more than just helpful tools - they’re essential. These dashboards allow businesses to track real-time performance, keep tabs on critical metrics like RevPAR and labor costs, and make informed decisions. When profit margins are as tight as they often are in hospitality, this level of insight can be the difference between thriving and struggling.
But let’s be clear: a dashboard isn’t just about displaying numbers. To truly make an impact, it takes careful planning, choosing the right KPIs, integrating seamlessly with your existing systems, and ensuring the data stays accurate over time. Dashboards aren’t static - they need to grow and adapt as your business evolves.
Given the complex nature of managing finances in hospitality, having professional guidance can make a world of difference. That’s where Phoenix Strategy Group comes in. They offer a hands-on, data-focused approach tailored to hospitality businesses, whether you’re running a single property or managing a multi-location brand.
Their support goes beyond setting up dashboards. They address broader financial challenges, from securing funding for expansion to preparing lender-ready financial statements and developing cash flow strategies to navigate seasonal fluctuations. With advisors who understand the unique pressures of the hospitality industry, you’ll have the tools to achieve financial clarity faster.
Investing in well-designed dashboards and expert financial guidance delivers real results: better operational efficiency, smoother cash flow, and smarter strategic decisions. In an industry where guest satisfaction, cost management, and revenue growth must work in harmony, having a clear view of your financial health isn’t just an advantage - it’s essential for long-term success.
Ready to take the next step? Whether you’re setting up your first dashboard or upgrading your financial systems, this guide provides the foundation you need to move forward with confidence.
Financial dashboards are a game-changer for hospitality businesses dealing with seasonal revenue swings. These tools offer real-time insights into crucial metrics like cash flow, labor expenses, and inventory. With this data at their fingertips, businesses can fine-tune strategies to navigate both busy and slower seasons. For instance, dashboards can assist in forecasting revenue, streamlining staffing schedules, and managing inventory to cut down on waste.
Beyond day-to-day management, dashboards are excellent for spotting patterns in seasonal revenue and costs. This information empowers businesses to make smarter decisions, like launching off-season marketing campaigns, exploring new income sources (such as hosting events or catering), and maintaining financial health throughout the year. By tapping into these insights, hospitality operators can handle the ups and downs of the industry more effectively and focus on sustaining profitability over the long haul.
When creating a financial dashboard for a multi-location hospitality business, it's important to zero in on key performance metrics that can offer meaningful insights. Here are some of the most important ones to include:
By keeping a close eye on these metrics, you can gain a clearer picture of how each location is performing, spot trends, and make smarter decisions to boost profits and streamline operations.
Advanced analytics paired with real-time reporting give hospitality businesses the tools to make quicker and more informed financial decisions. With real-time insights into key metrics like occupancy rates, revenue streams, and operational expenses, hotel managers can fine-tune pricing strategies, adjust staffing levels, and allocate resources more effectively. The result? A better balance between boosting revenue and keeping guests happy.
Real-time data also makes it easier to spot trends and address potential problems before they grow into bigger challenges. This not only helps streamline daily operations but also enhances overall efficiency. Armed with these insights, your business can stay nimble and competitive in an industry where adaptability is key.