Published on
March 15, 2026

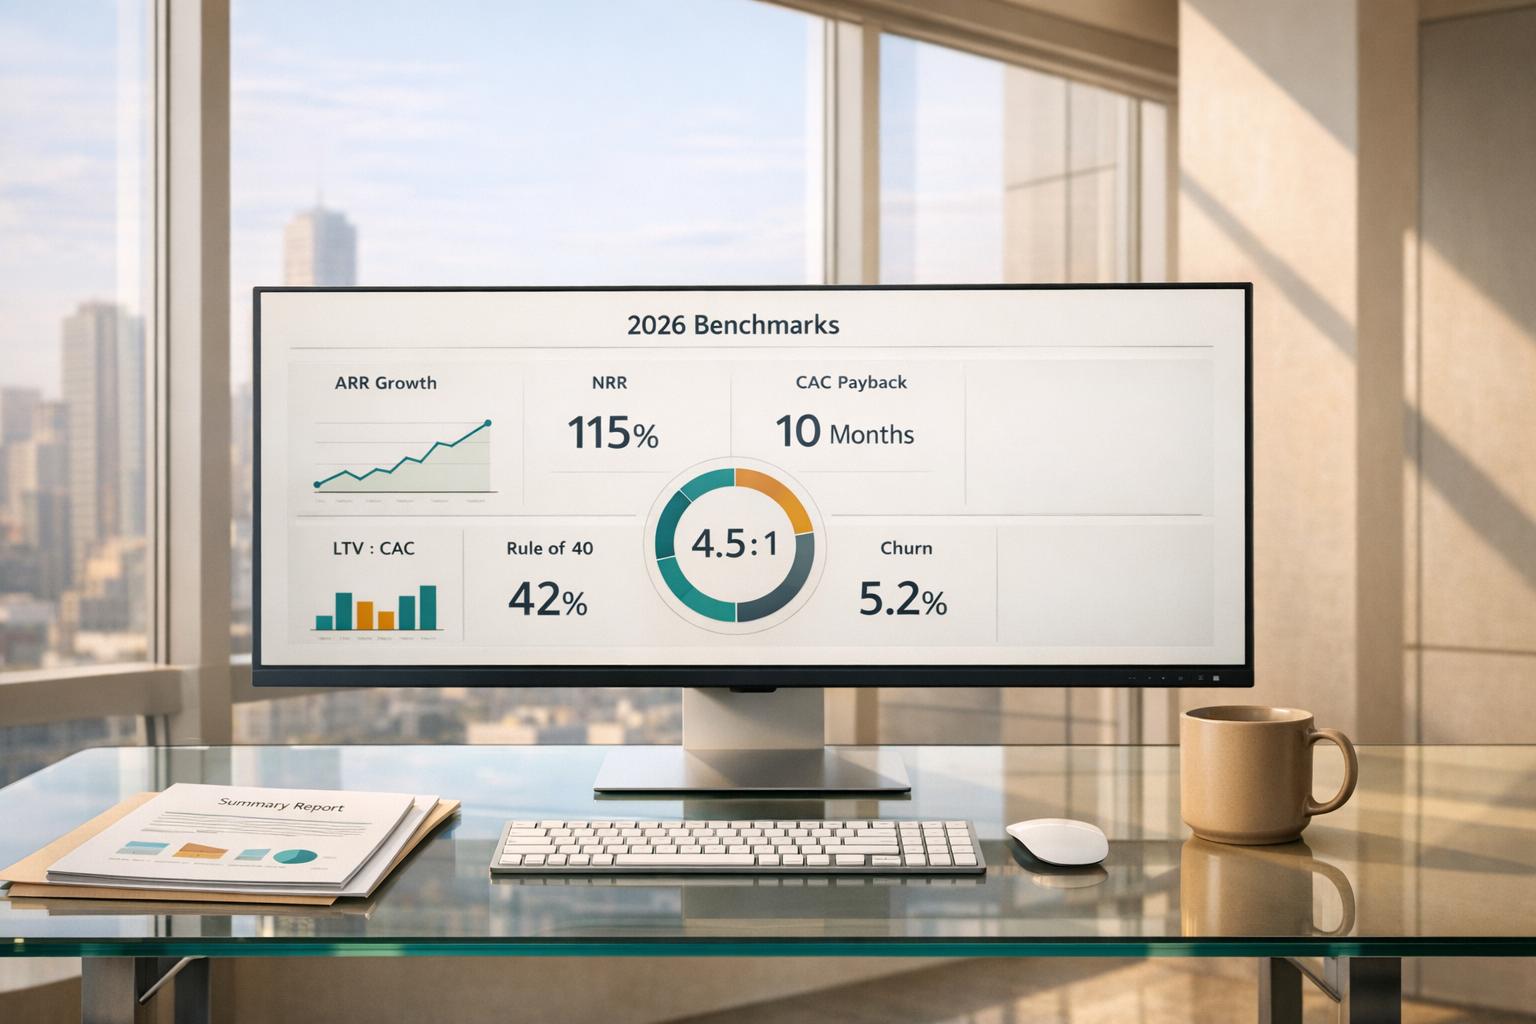
In 2026, SaaS success is all about disciplined growth and healthy metrics. Investors prioritize companies with strong financial systems and efficient growth strategies. Key benchmarks include:
Tracking the right KPIs, like ARR, NRR, CAC, and burn multiples, is no longer optional - it’s essential for growth, funding, and valuation. Investors demand clean, precise financial reporting and metrics tied to real performance, not vanity. SaaS leaders must focus on efficiency, retention, and sustainable growth to thrive in today's competitive market.

2026 SaaS KPI Benchmarks: Key Metrics for Growth and Valuation
Revenue metrics are a key lens through which investors assess SaaS businesses. By 2026, the focus has shifted from chasing rapid growth to prioritizing steady, sustainable expansion. Many firms achieve this by leveraging fractional CFO services to professionalize their financial strategy. The median annual revenue growth for SaaS companies now stands at 26%, a noticeable drop from the 47% recorded in 2024 [2][4][7][8]. This trend reflects the growing emphasis on operational efficiency. Still, top-performing companies maintain growth rates of 50% or more, which requires sharp execution in acquiring, retaining, and expanding their customer base.
Growth expectations now vary by company size. Startups earning less than $1M in ARR often grow by around 100%. Companies in the $1M–$10M range aim for 60–80%, while those with over $50M ARR target annual growth of 20–30% [7][8]. Venture-backed firms generally aim for 25–30% growth, slightly higher than the 20–23% targeted by bootstrapped businesses [4]. AI-native SaaS companies, in particular, are outpacing traditional providers, growing at double the rate across nearly all revenue bands [4].
Recurring revenue metrics like ARR and MRR provide deeper insights into a company's financial health. ARR is often the preferred metric for enterprise SaaS businesses, as most operate on annual contracts. As Dave Kellogg, a seasoned SaaS leader, puts it:
"Most enterprise SaaS companies should use annual recurring revenue (ARR), not monthly recurring revenue (MRR), because most enterprise companies are doing annual, not monthly, contracts" [2].
MRR, however, can still be useful, especially for tracking growth in the early stages. For instance, seed-stage companies (under $1M ARR) should aim for 15–25% month-over-month MRR growth, while Series A companies ($1M–$5M ARR) typically target 10–20% [1]. As businesses scale, MRR growth naturally slows. Growth-stage firms ($20M–$100M ARR) often see monthly increases of 3–8%, while companies with over $100M ARR might only achieve 1–5% - yet these smaller percentages can still lead to meaningful annual gains [1].
Expansion revenue plays a critical role in driving growth. By 2026, expansion accounted for about 40% of total new ARR for the median SaaS company and over 50% for those exceeding $50M ARR [8]. Efficiency benchmarks also highlight trends: the median ARR per employee reached $129,724, signaling how well companies are scaling their teams [2].
Revenue alone doesn’t tell the full story - acquisition costs and payback periods are equally important for gauging efficiency. CAC measures how much it costs to acquire a customer, while the CAC payback period shows how long it takes to recover that investment. In 2026, the average CAC for B2B SaaS companies was about $1,200, but this varies widely depending on the sales approach. For example, self-serve models average around $100, while enterprise deals can exceed $5,000 [11]. Referral programs are among the most cost-effective channels, with CACs near $150, compared to over $2,000 for LinkedIn Ads [11].
Median CAC payback periods for B2B software companies now range from 15 to 18 months, though top-tier performers recover costs in under 12 months [4][7]. Deal size also affects payback timelines: smaller contracts (under $5K) average an 8-month return, while larger deals (over $50K) may take up to 24 months [4]. To maintain healthy growth, many SaaS businesses aim for an LTV:CAC ratio of at least 3:1, with elite companies reaching or exceeding 4:1 [10][12].
A standout example is TestGorilla, an HR tech platform that achieved an 80-day CAC payback period in 2026 while scaling to over 5,000 customers. This efficiency helped secure a $70M Series A funding round, driven by strategies like competitor-focused campaigns and optimized landing pages [7][10][12]. Gene Godick, Founder of G-Squared Partners, highlights the importance of tracking the right metrics:
"The companies pulling ahead are those that pair strong retention with efficient acquisition, and they're able to do this because they have the SaaS accounting and finance systems to measure what actually matters" [4].
ACV offers insight into a company's market position and sales efficiency. As Yusuke Onishi, Founder & CEO of Optifai, explains:
"Your ACV isn't just a number - it's a signal of your market position, sales motion efficiency, and growth ceiling" [13].
In 2026, ACV for B2B SaaS companies typically ranges from $8K to $300K. Early-stage companies (under $5M ARR) average around $12K, while growth-stage firms ($10M–$50M ARR) often achieve $35K [13].
ACV also shapes sales strategies. Companies with ACVs under $5K often use a fully self-serve model. Those with ACVs between $15K and $50K rely on inside sales and SDR-generated leads, while deals above $150K require enterprise field sales and multi-threaded strategies [13]. Industry-specific benchmarks further refine these figures: Enterprise Security averages $180K, DevOps/Infrastructure sits at $85K, and Horizontal SaaS trends closer to $12K [13].
"ACV creep", where average contract values naturally rise over time, is common - most companies see increases of 15–25% annually as their offerings mature and sales teams improve [13]. However, the Optifai Research Team advises caution:
"ACV creep is natural and usually healthy. The danger is when it happens unintentionally" [13].
Warning signs, like declining win rates or prolonged sales cycles, may indicate a misalignment between sales efforts and deal size.
| Customer Segment | Typical ACV Range (Annual) | Sales Cycle | Median CAC Payback |
|---|---|---|---|
| SMB | <$15K | Days to weeks | 8–12 months |
| Mid-Market | $15K–$100K | 1–3 months | 14–18 months |
| Enterprise | >$100K | 3–12 months | 18–24 months |
These metrics provide a comprehensive view of revenue trends and operational efficiency, setting the stage for deeper analysis of customer economics and retention strategies.
Understanding customer economics is key to knowing whether a company’s growth can last. A crucial metric here is the LTV:CAC ratio, which compares the lifetime value (LTV) of a customer to the cost of acquiring them (CAC). In 2026, the median LTV:CAC ratio for B2B SaaS companies is 3.2:1, meaning businesses earn $3.20 for every $1 spent on acquiring customers [14].
The formula for calculating LTV is straightforward:
(Average Revenue Per Account × Gross Margin %) / Monthly Churn Rate [12][1].
For small and medium-sized businesses (SMBs), lifetime value typically ranges from $15,000 to $40,000. On the other hand, enterprise customers can generate LTVs of $300,000 to over $1 million [14]. This difference stems from factors like longer contracts, higher upsell potential, and lower churn rates. Enterprise customers often stay for 5–7 years and may triple their initial contract value through upsells, while SMBs usually stick around for 2–3 years.
The stage of a company also affects these benchmarks. For instance, seed-stage companies (less than $2M ARR) generally see LTVs of $500–$2,000, while those at scale (over $100M ARR) can achieve $20,000–$200,000+ [1]. Early-stage companies may discount projected LTVs by 30% to account for higher churn among their first customers [14]. Even a small improvement in churn - just 1% - can boost a company’s valuation by up to 15% [9].
LTV provides a clear picture of the long-term value a customer brings, while the LTV:CAC ratio evaluates the efficiency of customer acquisition. If this ratio falls below 2:1, it indicates that acquisition costs are too high relative to customer value, making the business model unsustainable. A healthy range is between 3:1 and 5:1, which allows for growth reinvestment while maintaining profitability [14][1]. Ratios above 5:1 suggest excellent efficiency but could also mean the company isn’t spending enough to acquire new customers.
By 2026, the median CAC rose by 14%, making it harder to meet these benchmarks as investors increasingly prioritize sustainable growth over rapid expansion [12]. For example, HR Tech companies average a 3.5:1 LTV:CAC ratio, while cybersecurity firms achieve 4.2:1 [12]. A standout case is TripMaster, a transit software company, which generated $504,758 in net new ARR between 2025 and 2026 by achieving a 650% ROI through focused paid channel strategies. This allowed them to surpass standard LTV:CAC benchmarks [12].
| Company Stage | Average LTV:CAC | Elite LTV:CAC | Target Payback |
|---|---|---|---|
| Seed (<$2M ARR) | 2.5:1 | 3:1 | 120 days |
| Series A/B ($2M–$10M) | 3:1 | 4:1 | 90 days |
| Scale ($10M+ ARR) | 3.8:1 | 5:1+ | 80 days |
For businesses with tight budgets, a shorter CAC payback period can be more critical than high LTV. SMB-focused companies should aim for a payback period under 12 months, while enterprise models might require 18–24 months [14]. Tracking LTV by acquisition source - like organic versus paid channels - can highlight which methods bring the most valuable customers over time [14].
Retention metrics reveal whether a SaaS company can grow its revenue from existing customers. Gross Revenue Retention (GRR) measures the percentage of revenue retained without upsells or cross-sells, while Net Revenue Retention (NRR) includes expansion revenue, showing whether customers are spending more over time [8].
In 2026, the median GRR for B2B SaaS companies ranges from 86% to 88%, while elite companies maintain GRR above 95% [7]. Median NRR has tightened to 101–102%, but top-tier performers still achieve between 110% and 120% [7][4][5].
An NRR above 100% means expansion revenue more than offsets losses from churn or downgrades. Gene Godick of G-Squared Partners highlights:
"Companies with NRR above 100% grow faster than their peers. Tracking NRR accurately requires clean SaaS revenue recognition, proper handling of contract modifications, and the ability to segment revenue by cohort." [4]
High NRR combined with strong CAC payback can drive average growth rates of 71% [4]. By 2024, expansion revenue accounted for 40% of new ARR for the median SaaS company, and for those with ARR above $50 million, this figure exceeded 50% [8]. This reflects a shift toward prioritizing sustainable growth over sheer ARR increases [9].
Retention analysis works best when churn and retention are segmented by customer tier. Blending data from SMB, mid-market, and enterprise customers can obscure specific issues. For example, strong enterprise retention might mask high churn among SMBs. Setting tier-specific retention goals - such as a 90% GRR floor for enterprise customers and an NRR target of 110% or higher - helps identify areas needing attention [8].
Involuntary churn, often caused by failed payments or expired cards, can make up 20–40% of total churn in SaaS businesses [15][16]. Lincoln Murphy, a Customer Success Consultant at Sixteen Ventures, explains:
"The fastest way to reduce churn for most SaaS companies isn't a new feature or a better onboarding flow - it's fixing the dunning sequence. You're literally throwing away revenue that customers want to give you." [15]
Automating dunning processes with multi-channel outreach can increase first-year revenue by 8.6% [15][16].
By 2026, monthly churn benchmarks vary by customer type: SMBs experience churn rates of 3–5%, mid-market companies 1–3%, and enterprise customers just 0.5–2% [7][1]. SMB churn tends to be higher due to lower switching costs and shorter contracts, while enterprise customers stay longer because of deeper integrations and long-term commitments [1][15].
Tracking both logo churn (customer count) and revenue churn (dollar value) can uncover hidden retention issues [15][8]. Voluntary churn often points to product or value gaps, whereas involuntary churn highlights billing inefficiencies. Usage patterns are also telling - customers integrating three or more systems churn at about one-third the rate of those using the product alone [15]. Monitoring early warning signs like reduced login activity, declining feature use, or negative customer support feedback allows businesses to step in before churn occurs. These improved retention practices tie into broader strategies for driving sustainable growth in SaaS companies.
Pipeline and sales conversion metrics are essential for understanding how leads translate into revenue. They work hand-in-hand with customer benchmarks to ensure steady growth, especially for VC-backed SaaS companies. These metrics highlight where revenue opportunities are either captured or lost. For example, the average B2B SaaS sales cycle in 2026 has stretched to 134 days - a 25% increase compared to previous years. On top of that, buying committees have grown significantly, now involving 8–12 stakeholders compared to the earlier norm of 3–5 people [22]. With these changes, pipeline efficiency metrics have become even more crucial for spotting bottlenecks and predicting revenue.
The biggest challenge in most SaaS sales funnels lies in the MQL-to-SQL conversion stage. Industry averages for this step range between 25% and 42%, but top-performing teams can exceed 50%. On the other hand, a conversion rate below 10% often signals issues like poor lead scoring or unclear definitions [18][19]. Interestingly, SEO-driven leads convert at a much higher rate - 51% - compared to PPC leads, which average only 26% [19].
Once a lead qualifies as a SQL, the conversion to opportunity usually falls between 40% and 48%, with the best-performing teams hitting 55% or higher. The final stage, opportunity-to-close, averages 31% to 39% for most deals. However, enterprise deals - due to their complexity - tend to hover closer to 31% [17][20]. Demo-to-opportunity rates are notably strong, averaging between 60% and 80%, with elite teams surpassing 90% [18]. Across the entire funnel, MQL-to-close conversion rates typically range from 1% to 7% [21].
Timing also plays a huge role. Leads contacted within five minutes are 21 times more likely to convert than those reached after 30 minutes [21]. A great example of this is Playvox, which in 2025 managed to reduce its cost per lead by 10× and boost lead volume by 163% using intent-based targeting and strategic negative keyword optimizations in paid search campaigns [18][24].
| Funnel Stage | Industry Average | Top 10% Performers |
|---|---|---|
| MQL to SQL | 25–42% | 50%+ |
| SQL to Opportunity | 40–48% | 55%+ |
| Opportunity to Close | 31–39% | 35–44% |
| Full Funnel (MQL to Close) | 1–7% | 10%+ |
With these conversion benchmarks in mind, the next step is ensuring that pipeline coverage aligns with revenue goals.
A solid pipeline coverage ratio is key to turning conversion rates into predictable revenue. This ratio measures how much pipeline value is needed to meet a revenue target. It’s calculated by dividing the total pipeline value by the revenue goal for a specific period. For mid-market SaaS companies, a ratio of 3–5× is typical - meaning $3 to $5 in pipeline is needed for every $1 of revenue target. SMBs usually operate on the lower end (3–4×), while enterprise companies often require 4–6× coverage [19][23].
Pipeline velocity connects this ratio to actual revenue flow. It’s calculated using the formula:
(Number of Opportunities × Win Rate × Average Deal Value) ÷ Sales Cycle Length [8][22].
A healthy pipeline velocity benchmark is around $1,847 per day [22].
"Stages don't kill deals. Stalled velocity does. A deal that moves through seven perfectly labeled stages but takes 200 days is worse than a messy three-stage process that closes in 60."
Real-world examples highlight the importance of efficient pipeline management. For instance, in 2025–2026, Snyk saw a 180% increase in its AE-sourced pipeline after using Prospeo's data verification tools. These tools helped 50 Account Executives avoid wasting time on outdated contact data [22]. Similarly, Meritt reduced its email bounce rate from 35% to under 4% in 2025, which tripled its overall pipeline [22].
Balanced SaaS strategies aim for marketing-sourced pipeline to contribute 30–50% of the total. With 61% of B2B buyers preferring a rep-free experience, tracking Product-Qualified Leads (PQLs) and in-product activation has become a critical part of pipeline metrics in 2026 [8]. Additionally, separating metrics for new-logo pipeline versus expansion pipeline is vital, especially as expansion ARR now accounts for 40% of total new ARR [8].
The SaaS world has shifted gears, moving away from the "growth at all costs" mindset to prioritize "disciplined growth" - a focus on efficient use of capital and healthy unit economics. This change isn't just philosophical; it directly impacts valuation. Companies with Rule of 40 scores above 60% see valuations 2-3× higher than those with scores below 20% [6]. In this landscape, choosing the right metrics to track isn't just important - it’s a direct driver of company value.
Investors now expect sustainable performance rooted in strong unit economics. Metrics like form fills or MQL counts that once excited founders are no longer enough. Growth-stage investors demand investor-ready metrics tied to clean financial systems and predictable revenue streams [4][25]. As Zach Holland, Founder of Averi, explains:
"Sustainable growth is now valued higher than hypergrowth with terrible unit economics" [6].
This shift sets the stage for understanding how traditional activity metrics have evolved into revenue-focused KPIs.
What separates activity metrics from outcome-driven KPIs? Predictive power. Activity metrics like form fills, cost per lead, and demo counts measure effort. In contrast, KPIs such as CAC payback period, pipeline velocity, Net Revenue Retention (NRR), and the Burn Multiple predict scalability and long-term success [9][26].
Take Lead Velocity Rate (LVR) as an example. It measures the month-over-month growth of qualified leads, offering a glimpse into future revenue potential. Adobe Sign (formerly EchoSign) leveraged LVR to maintain predictable growth after hitting $1M in ARR, targeting 10% monthly growth initially and adjusting to 8% as they scaled to $3M ARR [26]. Jason Lemkin, Founder of SaaStr, highlights its importance:
"the most important metric in SaaS because it clearly shows future growth potential" [26].
Another critical KPI for 2026 is all-inclusive CAC, which accounts for every dollar spent on customer acquisition - from salaries to software. This level of transparency is vital because while sales and marketing spend as a percentage of revenue has dropped to around 30%, the cost per net new ARR dollar has climbed from $1.24 to $2.08, reflecting declining acquisition efficiency [3].
The Burn Multiple has also emerged as a key indicator of efficiency. It’s calculated as Net Cash Burn ÷ Net New ARR, showing how much cash is spent to generate each dollar of recurring revenue [25][6]. Holland underscores its importance:
"If your burn multiple is 3 or higher, you're spending $3 for every $1 of new ARR... You've got a capital efficiency problem" [6].
A healthy burn multiple is below 2.0, with top-performing companies aiming for less than 1.0 [6].
| Metric Category | Older Activity-Based Metrics | 2026 Outcome-Focused KPIs |
|---|---|---|
| Marketing | Form fills, Cost per Lead (CPL) | Lead Velocity Rate (LVR), Magic Number |
| Sales | Number of calls, Demo counts | Pipeline Velocity, CAC Payback Period |
| Retention | Logo Churn | Net Revenue Retention (NRR), Gross Revenue Retention (GRR) |
| Efficiency | Total Spend, Headcount | Burn Multiple, Rule of 40, ARR per Employee |
Defining the right KPIs is just the beginning. How you report them is equally important. By 2026, successful SaaS companies have adopted a two-level reporting approach: high-level executive scorecards and detailed operational dashboards [25][9]. Each serves a distinct purpose. Executive scorecards highlight long-term health and investor-grade metrics, while operational dashboards focus on day-to-day execution and leading indicators.
The Executive Scorecard typically includes metrics like the "SaaS Triangle" - Gross Margin (75%+), CAC Payback (<15 months), and NRR (101%+) [4]. It also tracks the Rule of 40, Burn Multiple, and ARR growth. These metrics address the key investor question: Can this business scale sustainably without constant external funding? As Kishen Patel, Founder of Consult EFC, explains:
"Investors don't need perfection, they need consistency. If your MRR moves because you changed the rules (not because the business changed), you lose trust fast" [25].
Meanwhile, the Operational Dashboard focuses on actionable metrics that teams can influence directly. These include Customer Engagement Scores (CES), Feature Adoption Rates, Lead-to-Customer conversion, and Net Promoter Scores (NPS) [9]. Such metrics help teams identify potential issues - like churn - before they escalate. For instance, a drop in engagement scores might signal future churn weeks before it appears in retention reports, giving teams time to act.
To avoid information overload, companies should limit dashboards to 10-12 actionable metrics tied directly to growth, retention, and efficiency [9]. Bhavya Tiwari of Visdum sums it up well:
"The age of vanity metrics is long gone. In 2025, SaaS success isn't defined by how fast you grow, but by how sustainably you do it" [9].
Phoenix Strategy Group supports growth-stage companies in implementing these frameworks by integrating financial models with real-time data. By creating a "single source of truth" that aligns MRR with invoicing and captures all sales and marketing costs, companies can track KPIs with the accuracy investors demand [25][4].
When it comes to disciplined growth, clean financial reporting is the backbone of demonstrating steady performance to investors. It’s not enough to simply choose the right KPIs; you also need systems that track them accurately. This is how you prove whether your business is scalable or financially unclear. By 2026, clear financials could push valuation multiples from 4x to 8x [25]. On the flip side, companies that can’t deliver reliable NRR figures or explain monthly MRR changes in under a minute often struggle with fundraising and M&A opportunities.
Beyond just tracking KPIs, having a transparent data infrastructure is key to building investor trust.
Accurate KPI tracking starts with a solid foundation of clean, organized data. This means having detailed, plain-language records, such as customer lists with unique IDs and segments, subscription details (plans, seats, start and end dates), invoices, payments, cancellations, and a breakdown of sales and marketing expenses [25]. Without this clarity, even the most advanced dashboards can produce misleading insights.
Standardized definitions are essential. Companies need clear, written rules for metrics like MRR and churn - whether it’s logo churn or revenue churn - and what qualifies as an "active" customer. Mixing cash and accrual accounting or tweaking definitions mid-year can send up red flags during due diligence [25][27].
Automation can take much of the guesswork out of financial reporting. Relying on manual spreadsheets often fails when dealing with complex contracts, cohort analysis, or allocating costs between COGS and operating expenses [4]. Basic accounting tools can fall short when it comes to generating reliable NRR figures, making it harder to detect churn trends or identify expansion opportunities. Monthly MRR data must align with the billing system, and enforcing a strict month-end cut-off (e.g., 23:59 UTC) ensures consistent reporting [25]. By automating processes and locking in clear definitions, companies can maintain audit-ready financials with far greater ease.
Investors prioritize consistency and transparency above all else. For instance, a 77% gross margin built on honest cost allocation is far more credible than an inflated 85% margin that doesn’t hold up under scrutiny [27]. Common red flags during due diligence include counting free trials as MRR, leaving out founder time or customer success costs in CAC calculations, and misclassifying expenses between COGS and operating costs [25][4].
A fully loaded CAC calculation is critical. This means including every expense tied to customer acquisition - salaries, commissions, tools, events, agency fees, and even allocated overhead [4]. Incomplete calculations can create a misleading sense of profitability and lead to scaling issues. Similarly, gross margin reporting must account for all relevant COGS, such as hosting, infrastructure, customer support, and professional services [27].
Phoenix Strategy Group works with growth-stage companies to build reliable financial systems. By creating a single source of truth that integrates MRR with invoicing, captures all sales and marketing costs, and automates reconciliation processes, they help businesses stay audit-ready. They also document normalization rules - like handling foreign exchange conversions, annual prepayments (converted to monthly equivalents), and promotional discounts. This approach not only supports fundraising but also informs strategic decisions about pricing, hiring, and scaling [25].
Through extensive benchmarking of revenue, customer economics, and pipeline metrics, one thing is clear: maintaining sustainable unit economics is at the heart of VC success. As SaaS companies gear up for 2026, the focus has shifted from chasing unchecked growth to prioritizing efficient growth. This balance between revenue growth and profitability is often assessed using the Rule of 40, where top-performing companies achieve scores of 60% or higher. These high scores translate into valuations that are 2–3x greater than those of peers scoring below 20% [6].
Key performance standards have become stricter across the board. Among these, Net Revenue Retention (NRR) stands out as the most reliable predictor of long-term success. Best-in-class companies consistently maintain NRR rates between 120% and 130% [6]. Expansion revenue has also become a critical driver, now contributing about 40% of total new ARR. This makes retention-focused strategies more important than ever [8][6]. On the flip side, customer acquisition costs (CAC) have become harder to recoup, with median CAC payback periods stretching to 18 months. Companies unable to sustain an LTV:CAC ratio of at least 4:1 often face challenges in securing additional capital [4][6].
Accurate financial records have never been more crucial for valuation. As Zack Holland, Founder of Averi, explains:
"The era of infinite capital and vanity metrics has given way to... disciplined growth, unit economics that drive real growth" [6].
In fact, clean and precise financial tracking can mean the difference between earning a 4x or an 8x valuation multiple [25].
Knowing how your company’s metrics stack up against industry benchmarks provides the insight needed to make informed decisions - whether you're raising funds, planning an exit, or scaling operations responsibly. Phoenix Strategy Group specializes in helping growth-stage companies establish the financial systems necessary to monitor these KPIs, maintain audit-ready records, and demonstrate sustainable unit economics to investors.
In 2026, investors are focusing on key metrics that highlight sustainable growth in the SaaS industry. These include:
These metrics collectively point to efficiency and scalability, which are essential for attracting investors and ensuring long-term success in the SaaS space.
To figure out Net Revenue Retention (NRR), start by adding revenue from expansions, then subtract any losses from contractions and churn. Once you have that figure, divide it by the starting Monthly Recurring Revenue (MRR).
For Gross Revenue Retention (GRR), expansions are left out of the equation. Simply take the retained revenue and divide it by the starting MRR.
Make sure the data you use - starting MRR, expansions, contractions, and churn - is accurate and corresponds to the same time period. Keeping a close eye on these metrics regularly can give you valuable insights into customer health and growth patterns for your SaaS business.
A burn multiple below 1.5x is generally a positive sign, indicating your company is using cash efficiently compared to the new ARR (Annual Recurring Revenue) being generated. On the other hand, a burn multiple exceeding 2.0x could suggest overspending, which might increase financial risk. Keeping an eye on this metric is crucial for evaluating your company's financial health and long-term stability.