Published on
April 28, 2026

If you're managing or investing in a venture capital (VC) fund, understanding Internal Rate of Return (IRR) is crucial. IRR measures how fast an investment grows annually, factoring in the time value of money. Unlike MOIC, which shows total return, IRR emphasizes timing - key for comparing deals, evaluating fund performance, and making smarter investment decisions. Here's what you need to know:
XIRR function for irregular cash flows, ensuring accurate annualized return calculations.Before getting into the nuts and bolts of building models, it's important to grasp what IRR represents and how it stands apart from other metrics used to evaluate venture capital (VC) performance.
Internal Rate of Return (IRR) represents the annualized rate at which the net present value (NPV) of all cash flows equals zero [4]. In simpler terms, it reflects the investment's annual compound growth rate.
In venture capital, IRR is typically broken down into two types: Gross IRR (or Deal IRR) and Net IRR. Gross IRR measures the portfolio's performance before accounting for fees, while Net IRR factors in fees and carried interest [5][7].
There's also a distinction between realized and unrealized IRR. Realized IRR focuses on cash distributions from exited investments, while unrealized IRR relies on current valuations to gauge ongoing performance. For early-stage funds, a net IRR of at least 30% is often the goal, whereas later-stage funds aim for around 20%. In practice, top-quartile VC funds frequently achieve net IRRs of 25% or more, while median funds generally fall between 12% and 18% [2][4].
A key concept in VC is the J-Curve effect. This describes how funds typically show negative or low IRRs during the first 1–3 years. The reason? Management fees are paid upfront, and investments take time to mature and generate returns. Additionally, many funds include a hurdle rate - usually around 8% - that must be met before General Partners can collect carried interest [4][8].
This focus on timing and cash flow sets IRR apart from other metrics in venture capital.
The main difference between IRR and other metrics lies in its emphasis on timing. Unlike MOIC (Multiple on Invested Capital), which tells you the total return - say, 3.0× your investment - IRR considers how quickly that return was achieved. Timing is everything.
Take TVPI (Total Value to Paid-In) as an example. A TVPI of 1.25× in the first year signals strong early momentum, while the same figure in year five might indicate slower growth. Similarly, DPI (Distributed to Paid-In) measures the actual cash returned to investors but ignores the unrealized value of the remaining portfolio. This makes IRR especially useful for comparing funds from different vintage years or benchmarking VC performance against public markets.
However, IRR isn't without its flaws. It assumes that all interim cash flows are reinvested at the same rate as the IRR itself - an assumption that rarely holds true in venture capital. This means IRR shouldn't be looked at in isolation. A high IRR from a quick flip might result in only modest profits, while a lower IRR over a longer timeframe could represent significant wealth creation [4][9].
To calculate IRR accurately, you need to organize your data in chronological order. Properly structuring your inputs makes building the model much simpler and ensures reliable results.
Start by recording each capital transaction along with its exact date in the format MM/DD/YYYY. Capital contributions should always be entered as negative values, while distributions and any residual NAV (for ongoing funds) should be positive. It's also essential to differentiate between gross cash flows (before fees) and net cash flows (after fees) [1][10].
Once you've identified these data points, the next step is arranging them in a logical format for Excel analysis.
Set up your data chronologically, and include the following columns: Date, Amount, Currency, Entity Name, and Transaction Type (such as Capital Call, Distribution, Fee, or NAV). Make sure that:
"A cash flow statement that does not reconcile to the P&L... fails the credibility test before a single question is asked."
- Lorenzo Nourafchan, Founder & CEO of Northstar Financial [12]
When creating detailed cash flow projections, remember to account for fully loaded headcount costs. This means adding approximately 20–25% to base salaries to cover benefits and employer taxes [12].
To simplify the process, use a standardized CSV format with clear column headers (Date, Amount, Currency, Entity Name, and Transaction Type). This minimizes manual errors and makes it easier to import data into Excel for XIRR calculations [11]. Following this structured approach ensures that every cash flow is captured accurately, forming a solid foundation for reliable IRR modeling. For additional guidance, consider exploring resources from Phoenix Strategy Group.

IRR vs XIRR Excel Functions Comparison for VC Fund Modeling
Once your data is organized, the next step is to construct your IRR model in Excel. Picking the right function and setting up your timeline properly is key to getting accurate results.
Excel provides two functions for calculating IRR: IRR and XIRR. The IRR function assumes that cash flows occur at regular intervals, such as annually. On the other hand, the XIRR function allows you to use specific dates for each cash flow, making it ideal for situations where cash flows are irregular.
For venture capital funds, the XIRR function is the better choice. Since capital calls and distributions often happen at unpredictable intervals, XIRR ensures an accurate calculation of annualized returns.
"If you are dealing with anything besides annual distributions, XIRR should be your preferred IRR function... XIRR will provide you with a more flexible and accurate calculation, especially if you are working with daily distributions." - Eric Bergin, Founder, TSM Financial Models [14]
| Feature | IRR Function | XIRR Function |
|---|---|---|
| Cash Flow Timing | Assumes regular, equal intervals | Accommodates irregular, specific dates |
| Required Arguments | values | values, dates |
| Best Use Case | Standardized periodic reporting | Investments with irregular cash flows |
| Result Type | Periodic rate (manual annualization) | Automatically annualized rate |
To use the XIRR function, you need two inputs: a range of cash flow values and a corresponding range of dates. These ranges must match in size and be correctly aligned. XIRR then calculates an annualized rate of return, regardless of whether the cash flows occur daily, monthly, or quarterly.
Next, let’s look at how to set up your cash flow timeline for the XIRR function.
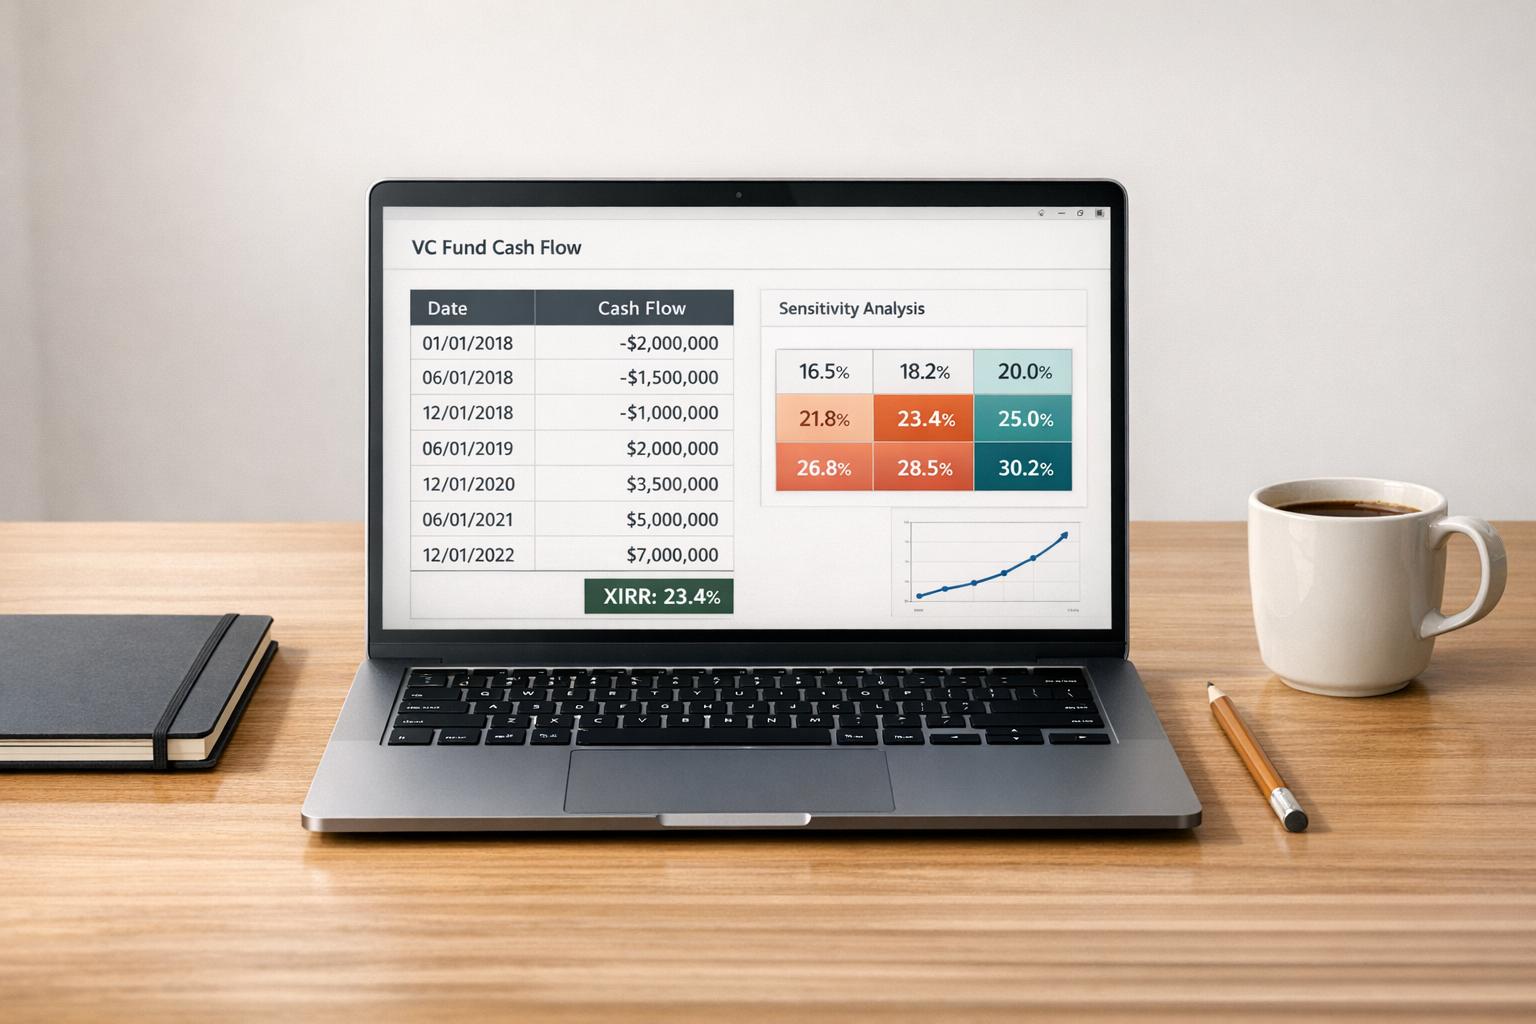
Organize your data in two adjacent columns: one for dates and the other for cash flow values. Begin with the initial investment as a negative value to represent the outflow. Any additional capital calls should also be negative, while distributions and the final net asset value (NAV) should be positive.
Here’s an example layout:
| Date | Cash Flow | Description |
|---|---|---|
| 01/01/2024 | -$1,000,000 | Initial Capital Call (Investment) |
| 06/15/2024 | -$500,000 | Subsequent Capital Call |
| 03/12/2025 | $200,000 | Partial Distribution (Exit A) |
| 12/31/2026 | $2,500,000 | Final Distribution (Fund Liquidation) |
Make sure dates are entered as valid Excel date objects (easily done using the =DATE(year, month, day) function or proper cell formatting). Once your data is ready, use the formula =XIRR(B2:B5, A2:A5).
To confirm that your XIRR result is accurate, use the XNPV function with the calculated XIRR as the discount rate. If the XNPV output is zero or nearly zero, your XIRR calculation is correct.
"The internal rate of return calculated with XIRR is the rate that sets the net present value calculated with XNPV to zero." - Jeff Lenning, Founder, Excel University [13]
If you encounter a #NUM! error, try providing a guess (e.g., 0.1 for an expected positive return) or ensure there’s at least one negative and one positive cash flow in your dataset. A #VALUE! error often means the date and cash flow ranges don’t match in size or formatting. If your result seems unrealistic (e.g., 0.00%), tweaking the guess parameter can help refine the calculation.
Once your IRR model is validated, you’re ready to dive into more advanced scenario analysis. For funds scaling their operations, engaging fractional CFO services can provide the strategic oversight needed to manage these complex models.
Once you've set up your baseline IRR calculations in Excel, the next step is to add scenario and sensitivity analyses. These tools help paint a broader picture of potential fund performance. Since venture capital investments carry a lot of uncertainty, relying on a single projection isn't enough. Instead, aim to calculate multiple IRR outcomes based on varying levels of success and exit conditions [3].
A good starting point is to create three scenarios: Bull, Base, and Bear. For instance, in your Bull case, you might assume the company hits 100% of its EBITDA projections and exits at a 10.0x multiple in Year 4. The Base case could use 75% of the projections with a 7.0x multiple in Year 5, and the Bear case might model 50% performance with a 4.0x multiple in Year 6 [3]. By layering these scenarios onto the structured cash flow and IRR models you've already built, you can better understand the range of possible outcomes.
To build these scenarios, focus on key variables like exit multiples, operating performance, and exit timing [4, 27]. The Base case should align with management's typical expectations. The Bull case assumes an ideal scenario with higher multiples and quicker exits, while the Bear case models more challenging outcomes, such as lower multiples and delayed exits [16].
In Excel, use separate columns or worksheets for each scenario, keeping the layout consistent across all cases. Incorporate a "Live Scenario" section that dynamically pulls from the selected case using functions like CHOOSE or OFFSET [16]. This setup allows you to link live values directly into your cash flow timeline and XIRR formula, making it easy to see how IRR shifts when you toggle between scenarios.
When assigning exit multiples, adjust for the illiquidity of private venture capital investments by discounting the multiples of comparable public companies [3].
While scenarios provide distinct outcomes, sensitivity analysis adds another layer by showing how specific variables influence IRR across a range of values. For example, you can use Excel's Data Table feature to test combinations of exit EBITDA multiples and exit years [4, 9]. A table might display IRR outcomes for multiples ranging from 5.0x to 9.0x, with exit years spanning from Year 3 to Year 5. Applying conditional formatting can help you quickly spot IRRs that meet or exceed your target (e.g., 25%+) or fall below a critical threshold (e.g., under 10%) [17].
"It is recommended by experts to use the weighted average cost of capital (WACC) assessment in conjunction with a scenario analysis and an IRR calculation." - Aysha Saifi [7]
Always include at least two potential exit timelines in your analysis to see how time impacts IRR. For instance, achieving a 3x return in three years results in a much higher IRR than the same return over ten years. A sensitivity grid can make this relationship clear and help you evaluate how timing affects overall performance [3].
Building on earlier discussions about structuring and calculating IRR, it’s important to steer clear of common mistakes that can undermine your model’s accuracy. Even seasoned analysts can slip up, especially when working on IRR models for venture capital funds. These errors can skew results and lead to flawed investment decisions. Recognizing these pitfalls early on can save time and ensure your models are as precise as possible.
One of the most frequent errors is choosing the wrong Excel function. Many mistakenly use the standard IRR() function, which assumes cash flows occur at regular intervals. Venture capital funds, however, deal with irregular cash flows due to sporadic capital calls and distributions. For these scenarios, always rely on XIRR, which accommodates uneven cash flow timing.
Another common oversight is forgetting to include residual value. The current Net Asset Value (NAV) should be added as the final cash flow. Leaving it out can lead to underestimating the IRR.
Confusion between gross and net returns is another trap. Gross IRR reflects the fund's raw performance, while net IRR accounts for fees and carried interest - critical for Limited Partners. For instance, a 2% annual management fee over a 10-year fund lifespan can consume 15% to 20% of committed capital [18]. This distinction is essential when evaluating returns.
Multiple IRR solutions can also pose challenges. If cash flows switch between positive and negative more than once, XIRR may generate multiple results. To eliminate ambiguity, use MIRR with a specified reinvestment rate.
Lastly, don’t fall victim to scale blindness. IRR represents a rate of return and doesn’t reflect the size of the investment. To get a complete picture, compare IRR with metrics like MOIC (Multiple on Invested Capital) and TVPI (Total Value to Paid-In Capital) [20].
Once you’ve addressed common modeling errors, focus on validating your data to ensure accuracy. Start by reconciling total cash flows, making sure they align with capital calls, fees, distributions, and the NAV. This step can help catch discrepancies [19].
Cross-check against benchmark data to spot potential outliers. For instance, as of Q2 2025, the Cambridge Associates U.S. Venture Capital Index reported net pooled returns of 11.44% over a 1-year period and 13.06% over a 10-year period [19]. If your calculated IRR deviates significantly from these figures, revisit your inputs. Early-stage funds generally aim for a net IRR of about 30%, while later-stage or growth equity funds target around 20% over an eight-year span [5].
It’s also critical to differentiate between realized and unrealized returns. Realized IRR is based on actual cash distributed to Limited Partners, while unrealized IRR depends on theoretical valuations, which can sometimes be overly optimistic.
Finally, ensure date formats are correct. The XIRR function requires dates entered using the =DATE() function or standard Excel date formats. Misformatted dates can lead to calculation errors [15].
To wrap up, mastering advanced IRR techniques and avoiding common errors is essential for making informed investment decisions and maintaining trust with Limited Partners (LPs). A flawed IRR model can seriously harm a General Partner's (GP's) credibility. As Dan Clayton, Investment Senior Associate at SVB Capital, aptly stated:
"When a fund model is mathematically wrong, it can give an LP pause on a GP's understanding of institutional fund management" [6].
Using tools like XIRR for irregular cash flows and clearly distinguishing between gross and net returns ensures your forecasts are reliable. For context, early-stage venture capital investors often aim for a 30% net IRR, while later-stage and growth equity investors typically target around 20% [5]. These benchmarks are critical for evaluating whether your projections align with realistic expectations.
Organizing data effectively is another key step - it minimizes the risk of errors that could compromise your analysis [5]. Scenario analysis goes even further by offering a range of outcomes based on varying assumptions, such as different exit multiples or operating conditions [3][8]. This approach not only reduces calculation errors but also strengthens your overall performance evaluation.
It's also important to remember that IRR alone doesn't fully capture the impact of timing. For instance, a 3x return over 3 years is far superior to the same return over 10 years [1]. By combining IRR with metrics like MOIC (Multiple on Invested Capital) and TVPI (Total Value to Paid-In), you gain a more comprehensive view of fund performance [9]. These metrics ensure your model accounts for the critical time value of money.
To calculate net IRR after fees and carried interest, you need to adjust the cash flows accordingly. Start by deducting management fees, fund expenses, and carried interest from the gross cash flows. This will give you the net cash flows. Once you have these adjusted figures, input them into an IRR formula or tool. The goal is to determine the discount rate that brings the net present value (NPV) of all cash flows to zero.
When calculating the IRR for an unrealized fund, you need to account for all cash flows related to investments that haven't been realized yet. The two main components are:
Together, these elements provide a clear picture of the fund's current investment standing, ensuring the IRR calculation reflects its true performance.
The #NUM! error in XIRR often pops up because of issues like invalid or missing dates, zero or negative cash flows, or mismatched date formats. Here’s how to address it:
These simple checks can usually resolve the error.