Published on
December 5, 2025

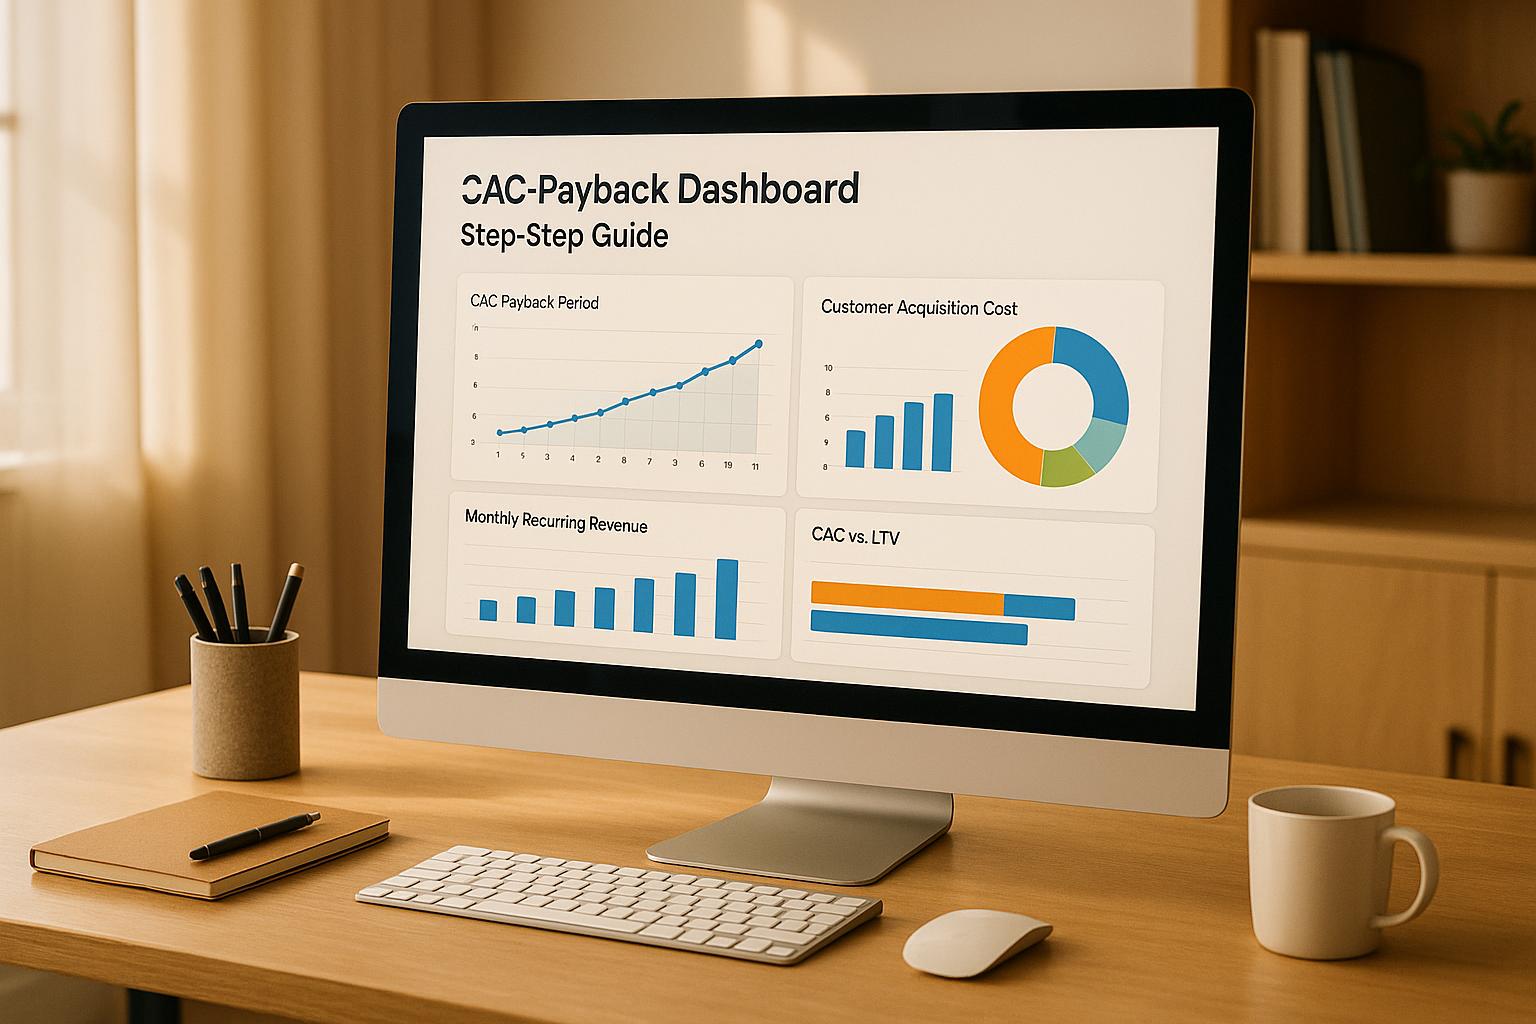
Want to understand how quickly your SaaS business recovers customer acquisition costs? A CAC payback dashboard is the tool you need. It measures the months it takes for gross profit from a customer to offset the cost of acquiring them. This metric is vital for managing cash flow, scaling efficiently, and impressing investors.
Here’s the gist:
A well-structured dashboard eliminates manual spreadsheets, provides actionable insights, and helps SaaS businesses scale smartly while keeping investors happy.
To create a dynamic and accurate CAC payback dashboard, the first step is to identify the metrics and data sources you’ll rely on. This ensures that your organization works with consistent definitions and calculations across the board.
With this groundwork established, you can pinpoint the exact metrics that power your CAC payback analysis.
Three essential metrics form the backbone of your dashboard: Customer Acquisition Cost (CAC), Monthly Recurring Revenue (MRR) per customer, and Gross Margin %. Each one needs to be clearly defined for reliable and repeatable calculations.
Using these metrics, you can calculate CAC payback with two approaches:
What’s considered a "good" payback period depends on your company’s funding and growth stage. Venture-backed SaaS companies typically aim for 12–18 months. A payback period beyond 18–24 months might signal inefficiencies unless growth or lifetime value metrics are exceptional. Bootstrapped SaaS companies often target 6–12 months to maintain healthy cash flow. For instance, a B2B SaaS company spending $1.2 million on sales and marketing (adjusted for sales cycle timing), generating $275,000 in net new MRR, and operating with a 75% gross margin achieved a CAC payback of approximately 5.8 months - an indicator of strong unit economics.
To build an accurate CAC payback dashboard, you’ll need data from three primary systems: your CRM, subscription billing platform, and accounting system. Each provides key inputs for your analysis:
Key fields include:
All financial data should use the USD format (e.g., $1,234.56) and MM/DD/YYYY date format to align with U.S. standards.
Once your metrics and data fields are identified, it’s critical to standardize definitions to ensure clarity across teams.
Start by defining what qualifies as a new customer for CAC calculations. A common approach is to count a unique customer or account ID that generates its first paid subscription (excluding trials) on or after a specific date. This is often tracked using the first_paid_date field to group customers into acquisition cohorts.
Establish rules for edge cases:
Once your metrics and data definitions are finalized, the next step is to create the technical setup that automates data extraction, transformation, and visualization. This involves selecting the right tools and building a pipeline to convert raw data from systems like your CRM, billing platform, and accounting software into actionable insights.
Make sure all financial data is standardized to USD and dates are formatted as MM/DD/YYYY or ISO standards.
A CAC payback dashboard depends on three main components: data integration tools, a cloud data warehouse, and a business intelligence (BI) tool to visualize and share your metrics.
When selecting tools, consider factors like your hosting platform (AWS, Azure, GCP), existing software licenses, the need for governed metrics versus ad-hoc exploration, and the primary users of the data. For CAC payback, prioritize tools that allow you to define reusable metrics (CAC, MRR, gross margin, CAC payback), filter by time periods, and control access based on user roles.
| Component | Options | Best For |
|---|---|---|
| Data Integration | Fivetran, Stitch, Airbyte, native connectors, custom APIs | Automating data extraction from CRM, billing, marketing, and accounting tools |
| Data Warehouse | Snowflake, Amazon Redshift, Google BigQuery, Postgres | Centralized storage and SQL-based modeling of CAC metrics |
| BI Tool | Tableau, Power BI, Looker, Metabase, Looker Studio | Creating dashboards and reports for finance and leadership |
Once you've chosen your tools, the next step is to design and implement your data pipeline.
The CAC payback data pipeline involves four key steps: extracting raw data, transforming it into standardized metrics, validating those metrics, and serving the data to your BI tool.
Once validated, the pipeline serves curated data to your BI tool, where CAC payback is calculated and visualized. Dashboards should refresh monthly for executive reporting, though many teams prefer daily updates for operational purposes.

Building a reliable CAC payback pipeline requires expertise in financial modeling, data engineering, and systems integration - skills that many growing companies lack in-house. Phoenix Strategy Group offers comprehensive Data Engineering services to streamline this process. They handle everything from setting up ETL pipelines and cloud data warehouses to creating analytics models and custom dashboards.
Their team specializes in organizing data from accounting platforms, CRMs, and billing systems to produce metrics like CAC, MRR, and gross margin. With over 200 integrations, they can connect to tools like Salesforce, HubSpot, Stripe, QuickBooks, and more, ensuring seamless data flow across your tech stack.
Creating a dashboard that turns validated data into actionable insights involves a few key steps: setting up essential calculations, designing a layout that works for both executives and operators, and incorporating tools to model different business scenarios.
Your dashboard needs to focus on four key metrics: CAC (Customer Acquisition Cost), MRR per customer (Monthly Recurring Revenue), gross margin, and CAC payback period. These metrics should be filterable by cohort, channel, and customer segment to provide a detailed view.
Organize these metrics into a fact table with dimensions for cohort (e.g., customer start month in MM/YYYY format), channel (e.g., paid search, organic, referral), and segment (e.g., SMB, mid-market, enterprise). This structure allows you to analyze payback metrics by different groups, such as comparing enterprise customers acquired via direct sales to SMB customers from paid search. Use USD for all monetary values and format dates as MM/DD/YYYY for consistency.
To make the data actionable, structure your dashboard into three main zones:
At the top of the dashboard, include filters for time range (e.g., last 3 months, last 12 months, year-to-date), cohort (specific months or quarters), channel, and segment. Set the default view to "all channels, all segments, last 12 months" for executives, while saving more specific filtered views for operational teams. Enable drill-through interactions so users can click on a chart element (like a channel bar) to see campaign details or a list of customers with their metrics. This level of granularity can uncover anomalies.
Here’s an example summary table for the dashboard zones:
| Dashboard Zone | Components | Purpose |
|---|---|---|
| Top Summary | CAC payback (months), CAC, MRR per customer, gross margin %, new customers, net new MRR | High-level snapshot for executives |
| Middle Trends | Line chart of payback over time, combo chart of CAC/MRR/margin drivers | Monitor trends and diagnose performance changes |
| Bottom Decomposition | Bar charts by channel and segment, cohort heatmap | Drill down into efficiency drivers and acquisition trends |
To make strategic decisions more informed, add scenario analysis tools that allow real-time testing of key variables like gross margin, pricing, and expense allocation.
These tools allow decision-makers to simulate strategic adjustments and immediately see their impact on key metrics, making it easier to refine their approach.
A dashboard is only useful if it's actively integrated into daily workflows, with clear accountability and consistent reporting routines. Once you've set up the dashboard and nailed down the calculations, the next step is weaving these insights into your regular operations and financial reviews. This involves assigning ownership, establishing a reporting rhythm that balances speed with accuracy, and tying CAC payback insights to the broader metrics that drive your business.
Let’s dive into how regular reporting and collaboration across teams can turn data into actionable insights.
For SaaS companies in the U.S., two reporting cadences are essential: a monthly close process and a weekly operating view. The monthly close provides finalized CAC payback figures after finance reconciles all sales, marketing expenses, revenue, and gross margin - usually 5–10 business days after the month ends. This monthly dashboard should display the previous 12 months of CAC payback (in months), trend lines against targets (e.g., aiming for under 12 months in venture-backed SaaS), and breakdowns by customer segment and channel.
On the other hand, the weekly operating view offers near real-time data for early trend detection. These reports should be labeled as pre-close to avoid confusion with finalized numbers. For instance, if your weekly data shows CAC payback climbing from 10.5 to 11.2 months over three weeks, it signals a need for investigation before the month officially closes.
Ownership of CAC payback metrics must be shared across finance, marketing, and sales:
These teams should collaborate through monthly reviews and weekly check-ins to ensure alignment.
Incorporating CAC payback into three recurring workflows is a good starting point:
By embedding CAC payback into these processes, you can connect it to other key financial metrics and make more strategic decisions.
Pairing CAC payback with metrics like LTV:CAC and NDR provides a more complete picture of efficiency and long-term customer value. For venture-backed SaaS companies in the U.S., investors often look for an LTV:CAC ratio of at least 3:1, paired with a CAC payback period under 12–18 months. In board presentations, showing CAC payback by cohort alongside LTV:CAC can highlight potential trade-offs. For instance, while an enterprise cohort might have a strong LTV:CAC of 4.2x, a CAC payback of 15 months could strain cash flow and slow scaling. On the flip side, a slightly lower LTV:CAC (e.g., 2.6x) might be acceptable if the CAC payback is rapid (6–8 months), as it improves cash efficiency.
MetricHQ describes CAC payback as "the single best measure of the efficiency of your go-to-market engine" because it combines CAC, new MRR, and gross margin into one metric.[1]
When combined with NDR, CAC payback reveals whether customers who pay back quickly also stick around and expand. For example:
Your dashboard should display NDR alongside CAC payback by channel, segment, and product, helping teams identify and eliminate channels with fast-payback but low-retention customers. Meanwhile, focus resources on cohorts with both efficient payback and strong NDR.
Longer CAC payback periods directly impact cash flow and runway. Finance teams should model scenarios to understand how changes in payback affect cash burn. For instance, if payback increases, monthly burn might rise from $500,000 to $650,000, reducing runway by several months. Use this analysis to establish spending limits, such as: "We can maintain an 18-month runway as long as blended CAC payback remains under 12 months."
In investor presentations, U.S. venture investors typically expect a standardized view of CAC payback in months, broken down by cohort and channel. Best practices include charts showing 12–24 months of CAC payback trends against a target range (e.g., 8–12 months for capital-efficient SaaS), alongside scenario analyses demonstrating how changes in spending affect payback and runway. Clear notes on methodology are crucial to address investor concerns about inconsistent or overly optimistic calculations.
Phoenix Strategy Group can help integrate CAC payback insights into your financial strategy in three key ways:
"Your finance team will not just be tracking numbers, but actively driving growth alongside your revenue operators." - Phoenix Strategy Group
With Phoenix Strategy Group’s expertise, your CAC payback dashboard becomes a powerful tool for driving smarter decisions and aligning teams around shared financial goals.
Creating a CAC payback dashboard can transform how your company understands and manages customer acquisition efficiency. The process begins by defining clear metrics - agreeing on formulas for CAC, MRR or ARPA, and gross margin - and ensuring alignment across finance, marketing, and sales teams. Once metrics are standardized, you’ll need to map and organize data sources from tools like your CRM, billing platforms (e.g., Stripe or Chargebee), and accounting systems. From there, build a reliable data pipeline with quality checks to maintain accuracy. The dashboard itself should include key calculations, such as overall CAC payback in months, along with breakdowns by segment, channel, and cohort. To make it actionable, design intuitive layouts with executive summaries, trend analyses, and diagnostic tabs tailored for U.S. stakeholders - using USD, month-over-month visuals, and standard date formats. Embedding this tool into regular monthly reviews and weekly meetings ensures it remains dynamic and relevant.
With a well-structured data pipeline, the dashboard evolves from a static report into a strategic tool. It consolidates data into a real-time visual overview, eliminating the need for error-prone spreadsheets that quickly become outdated. Automated updates allow for faster quarter-end and board reporting without the hassle of rebuilding models each time.
What’s more, this dashboard enables smarter decision-making and resource allocation. By analyzing CAC payback across channels, segments, and products, leadership can pinpoint where acquisition dollars yield the fastest returns and where adjustments are needed. Scenario views, like testing the impact of pricing changes or gross margin improvements, allow teams to explore growth strategies before committing resources. Industry benchmarks add perspective: bootstrapped SaaS companies often aim for a CAC payback of 6–12 months, while venture-backed firms typically operate at 12–18 months, prioritizing growth over efficiency. By connecting CAC payback to related metrics like churn, LTV, and net dollar retention, the dashboard helps avoid short-term decisions that could hurt long-term profitability or customer retention.
Tracking CAC payback rigorously also demonstrates capital efficiency to investors. Showing how quickly sales and marketing spend converts into recurring revenue is a key metric in U.S. venture and growth equity evaluations. Time-series charts illustrating improvements (e.g., reducing CAC payback from 18 to 12 months) signal operational discipline, which can lead to higher valuations and better funding opportunities. Internally, the dashboard tightens feedback loops: marketing teams can quickly spot if a campaign is dragging down payback, sales can assess discounting’s effect on cash recovery, and finance can adjust hiring and spending plans based on updated cash flow projections. Over time, focusing on CAC payback strengthens cash management, extends runway without compromising growth, and supports smarter scaling into new markets and channels.
A few best practices can help avoid common pitfalls. The reliability of CAC payback depends on accurate data and consistent definitions - mixing one-time revenue with recurring revenue or omitting certain marketing costs can skew results. Since CAC payback doesn’t account for churn, it should always be reviewed alongside LTV, retention, and cohort behavior. Misinterpreting CAC payback as a profitability metric is another common mistake; it measures cash recovery timing, not overall margins. Finally, relying solely on a top-line CAC payback figure can mask unprofitable channels or customer groups. To get the full picture, drill down by channel, segment, and product.
For companies looking to streamline this process, Phoenix Strategy Group offers a comprehensive solution. Their team combines fractional CFO, FP&A, and data engineering expertise to build dashboards that meet U.S. GAAP and investor standards. They integrate CAC payback into rolling forecasts, board presentations, and financial models, while designing automated data pipelines with robust checks. Their experience with fundraising and exits ensures the dashboard highlights efficiency metrics that matter most to investors. In just a few weeks, they can deliver a production-ready dashboard that aligns with broader financial workflows.
Partnering with Phoenix Strategy Group is especially valuable for companies preparing for growth milestones - whether raising a Seed, Series A, or Series B round, scaling acquisition channels, or gearing up for a strategic sale. Their support is ideal when internal teams lack the financial expertise to define investor-grade metrics or the technical resources to automate and scale reporting.
A well-built CAC payback dashboard provides a clear, investor-ready view of cash recovery efficiency, empowering leadership to make confident growth decisions. With the help of experts like Phoenix Strategy Group, companies can implement this tool quickly and effectively, using it to drive scaling, secure funding, and position for a successful exit.
A well-structured CAC (Customer Acquisition Cost) payback dashboard is a powerful tool for SaaS companies. It offers a clear view of how quickly they recoup the costs of bringing in new customers. By monitoring essential metrics - like CAC, monthly recurring revenue (MRR), and payback periods - businesses can make smarter, data-backed decisions to fine-tune spending and boost profitability.
For investors, this type of dashboard is equally valuable. It provides transparency and paints a clear picture of the company’s financial performance and growth efficiency. By highlighting how effectively the business scales and uses resources, it builds trust - an important factor when seeking funding or planning for future exits.
To build a functional CAC (Customer Acquisition Cost) payback dashboard, you'll need to start with the right tools and accurate data. Begin by pulling information from reliable sources like your CRM, marketing platforms, and financial systems. It's crucial to ensure this data is clean, consistent, and regularly updated to maintain accuracy.
Next, choose a dependable data visualization tool such as Tableau or Power BI. These tools allow you to design dashboards that are both clear and user-friendly. Key metrics to include are total CAC, monthly recurring revenue (MRR), and payback periods. Adding visual elements like trend lines, bar charts, and key performance indicators (KPIs) can make your dashboard easier to understand at a glance.
If you'd prefer to simplify the setup process, consider enlisting the help of financial experts like Phoenix Strategy Group. They can provide tailored guidance and help you design dashboards aligned with your business growth objectives.
To make CAC (Customer Acquisition Cost) payback metrics a meaningful part of your financial and operational reviews, incorporate them into your monthly or quarterly reporting routines. By tracking the CAC payback period alongside other key performance indicators (KPIs), you can gauge how quickly your customer acquisition efforts are delivering returns.
A dashboard can be a powerful tool here. Use it to visualize trends and break down the data by customer segments, acquisition channels, or specific time periods. This approach makes it easier to spot inefficiencies and areas for improvement. Furthermore, tie CAC payback metrics to larger financial goals - like profitability milestones or growth plans - so they directly inform your strategic decisions.