Published on
March 6, 2026


Real estate developers need to track key metrics to ensure projects stay profitable and meet financial goals. These five KPIs - ROI, Project Costs, Revenue per Square Foot, Net Operating Income (NOI), and Construction Cost per Square Foot - are essential for monitoring progress, managing costs, and making informed decisions. Here's a quick breakdown:
5 Essential KPIs for Real Estate Developer Dashboards
ROI is a key metric that shows how effectively each dollar invested turns into profit. It works alongside Return on Equity (ROE), which assesses how well investor capital generates net income. For high-risk, opportunistic projects, an ROE of at least 37% is often the goal, while more stable, core assets usually deliver an ROE of 10% to 15% [1]. Another critical measure is the Development Yield on Cost (DYOC), which compares the expected annual Net Operating Income (NOI) to the total project costs. For instance, if the market capitalization rate for stabilized properties is 5.5%, hitting a DYOC range of 11.5% to 13.5% - a spread of 6% to 8% - ensures adequate compensation for construction risks [1]. Developers need to aim for yields well above market cap rates to account for potential challenges.
ROI also helps monitor how well construction budgets align with the project's financial goals. Keeping the Total Project Cost Variance under 5% is crucial to maintaining the expected ROE. Even a small overrun of 5% can significantly reduce the Yield on Cost and cut into profits [1]. Regularly reviewing costs helps catch overruns early, allowing for timely adjustments. This proactive approach ensures the project remains on track financially.
To ensure profitability, it's essential to compare project yields with current market cap rates. Developers should evaluate DYOC on a quarterly basis during construction. If the spread between DYOC and market cap rates narrows, reviewing the Capital Absorption Rate can help manage spending and safeguard returns [1].
ROI data serves as a valuable tool for making informed decisions. For example, it can guide adjustments to unit mixes or help optimize price per square foot in specific areas before construction begins [1]. Merchant build projects often yield returns within 18 months after closing, while build-to-rent models may take over 36 months to break even. By tracking these models separately and conducting annual ROE reviews alongside Capital Absorption Rate performance, developers can maintain financial stability [1].
Keeping tabs on project costs is key to managing your budget effectively. The Budget Variance metric is a straightforward way to see how your actual spending stacks up against your original budget, with most projects staying within ±5% of their baseline [5]. Another critical measure is the Cost Performance Index (CPI), which shows how efficiently you're using your budget in relation to the work completed. It’s calculated by dividing Earned Value by Actual Cost. A CPI above 1.0 means you’re under budget, while anything below 0.9 is a red flag for cost overruns [5].
The Change Order Rate is another metric to watch. It measures the value of change orders as a percentage of the original contract. If this rate goes over 15%, it often points to issues like poor initial planning or unexpected site challenges. On the other hand, keeping it below 10% suggests your project estimates were solid from the start [5].
These metrics don’t just track costs - they help you act. For example, monitoring your Capital Absorption Rate can ensure you’re aligning monthly funding with project needs [1]. If your CPI sinks below 0.9, it’s time to dig into potential problems like inefficiencies in labor, rising material costs, or scope creep.
To stay ahead of cost issues, review project expenses weekly during construction [1]. If overruns threaten to derail profitability and can’t be offset by increasing the exit price, you might need to pause construction and reevaluate the project’s viability [1]. To protect against unforeseen expenses, always set aside a 10% contingency for hard construction costs [1]. Even a modest 5% cost increase can take a serious bite out of your Development Yield on Cost [1].
Revenue per square foot is a straightforward calculation: divide total revenue by the usable area. For example, if a mixed-use property generates $1,910,000 in revenue across 50,000 square feet, the result is about $38.20 per square foot [7].
This metric reveals how efficiently a property generates income from its available space. Smaller units, such as 150-square-foot spaces, often outperform larger ones in revenue per square foot due to their density and potential for additional fees [7]. Mixed-use operators frequently aim for returns exceeding 15 times the standard triple-net leasing yield by combining membership fees, transaction charges, and amenity-based revenue streams [7]. Like other key performance indicators (KPIs), this one helps refine pricing strategies and the tenant mix.
Comparing revenue per square foot to market averages provides a clear picture of how competitive your pricing strategy is. As Michael Green explains:
The most important KPI for the real estate industry is sales per square foot. This metric shows how much revenue a property generates per square foot of land, which is an important measure of the value of the property [10].
Market benchmarks can vary significantly depending on the sector and location. For instance, in Q2 2025, retail lease rates in the Greater Toronto Area dropped to $22.13 per square foot, down from $26.64 the previous year, while office lease rates rose to $20.84 per square foot, up from $17.55 [9]. Additionally, achieving a Gross Development Value at least 20% higher than your Total Project Cost is often seen as a key indicator of project feasibility [1].
Revenue per square foot isn't just a static number - it offers actionable insights that can drive better decisions. Using 12-month rolling averages and monthly reviews helps smooth out seasonal fluctuations and quickly identify pricing trends [7]. If your performance falls short compared to similar properties, consider adjusting your tenant mix. For example, replacing low-margin tenants with high-traffic anchors, such as full-service restaurants, can draw more visitors and boost the performance of neighboring units [8].
To ensure profitability, pair this metric with gross margin per unit to confirm that strong revenue isn't offset by high variable costs [7]. Allocating more space to higher-margin unit types can also increase revenue density and create opportunities for ancillary income from additional fees [7].
Net Operating Income (NOI) is a key metric for understanding how well a property generates cash after covering operating costs - excluding debt, taxes, or capital improvements. Essentially, it reveals whether your property can stand on its own as a profitable business. As Gemma Smith from Azibo explains:
NOI is the financial heartbeat of a rental property, and understanding it can help you determine whether a particular real estate investment will yield the return you seek [13].
To calculate NOI, subtract your operating expenses - like insurance, utilities, property management, and maintenance - from your total revenue. A positive NOI means your property is earning more than it costs to run, while a negative NOI points to potential problems that need immediate attention [13][15]. For rental-focused development projects, NOI also plays a critical role in determining Gross Development Value (GDV) using the formula: GDV = Stabilized NOI / Cap Rate [1].
By offering a clear picture of cash flow, NOI helps property owners and developers assess operational performance against market benchmarks.
Tracking NOI in real-time alongside other KPIs gives developers a fuller financial picture, helping them make informed decisions.
Comparing your NOI to market benchmarks can show if your project meets profitability expectations. In high-growth U.S. markets, institutional-grade assets often aim for a Development Yield on Cost (NOI divided by Total Project Cost) that's 6% to 8% higher than the prevailing market cap rate [1]. For example, if the market cap rate is 5.5%, your target yield should range from 11.5% to 13.5% to justify the risks of construction [1].
For individual properties, aim for an NOI ratio of at least 15% of the total investment cost. Business entities typically target 20% or higher [12]. Setting a profitability threshold before construction can help guard against shrinking margins. To stay on track, review your Development Yield on Cost quarterly - if the spread dips below 6%, it may be time to revisit your capital spending [1].
NOI is a critical factor in decision-making throughout a project’s lifecycle. Lenders use it to calculate the Debt Coverage Ratio, while investors rely on it as a key driver of value [11][14]. Reviewing a trailing 12-month (T-12) NOI can confirm past performance and validate future projections [11].
Monitoring your Operating Expense Ratio (Operating Expenses / Effective Gross Revenue) can highlight areas for cost efficiency and ensure your expenses align with local market norms [11]. When calculating NOI, always subtract vacancy losses and concessions from gross revenue to determine Effective Gross Revenue - this ensures you don’t overestimate the property’s value [11][15]. Forecasting NOI over a 3–10 year period allows you to account for inflation, wage changes, and potential competition [11][14].
Construction cost per square foot acts as a baseline for spending. By multiplying your planned building size by this figure, you can arrive at an initial cost estimate [16][18]. If the project starts to exceed your budget, this metric helps you make informed adjustments - whether that means reducing the building size, simplifying designs, or opting for more standard materials [16][17]. It’s not just about budgeting; this baseline also allows you to compare your project against similar ones in the market.
Why is this metric so important? Construction costs usually make up about 37% of total development costs, and labor alone can eat up as much as 40% of the construction budget [3]. Even a small 5% increase in total project costs can significantly hurt your Development Yield on Cost, potentially making the project unworkable [1]. To guard against unexpected cost increases, it’s wise to set aside a 10% contingency specifically for hard construction costs [1]. Regular weekly reviews of each construction phase can help you catch and address any cost variances early on [1].
Comparing your costs to regional averages and building-type standards is a great way to gauge if your project is on track. For example, the average construction cost for multifamily properties is about $350.00 per square foot, but this can vary widely depending on location and building height [3]. The Western United States has some of the highest costs, averaging $539.00 per square foot [3]. For context, single-story office buildings average $313.00 per square foot, mid-rise structures are around $562.00, and high-rise buildings can go up to $660.00 [3].
The construction cost per square foot serves as a foundation for project budgets and unit sale prices. - k38consulting [3]
Use historical data and regional benchmarks to set realistic baselines on your project dashboard [10][3]. If your costs exceed these benchmarks, it’s time to look closely at labor, materials, or permit expenses to identify areas for adjustment [10]. This metric also helps you compare contractor quotes and evaluate costs across different regions [16][17].
Focusing on actionable KPIs like this one gives developers a better grip on controlling costs. While the square foot metric offers a good starting point, it’s not always specific enough. Always request detailed quotes that break down labor, materials, and permits to avoid any surprises [17]. Keep in mind that square foot estimates often exclude fixed costs like permits, site preparation, landscaping, and utility upgrades [17][18]. Once construction begins, avoid making changes to the design - these can drastically increase your cost per square foot [17].
When approaching a remodeling project, start by clearly defining your key metrics - such as cost per square foot, timeline milestones, and overall ROI. - Khaled Dasher, Avenue Remodeling [10]
While lowering the cost per square foot might seem appealing, it can sometimes lead to compromises in quality. Strive to balance cost with workmanship [16][17]. If your spending exceeds the planned budget by 5% in the first quarter, review procurement costs and subcontractor agreements immediately [6]. To minimize risks from fluctuating material and labor costs, negotiate fixed-price contracts early in the process [6].
Each KPI serves a specific purpose depending on the project's phase. During the planning stage, metrics like Revenue per Square Foot and Construction Cost per Square Foot help gauge the project's feasibility [1][3]. Once construction is underway, Project Cost Variance becomes a critical tool for weekly tracking, ensuring budget overruns are identified before they cut into profit margins [1]. When the property stabilizes, Net Operating Income (NOI) takes priority, assessing operational efficiency and the ability to meet debt obligations [4]. Finally, at project completion, Return on Investment (ROI) offers a comprehensive view of how effectively investor capital was turned into profit [1][10].
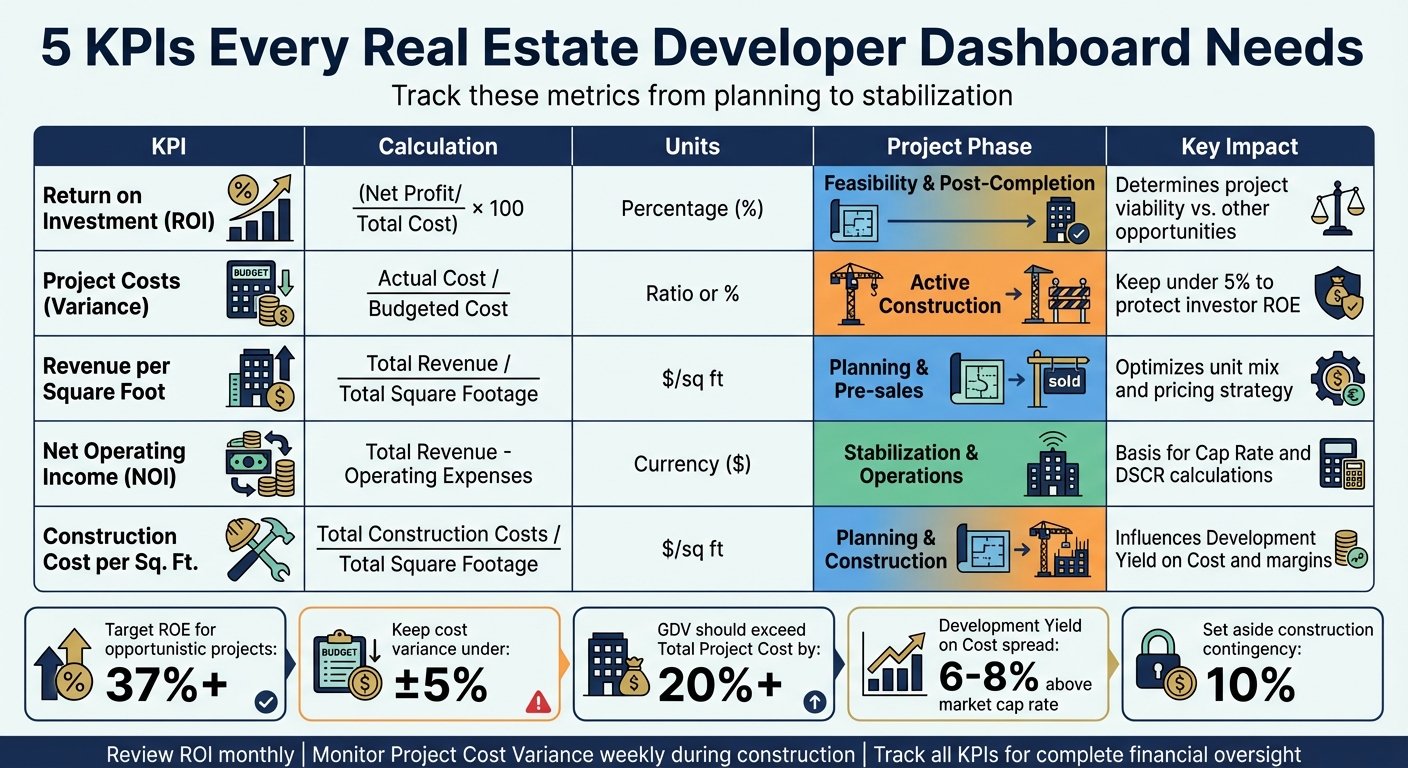
The table below summarizes these KPIs, breaking down their formulas, units, project phases, and their practical impact. This provides a quick reference guide to align metrics with the relevant project stages, forming a cohesive approach to financial oversight in real estate development.
| KPI Name | Calculation Method | Measurement Units | Project Phase | Purpose | Practical Impact |
|---|---|---|---|---|---|
| Return on Investment (ROI) | (Net Profit / Total Cost of Investment) x 100 [4] | Percentage (%) | Feasibility & Post-Completion | Evaluates overall project profitability [4] | Helps determine if the project is viable or competitive compared to other opportunities [4] |
| Project Costs (Variance) | Actual Cost / Budgeted Cost [1] | Ratio or Percentage (%) | Active Construction | Tracks budget control and identifies cost overruns [1] | Safeguards projected Return on Equity (ROE) for investors [1] |
| Revenue per Square Foot | Total Expected Revenue (GDV) / Total Square Footage [1] | Currency per Sq. Ft. ($/sq ft) | Planning & Pre-sales | Defines revenue potential and pricing strategy [1] | Guides unit mix adjustments to optimize pricing in targeted areas [1] |
| Net Operating Income (NOI) | Total Revenue – Operating Expenses [4] | Currency ($) | Stabilization & Operations | Measures operational efficiency of the property [4] | Forms the basis for Cap Rate and Debt Service Coverage Ratio (DSCR) calculations [4] |
| Construction Cost per Sq. Ft. | Total Construction Costs / Total Square Footage [1] | Currency per Sq. Ft. ($/sq ft) | Planning & Construction | Benchmarks construction efficiency against market standards [1] | Directly influences Development Yield on Cost and final profit margins [1] |
To maintain strong financial oversight, review KPIs like ROI on a monthly basis. However, operational metrics such as Project Cost Variance should be monitored weekly or bi-weekly during active construction to address potential delays or budget issues promptly [1]. Aim to keep cost variances as low as possible to protect project returns. For feasibility assessments, a good rule of thumb is ensuring the Gross Development Value exceeds the Total Project Cost by at least 20% [1]. For commercial projects, using price per square foot as the primary metric is essential for market comparisons and setting competitive pricing strategies [3].
From initial planning to final stabilization, each KPI plays a crucial role in helping developers navigate their projects. By tracking five key metrics - ROI, project costs, revenue per square foot, NOI, and construction cost per square foot - developers can transform raw numbers into actionable insights. Return on Investment (ROI) remains the go-to measure for evaluating profitability [10]. Meanwhile, revenue per square foot and construction cost per square foot work in tandem to ensure pricing strategies align with market conditions and construction efficiency. Net Operating Income (NOI) confirms whether the property generates enough cash flow to cover operating expenses and debt obligations [1]. Together, these metrics not only measure success but also enable informed, real-time decision-making.
"Data is a real competitive advantage in real estate. For developers facing tight margins and rising costs, tracking the right KPIs can be the difference between thriving and struggling." - Onyx Technologies [2]
These KPIs guide every phase of a project. During planning, developers assess feasibility by comparing Gross Development Value to Total Project Cost [1]. During construction, monitoring cost variance helps identify budget risks early [1]. At stabilization, NOI calculations reveal whether the property can meet operational and investor expectations [1].
Phoenix Strategy Group supports developers in implementing and maintaining robust KPI tracking systems through its FP&A services and data engineering expertise. Their financial models integrate real-time data across bookkeeping, forecasting, and KPI dashboards, reducing the need for manual data crunching. This allows developers to quickly identify potential challenges and make informed decisions. With services spanning cash flow forecasting to strategic advisory, Phoenix Strategy Group provides the tools developers need to safeguard margins, meet investor demands, and scale effectively. By adopting these integrated dashboards, developers can streamline project oversight from start to finish.
Automated dashboards that consolidate these five metrics enable developers to move from reactive problem-solving to proactive, strategic planning.
The frequency of KPI reviews depends on their type and your business objectives. For instance, operational KPIs like occupancy rates or rent collection are typically reviewed weekly. On the other hand, financial metrics such as ROI or project costs are often assessed on a monthly or quarterly basis. Align your review schedule with how critical the KPI is to decision-making and the speed at which your projects progress. This approach ensures you can track performance effectively and make timely adjustments when needed.
A good target spread between Yield on Cost and market cap rates usually falls between 150 and 250 basis points (1.5% to 2.5%). In some cases, industry norms may push this range slightly wider, reaching up to 150 to 300 basis points, depending on the specific asset class and the level of risk involved.
To tackle cost overruns, begin by analyzing key financial metrics like budget variance (%). This will help you identify where actual expenses are surpassing planned budgets. Once you’ve pinpointed the problem, adjust your project plan accordingly - this might involve reallocating resources or revising the project scope. Consistently monitoring these KPIs allows for proactive decision-making and helps keep costs under control.