Published on
February 26, 2026

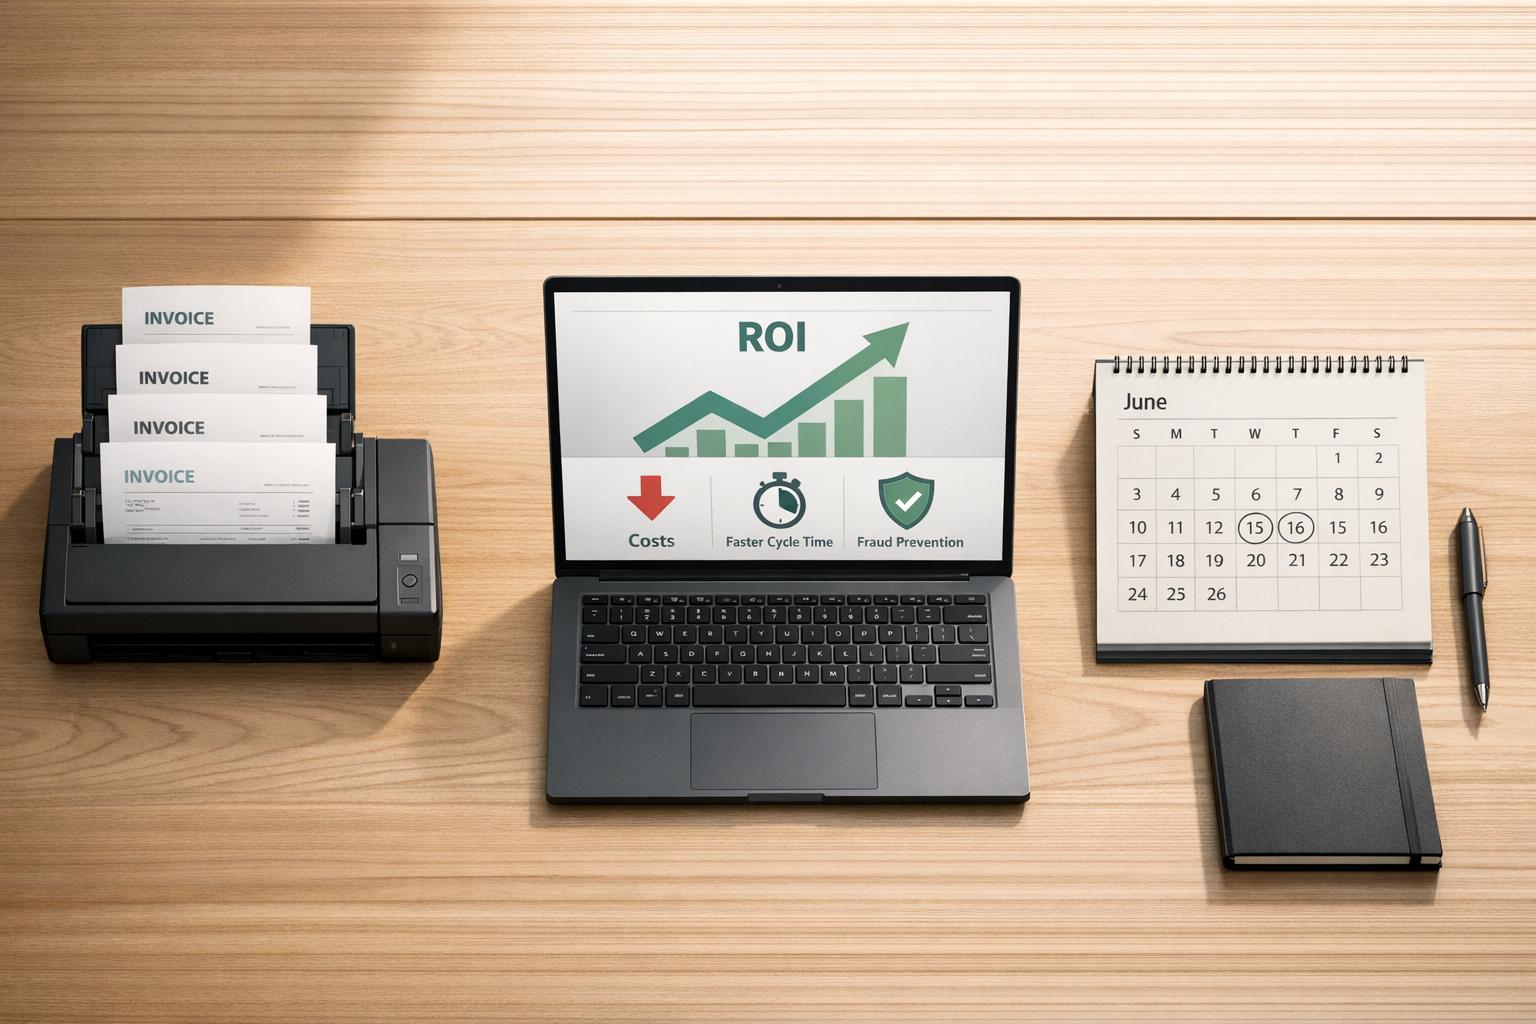
Switching to AP automation can save your company time, money, and resources while increasing efficiency. Here’s why it matters:
By investing in automation, fractional CFOs can reduce costs, streamline processes, and focus on strategic priorities like cash flow forecasting and supplier negotiations. With the AP automation market projected to grow 14% annually and reach $1.75 billion by 2026, it’s clear this is no longer optional for companies looking to stay competitive.
Let’s break down how to calculate ROI, the savings automation delivers, and what implementation costs to expect.
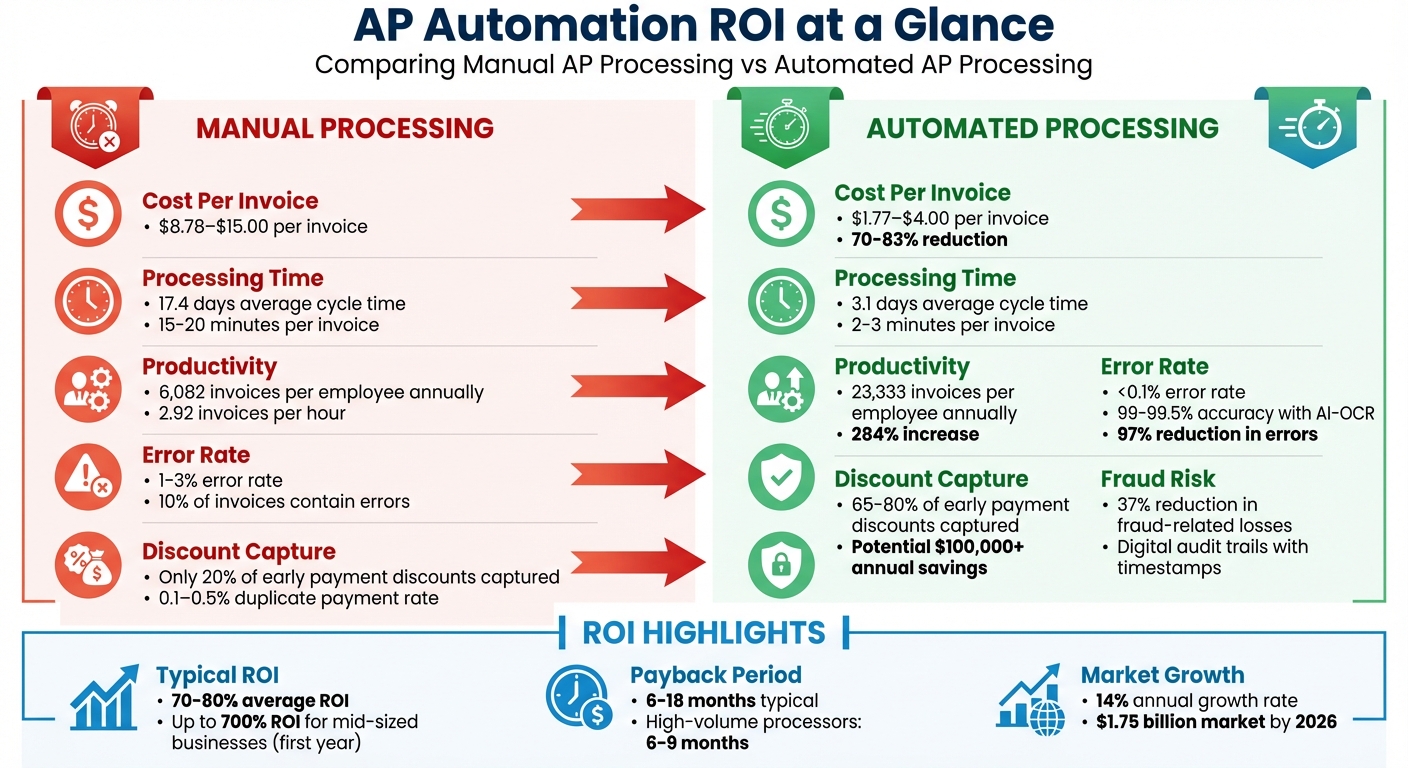
AP Automation ROI: Manual vs Automated Processing Costs and Benefits
Before diving into the ROI of AP automation, it’s crucial to understand how much your current manual process costs. This baseline serves as your comparison point for assessing potential savings and justifying the investment.
Start by determining the total cost of your AP staff (or fractional CFO services if outsourced), including salaries, benefits, taxes, and overhead. To calculate an hourly rate, divide an employee’s annual compensation by 2,080 hours. Next, figure out how many invoices your team processes per hour. On average, manual teams handle about 2.92 invoices per hour [10], which translates to processing costs of $7.75 to $15.00 per invoice [10][1].
Don’t forget to account for hard costs such as paper, ink, envelopes, check stock, postage, and file storage. For storage, you can estimate costs by multiplying the number of filing cabinets (each averaging 6 sq ft) by your office rent per square foot [10]. These expenses quickly add up when processing thousands of invoices.
Additionally, include the time spent by senior staff on invoice approvals. For example, a department head earning $150,000 annually who spends 30 minutes on each approval incurs a cost of roughly $36 per approval, based on their hourly rate. These hours from higher-paid employees significantly increase your overall processing costs [10].
Manual data entry is prone to errors, with mistakes occurring in about 10% of invoices and typically ranging from 1% to 3% [3][8][9][1]. Correcting each error takes approximately 20 minutes. For a company processing 10,000 invoices annually, these errors can consume hundreds of labor hours.
Missed early payment discounts also add hidden costs. Many suppliers offer discounts of 1–2% of the invoice value for early payments, but companies using manual processes often capture these discounts from fewer than 20% of suppliers [15]. For a $1 million annual spend, this could mean forfeiting $10,000 to $20,000 in savings. Late payment penalties only make matters worse.
Fraud is another concern. In 2024, 79% of U.S. organizations were targeted by payment fraud [8]. Manual systems are less effective at identifying fraudulent invoices, duplicate payments (which occur in 0.1–0.5% of manual systems [14]), or schemes like Business Email Compromise that can redirect legitimate payments.
Industry benchmarks from the American Productivity and Quality Center (APQC) provide a helpful reference for assessing AP performance [11][12]. According to APQC, the median cost to process a single invoice is $6.00, but manual processing typically ranges between $9.40 and $15.00 [12][7]. For every $1 billion in revenue, companies spend a median of $567,009 on their AP processes [13].
Use these benchmarks to determine where your costs fall. To calculate your cost per invoice, total all annual AP expenses (labor, materials, storage, and fees) and divide by your invoice volume. Also, measure your invoices per full-time equivalent (FTE). Manual teams average 6,082 invoices annually, while automated teams handle around 23,333 [10]. Finally, assess your cycle time - manual processes typically take 9 to 17 days, compared to under 24 hours with automation [7].
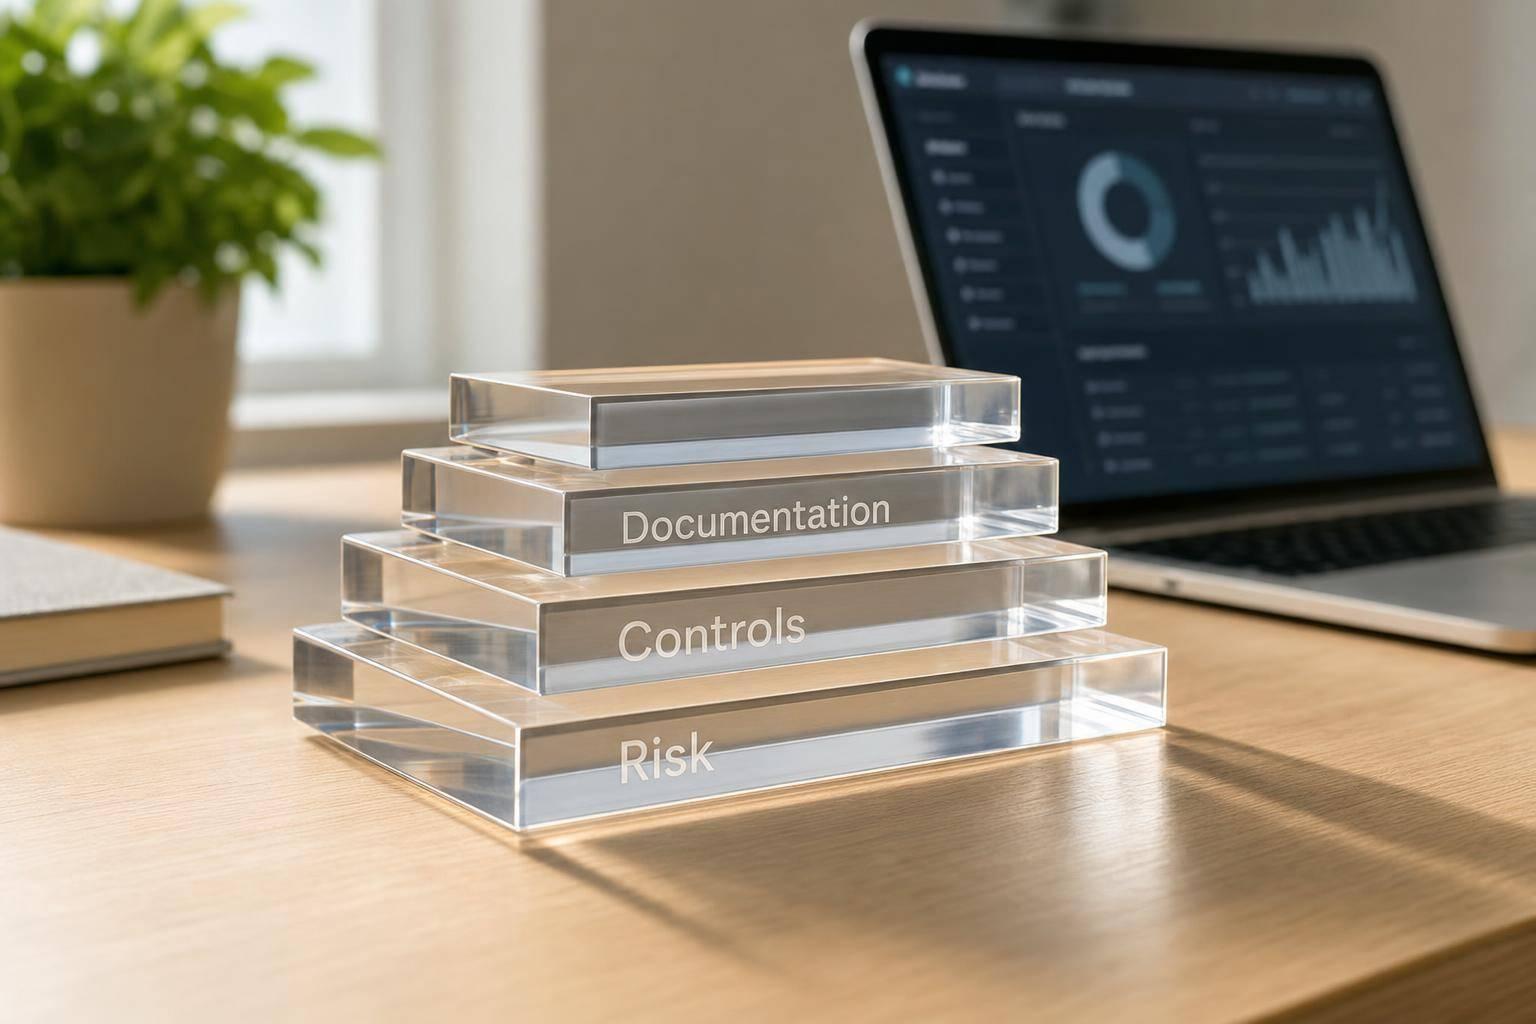
APQC divides AP costs into five categories: Personnel, Systems, Overhead, Other (supplies and travel), and External/Outsourced expenses [12][13]. Including all these areas in your baseline will help uncover inefficiencies and provide a solid foundation for calculating the ROI of automating your AP processes. This detailed approach ensures you’re fully prepared to measure the potential benefits of automation.
Once you’ve determined your baseline costs, it becomes easier to pinpoint where automation delivers the biggest financial benefits. These savings generally fall into three areas: labor efficiency, error prevention, and discount capture. Let’s break down how automation makes a measurable impact in each of these categories.
AP automation slashes the cost per invoice from $9.40–$40.00 down to $1.77–$5.00 - a reduction of about 70–83%. By eliminating manual tasks like data entry and physical document routing, businesses can dramatically lower operational expenses. Processing time per invoice also shrinks from 15–20 minutes to just 2–3 minutes, with overall invoice cycle times dropping from 9–17 days to as little as 1–3 days [1][17].
For companies in growth mode, this efficiency boost means they can handle larger invoice volumes without hiring more staff. Automated teams can process roughly 23,333 invoices per year per full-time employee, compared to just 6,082 for manual teams - a productivity increase of 284% [1]. For instance, NEW Health, a non-profit, reallocated one AP employee to another department, saving between $35,000 and $42,000 annually. As CFO Adam Jones shared:
"Having MineralTree has allowed me to re-allocate one of my AP employees to a new department. This has resulted in cost savings of about $35–$42k" [18].
Automation also frees up as much as 40% of staff time previously spent on manual data entry. This allows teams to shift their focus to high-value tasks like cash flow management and vendor negotiations. Take The Icehouse as an example - they cut processing time by 80%, saving over 40 hours a week and achieving annual savings of approximately $37,767 [6].
Manual data entry is prone to mistakes, with error rates ranging from 1–3%. Roughly 10% of invoices contain errors such as duplicate entries or incorrect totals, and fixing each mistake can take around 20 minutes [1][3]. These errors add up, making automation’s accuracy a critical financial advantage. Automated systems reduce error rates to below 0.1%, with AI-powered OCR tools achieving data extraction accuracies of 99–99.5% [19]. Many organizations report a 97% reduction in invoice errors after switching to automation [3].
Automation also addresses overpayments and duplicate payments, which impact 0.8–2% of manual invoices [1]. With 79% of U.S. businesses targeted by payment fraud in 2024, AI-driven fraud detection in AP automation can reduce fraud-related losses by about 37% [1]. These systems flag issues like Business Email Compromise, invoice tampering, and unauthorized payments - problems that manual processes often overlook. Plus, digital audit trails with timestamps and user IDs simplify compliance checks and auditing, saving additional time [16].
Manual processing often leads to delays, with invoices sitting in approval queues for 9–17 days [2]. This slows down the ability to take advantage of early payment discounts, which can deliver returns comparable to a 36% annual interest rate [1]. Capturing these discounts is a direct way to improve ROI.
Although 80% of suppliers offer early payment discounts, only 46% of businesses manage to capture 1–5% of these opportunities. AP automation can raise discount capture rates from an average of 20% to as high as 65–80%, potentially saving over $100,000 annually for organizations processing 20,000 invoices [1]. For example, Haviland Enterprises saved $44,000 in rebates during their first year of automation while also cutting 52 AP labor hours each month. As one VP of Finance at a global manufacturing firm noted:
"The ROI was immediate. We're capturing more early payment discounts than ever before" [17].
Once you've identified potential savings, the next step is to calculate the financial impact through a detailed ROI analysis. Let’s break it down.
To measure ROI, use this formula:
ROI (%) = [(Total Annual Savings - Total Investment Costs) / Total Investment Costs] × 100 [20][3][21].
Total Annual Savings includes factors like reduced labor costs (from eliminating manual tasks like data entry and approval routing), lower invoice processing costs, fewer errors (e.g., avoiding duplicate payments, overpayments, and late fees), and early payment discounts. You can also factor in less tangible benefits, such as smoother audits and stronger vendor relationships.
Total Investment Costs cover expenses like software fees (monthly subscriptions or licenses), implementation costs (setup, ERP integration, and data migration), employee training, and ongoing maintenance (e.g., technical support and updates).
Let’s look at an example. A company processes 1,200 invoices monthly, with a manual cost of $12.00 per invoice. This results in an annual processing cost of $172,800. After automation, the cost per invoice drops to $5.00, reducing the annual processing expense to $72,000. The company also secures $40,000 in early payment discounts and avoids $8,000 in late fees, bringing total annual savings to $148,800.
If the total initial investment is $60,000 (including $36,000 in software fees, $15,000 for implementation, and $9,000 for integration and training), the ROI calculation looks like this:
[(148,800 – 60,000) / 60,000] × 100 = 148%. The payback period is just under five months (approximately 4.8 months).
For a real-world example, The Icehouse processes 400 invoices monthly with three finance staff. After adopting ApprovalMax in June 2025, they cut processing time by 80%, saved over 40 hours weekly, and achieved around $37,767 in annual savings [6].
Global Tech Inc., a fast-growing SaaS company with 500 employees, used to handle 1,200 invoices monthly before adopting AP automation. After implementing the system, they achieved a 70% touch-free processing rate, which translated into saving 2,400 labor hours and cutting labor costs by $108,000. On top of that, they gained $40,000 in early payment discounts and avoided $9,000 in fees and duplicate payments.
Their first-year investment amounted to $60,000, consisting of $40,000 in licensing fees and $20,000 in setup costs. With total annual savings of $157,000, the company achieved an impressive 195% ROI in the first year [22].
Global Tech Inc.'s success aligns with broader industry patterns. On average, organizations see an ROI between 70% and 80% from AP automation [23]. For mid-sized businesses, the returns can be even more striking, with some reporting up to 700% ROI within the first year [7][3]. Payback periods typically range from 6 to 18 months, depending on factors like invoice volume and pre-automation processing costs [23][24][3].
Several factors contribute to these impressive results. Industry data shows that processing costs often drop by 70–80%, while error rates shrink from 1–3% to less than 0.1% [6][17][3][23]. Best-in-class systems can handle approximately 23,333 invoices per FTE, representing a 284% boost in productivity [23]. Additionally, companies utilizing these systems capture early payment discounts at much higher rates - rising from 20% to 65–80% [17].
These benchmarks provide CFOs with a clear framework to justify AP automation investments and project realistic payback timelines.
Having a clear understanding of costs upfront helps prevent unexpected budget issues and strengthens your case for automation. On average, the initial investment for accounts payable (AP) automation in the first year ranges from $26,000 to $90,000+, depending on your organization's size and complexity [21].
Here’s a breakdown of the major expenses:
Other costs to factor in include staff training ($1,000 to $5,000) and change management services ($5,000 to $15,000) [21]. Internal resource costs during the 4–8 week implementation phase should also be included [6]. Additionally, some organizations may need to budget for cloud storage fees for digital audit trails or purchase scanners to manage any remaining paper invoices [5].
"The trick for many organizations wishing to transition from manual AP to fully automated is in justifying the expense with hard numbers."
– Rebeca Bichachi, NetSuite [2]
When these initial expenses are viewed alongside the operational savings discussed earlier, they provide a clear picture of the return on investment (ROI) that AP automation offers.
Once you’ve outlined the costs, the next step is to calculate how quickly the investment will start paying off.
The formula is simple: Implementation Cost / Monthly Net Savings [21]. For businesses processing high volumes of invoices (10,000+ monthly), the payback period generally falls within 6 to 9 months [21]. Mid-sized organizations typically see a break-even point in 6 to 8 months, while smaller businesses handling 500–1,000 invoices may take longer, around 18 to 24 months [3][21].
It’s important to use realistic savings projections rather than assuming full benefits from day one. A gradual adoption curve - starting with around 40% savings in the first month, 65% in the second, and reaching full efficiency by the third month - is a more accurate approach [25]. Focus on tangible, measurable savings that finance teams can validate, like reduced headcount, lower overtime costs, or fewer contractor expenses, instead of abstract benefits like "freed capacity" [25]. Each saving should be tied to a specific cost reduction and its monthly financial impact [25].
For high-volume organizations, aim for a payback period of less than 12 months [21]. Remember, automation significantly reduces per-invoice processing costs - from $12–$15 down to $3–$5 - and capturing early payment discounts of 1–2% can often offset the entire software cost. These cost savings directly contribute to a faster payback period [3][21].
Calculating the payback period accurately is vital to demonstrating the ROI of AP automation to stakeholders.
Tracking the right metrics is crucial to ensure the long-term success of your automation efforts. One of the most telling indicators is the touchless processing rate - the percentage of invoices processed from receipt to payment without any manual intervention. Top-performing organizations currently achieve a 52.8% touchless rate, with the best aiming for 70–80% [1].
Another critical metric is the cost per invoice, which can plummet from $12.88 (manual processing) to $2.78 in highly automated setups - saving over $10 per invoice [28]. Keep a close eye on your exception rate, as invoices requiring manual intervention can cost three to five times more to process. While manual systems often see exception rates of 20–30%, leading organizations keep this figure under 10% [26][29].
You’ll also want to monitor the first-pass match rate, which measures how often invoices match purchase orders on the first attempt. A rate of 95% or higher is the gold standard [26]. Lastly, ensure your duplicate payment rate stays below 0.5% [26].
Automation doesn’t just cut costs - it significantly boosts productivity. With automation, a single full-time employee (FTE) can handle 2,000–5,000 invoices per month, compared to just 800–1,000 with manual processes. That’s an annual productivity increase of 284% [1]. These KPIs not only measure efficiency but also reveal the broader impact of automation on your accounts payable (AP) processes.
Real-time dashboards are game-changers for tracking key metrics like cycle times, exception rates, and throughput. They give CFOs and finance teams instant visibility into bottlenecks, whether caused by specific employees or suppliers, enabling immediate action to maintain smooth workflows [4][27]. For instance, you can quickly notify approvers or tweak workflows to keep invoice cycle times on track [28].
Take Haviland Enterprises as an example. By leveraging real-time monitoring, they slashed their weekly check run time from over 4 hours to under 20 minutes. This saved 52 AP hours every month and earned them $44,000 in rebates in just their first year [1][8]. This transformation highlights how AP departments can evolve from cost centers into revenue-generating units.
Dashboards also help track Approval SLA Compliance, pinpointing departments or managers that may be slowing down the payment cycle [16][27]. They can monitor the percentage of invoices received digitally, encouraging suppliers to eliminate paper-based processes and reduce exceptions [27][28]. Beyond counting exceptions, dashboards can categorize the root causes - whether it’s missing purchase orders, pricing discrepancies, or supplier errors - so you can address recurring issues at their source.
For organizations using virtual card payments or Premium ACH, dashboards offer real-time tracking of captured rebates. Seamless integration with ERP systems via APIs ensures accurate, up-to-date metrics without manual data entry [5][8]. With 58% of CFOs now investing in AI for real-time forecasting [1], these tools are also essential for managing working capital and producing accurate 13-week cash flow forecasts [1][8]. Plus, the digital audit trail created by these dashboards can cut audit preparation time from weeks to just hours [7], adding another layer of efficiency and value to your AP processes.
AP automation has the power to shift your finance team from a reactive support role to a key driver of EBITDA growth and operational efficiency [8][16]. The numbers speak for themselves: some mid-sized businesses report up to 700% ROI within the first year [3], and most companies break even in just 6 to 18 months [1][3]. It’s one of the fastest-returning technology investments available to CFOs today.
But the advantages go far beyond cutting costs. By lowering invoice processing expenses, you free up resources for more strategic projects. Your team can process 284% more invoices without the need for additional staff [1], take advantage of 30–35% more early payment discounts [1][8], and cut fraud-related losses by 37% [1][8]. As one CFO from Granger Construction aptly put it:
"You really don't have to sell anyone on it. It pays for itself" [8].
For businesses in growth mode, scalability is another major win. Automation enables you to handle increasing invoice volumes without scaling your workforce at the same rate - delivering the kind of operating leverage that appeals to investors [30][16]. With 58% of CFOs now investing in AI for real-time forecasting [1] and the AP automation market expanding at a 14% CAGR through 2026 [1], early adopters are setting themselves up for long-term success.
To get started, focus on automating high-volume, low-variance invoices, ensure seamless ERP integration, and monitor critical KPIs from day one. Whether you’re managing 500 invoices a month or 50,000, the case for automation is clear - and the longer you wait, the greater the opportunity cost.
Take the next step in transforming your finance function. Phoenix Strategy Group offers tailored advisory services to help you unlock the full potential of AP automation and drive strategic value for your business.
AP automation starts to make financial sense when a business handles around 50 to 100 invoices per month. At this level, companies can cut down on manual processing expenses and see a return on investment (ROI) that often falls between 70% and 80%. This shift not only trims costs but also boosts efficiency and overall financial outcomes.
When calculating ROI for intricate ERP systems and approval workflows, it's essential to consider both measurable and less obvious benefits. These include time savings, fewer errors, and smoother processes. Begin by examining your current expenses tied to manual tasks and delays. This sets a baseline to understand where inefficiencies lie.
Next, apply customized ROI models to quantify the gains, like shorter processing times and lower error rates. Once you have these figures, use the formula:
ROI (%) = [(total benefits - total costs) / total costs] x 100
This approach ensures a clear and precise calculation of the ROI, giving you a solid foundation for decision-making.
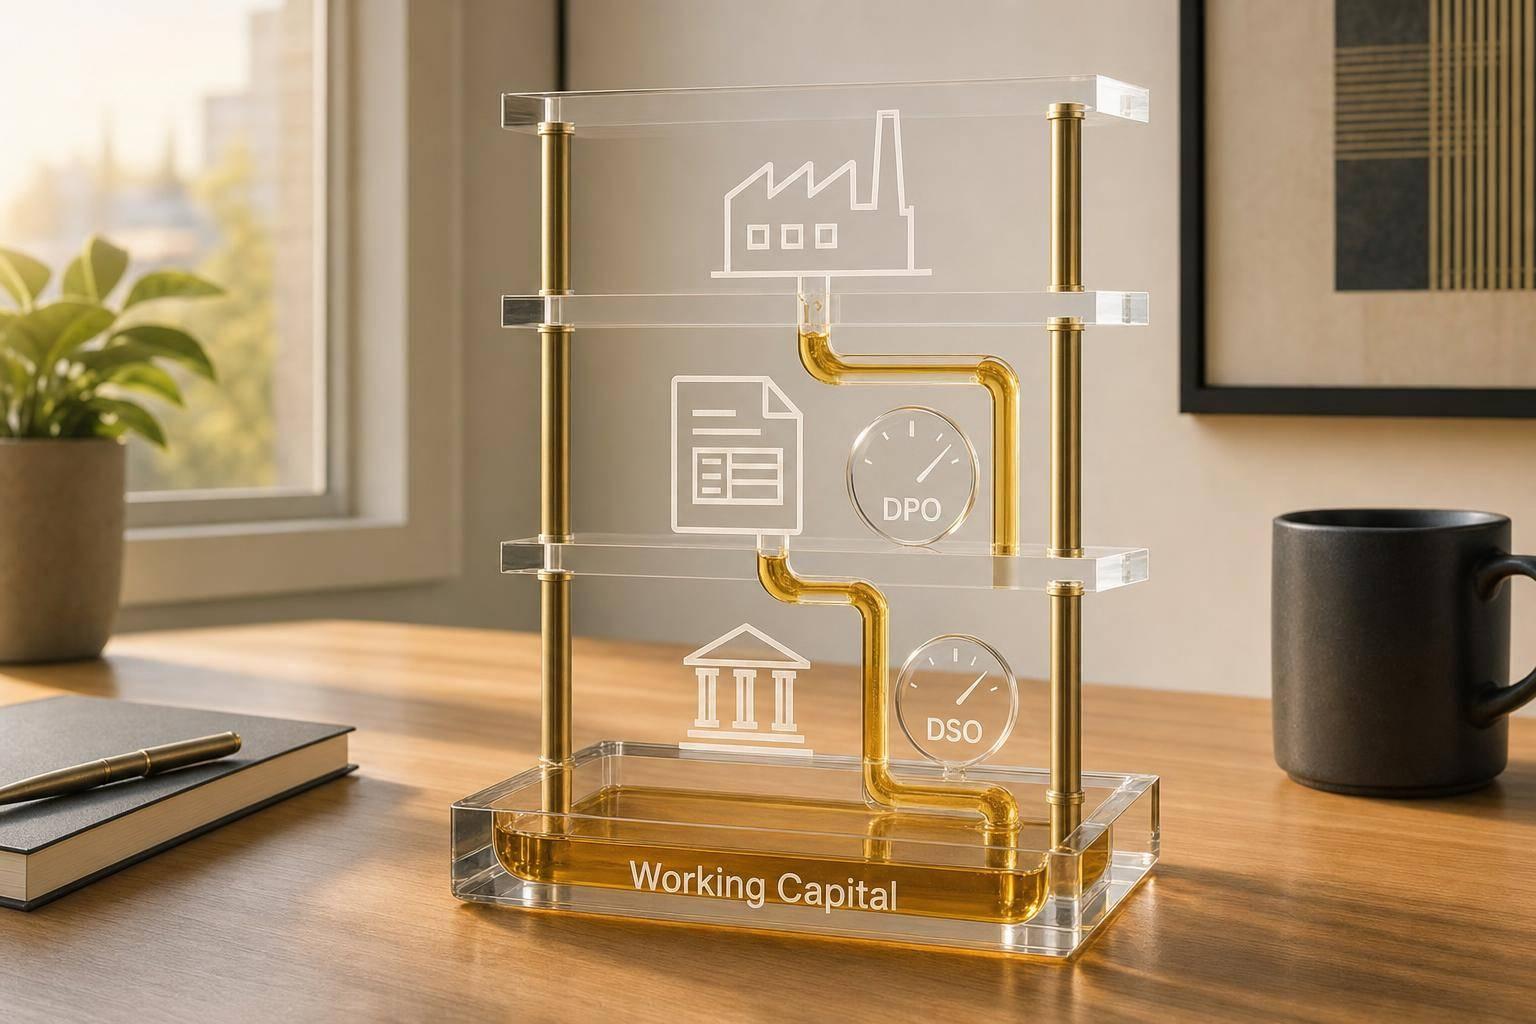
Track key performance indicators (KPIs) such as Days Payable Outstanding (DPO), the cost per invoice processed, the percentage of early payment discounts captured, fraud prevention rates, and overall cost savings. These metrics provide a clear picture of the financial benefits of automation and help confirm your return on investment (ROI) after implementation.