Published on
January 12, 2026

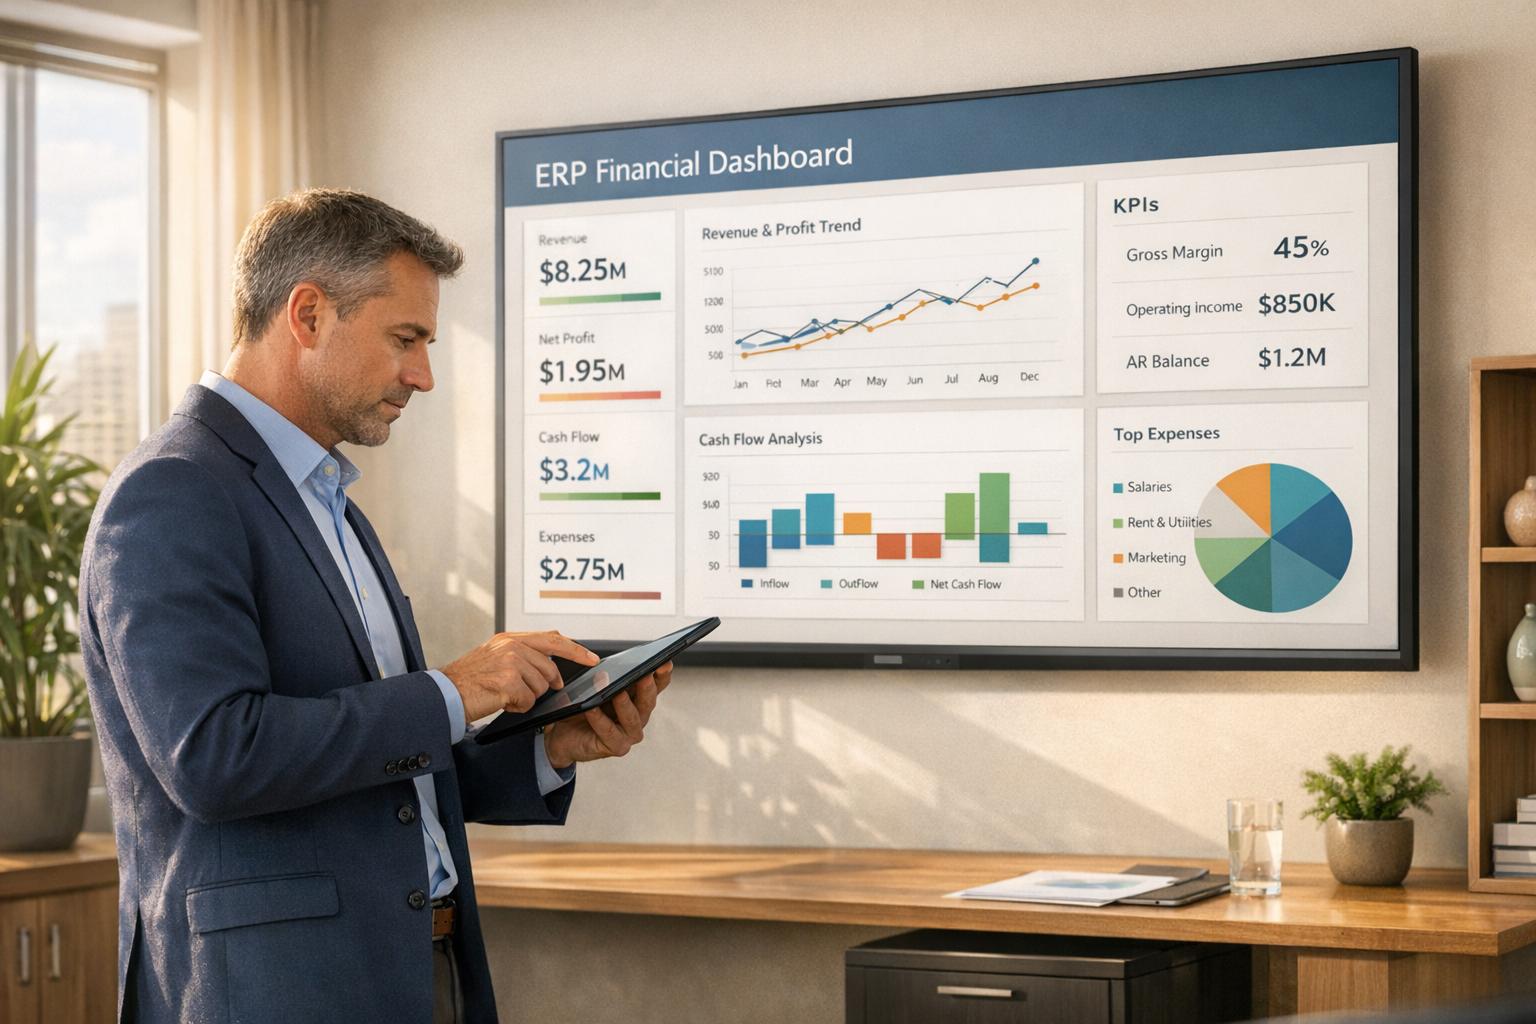
ERP dashboards are a game-changer for CFOs. They eliminate manual processes, reduce reliance on spreadsheets, and give finance teams real-time visibility into critical metrics like cash flow, profitability, and compliance. This guide explores how CFOs can use ERP dashboards to streamline operations and make faster, data-driven decisions.
By following these steps, CFOs can transform financial operations, improve decision-making, and prepare their organizations for growth.
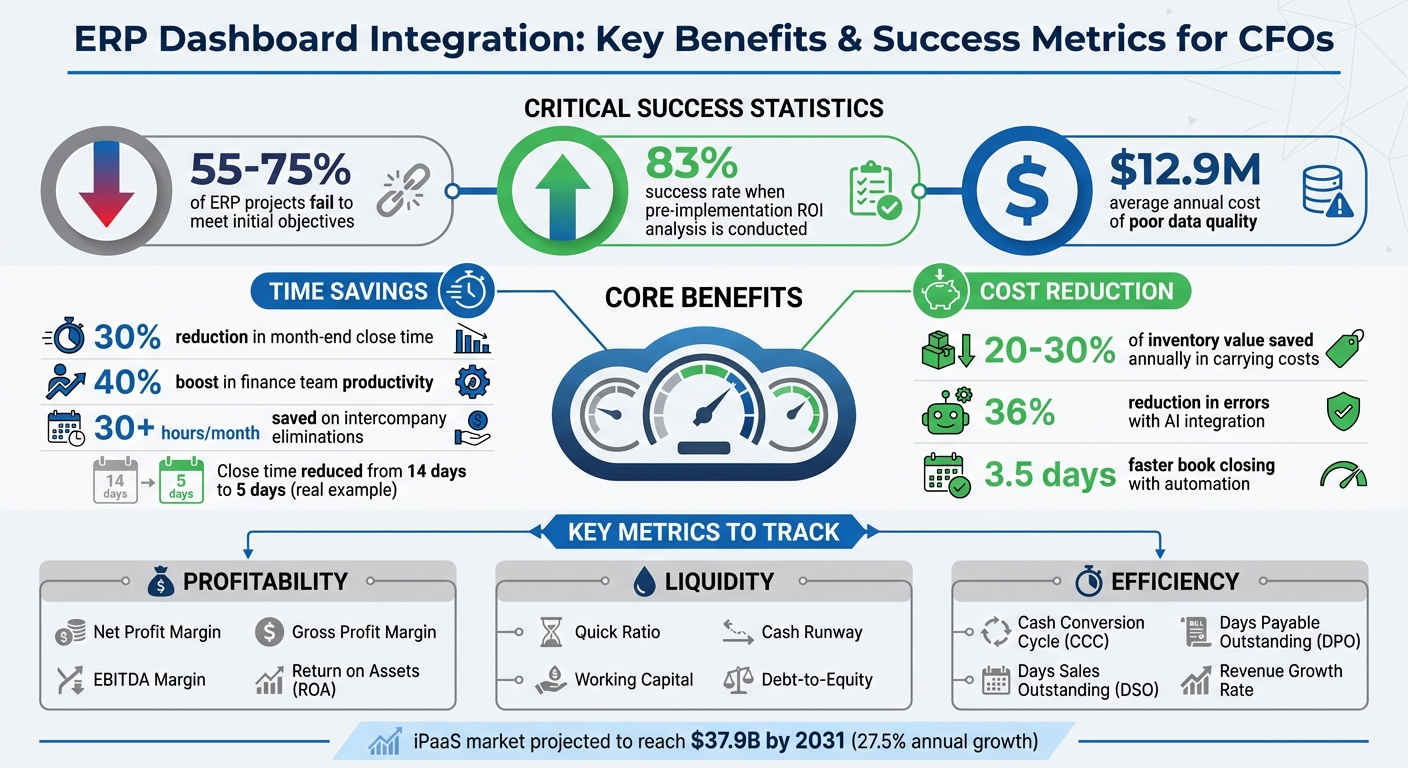
ERP Dashboard Integration: Key Benefits and Success Metrics for CFOs
CFOs need a well-defined plan before diving into ERP dashboard integration. Between 55% and 75% of ERP projects fail to meet their initial objectives, often because teams skip the critical planning phases [5]. The key to success lies in clearly defining goals, evaluating existing systems, and ensuring all stakeholders are aligned before any technical work begins.
As Deloitte puts it, "The finance vision becomes the 'North Star' for the ERP-enabled finance transformation" [6].
This isn’t just another IT task - it’s a strategic financial management initiative. Effective planning at this stage lays the groundwork for a smooth implementation and sets the stage for achieving long-term results.
Clear, measurable goals are essential for a successful project. Vague objectives like "better analytics" or "improved business partnering" may sound appealing, but they’re hard to measure [8]. Instead, CFOs should focus on specific, quantifiable targets tied directly to business outcomes.
Start by identifying pain points. For example:
Organizations that adopt integrated ERP systems often cut their month-end close time by 30% and boost finance team productivity by up to 40% [9]. These results are achievable with the right focus.
Prioritize areas with the biggest impact. Processes like financial close, consolidation, accounts payable, and intercompany eliminations often deliver the highest ROI because they target time-intensive manual workflows [7].
Your goals should also address broader strategic needs. For instance:
If your organization is scaling, raising capital, or preparing for an exit, your dashboard must support multidimensional analysis that goes beyond basic P&L reporting [9][5]. These capabilities not only streamline operations but also empower CFOs to drive strategic decisions.
Compliance and risk management are equally important. If you’re subject to SOX, IFRS, or ASC 606, your integration goals should include strengthening internal controls, improving audit trails, and enhancing data security [1][9]. Poor data quality, which costs organizations an average of $12.9 million annually, can lead to cascading reporting errors that finance departments often bear the brunt of [9].
Before moving forward, take stock of your existing systems. Conduct a thorough assessment to understand your current processes and identify bottlenecks. For example, document your month-end close process with timestamped activities and measure the hours spent on manual reconciliations [7]. Which workflows still rely heavily on spreadsheets?
Create a detailed inventory of all financial systems in use - ERP, CRM, payroll, procurement, inventory management - and map out how they currently connect [7]. Legacy systems without structured APIs or standardized data formats may require middleware, custom connectors, or iPaaS solutions to ensure proper integration [9][10]. Knowing these limitations ahead of time can help you avoid costly surprises later.
Data quality is critical. If your data is plagued by errors, inconsistencies, or duplicates, these issues will only grow in an integrated system. Start with a "financial health check" to establish a baseline [7]. Measure your average close time and variance over the past year, and gather feedback from your accounting team about specific pain points.
Pay special attention to data silos. Identify where data is trapped and where integration could provide the most value. For instance:
This comprehensive review ensures your integration efforts address the most critical gaps in financial visibility.
Once you’ve defined your goals and assessed your systems, it’s time to bring key teams on board. Treating this as a solo project is a recipe for failure. Cross-departmental collaboration is essential to ensure the system supports workflows across the entire organization [1][6].
As Priority Software explains, "ERP selection and implementation are not discrete IT projects but cross-functional financial governance initiatives, where the CFO is accountable for aligning architectural integrity with reporting fidelity" [9].
Engage all stakeholder groups early in the process. For example:
Each team offers unique insights that can shape your requirements and prevent gaps in the final system.
Frame the project in terms of business outcomes rather than technical features. For example:
Include "quick wins" in your roadmap - small, easily achievable milestones that build momentum and demonstrate value to hesitant stakeholders [6].
| Stakeholder Group | Role | Engagement Strategy |
|---|---|---|
| IT Team | System architecture, security, integration points | Consult on maintenance and data residency early [7] |
| FP&A Leaders | Forecasting and budget development needs | Interview about current modeling challenges [7] |
| Accounting Team | Close process mapping, reconciliation steps | Survey for manual pain points and spreadsheet dependencies [7] |
| Operations/Supply Chain | Real-time cost tracking, variance analysis | Align dashboard metrics with production workflows [7] |
| Executive Leadership | Strategic goals and ROI expectations | Document specific reporting gaps and decision-support needs [7] |
Active participation from all stakeholders is critical. When teams see how the integration solves their specific challenges, they’re more likely to support the project, creating a strong foundation for successful financial transformation.
Once you've established your integration plan, the next step is selecting the right KPIs. Choosing the right financial metrics gives CFOs the clarity they need to navigate shifting markets. These KPIs are your go-to tools for real-time insights that guide strategic decisions.
Your dashboard should be the first thing you check every morning. Whether it's spotting a cash flow problem, identifying compliance risks, or flagging operational inefficiencies, your dashboard can help you act swiftly. With so many metrics to choose from, focus on those that align closely with your goals and provide the most actionable insights.
Profitability and liquidity metrics are essential for assessing whether your business is both profitable in the long run and capable of meeting short-term obligations. These metrics are especially important for CFOs managing growth-stage companies.
On the liquidity side:
| Metric | What It Measures | Why It Matters |
|---|---|---|
| Net Profit Margin | (Net Income / Revenue) x 100 | Shows profitability after all expenses [11] |
| Quick Ratio | (Cash + Marketable Securities + AR) / Current Liabilities | Evaluates ability to meet short-term obligations [11] |
| Cash Runway | Months of operation at current burn rate | Helps plan funding and spending strategies [11] |
| Debt-to-Equity | Total Liabilities / Total Shareholder Equity | Indicates financial leverage and risk [11] |
Next, let’s focus on operational efficiency and revenue growth metrics.
Operational and revenue-focused KPIs help measure how effectively your business uses its resources to generate income.
Modern ERP dashboards allow you to dig deeper into these metrics, providing context for any anomalies. For example, you can drill down from high-level growth trends to specific transactions for immediate clarity [3].
As CBIZ explains, "Before you open your email, grab your cup of coffee and settle down in front of your operational dashboard to find out what is really going on in your company" [3].
Finally, don’t overlook compliance and risk management metrics, especially as your company scales.
As businesses grow, they face stricter regulatory requirements. Compliance and risk management metrics are crucial for staying ahead of these challenges. ERP dashboards offer real-time visibility into areas like regulatory compliance, audit readiness, and internal controls [12][13][14].
Key metrics include:
Dashboards can be set up with automated alerts to notify you when these metrics exceed critical thresholds [14].
Sneha Bhardwaj from Versa Cloud ERP emphasizes, "Real-time metrics are critical vehicle for providing compliance and are used to remain compliant in financial and legal matters, as well as industry regulations. Ineffective systems increase the risk for non-compliance and audit failure" [14].
Data accuracy is another major concern. In a 2023 survey, 46% of respondents admitted they didn’t know where to find their company’s data reports, and 41% reported a lack of trust in their organization’s data [13]. ERP dashboards address this by serving as a single source of truth, reducing errors caused by syncing data from multiple systems [13].
Lisa Schwarz, Senior Director of Global Product Marketing at NetSuite, notes, "Dashboards make it easier to track audit trails, tax reporting, or regulatory thresholds. Fast access to accurate data ensures that compliance won't become a scramble" [13].
Role-based access controls further enhance security by ensuring sensitive financial data is only accessible to authorized personnel. This strikes a balance between transparency and risk reduction [13].
For companies preparing for fundraising, mergers, or acquisitions, strong compliance metrics demonstrate operational readiness and simplify due diligence. Your dashboard should continuously monitor key indicators like tax reporting, audit readiness, and regulatory adherence to keep your financial operations running smoothly.
Once you’ve identified your key metrics, the next step is creating a clear plan to link your ERP system with financial dashboards. While the technical aspects might feel daunting, breaking everything into smaller, manageable phases can make the process much smoother. The goal? Seamlessly transition from planning to a fully operational dashboard without disrupting daily business activities. Here's how to make it happen.
Start by auditing your current systems and mapping out key data flows. This step often uncovers hidden tools or "shadow IT" - like spreadsheets and unofficial software - that finance teams rely on outside of approved systems [15][17]. Identifying these gaps helps you prioritize integrations that will yield the quickest results.
Choose the right architecture for your needs: For simpler setups, point-to-point connections may suffice. But as your operations grow, they can become unmanageable. Middleware is a great option for bridging older systems with modern dashboards, especially in environments with legacy infrastructure. For companies looking for scalable, cloud-native solutions, iPaaS (Integration Platform as a Service) stands out with its low-code, pre-built connectors. It's particularly useful for growing businesses that want to avoid heavy IT costs. In fact, the global iPaaS market is expected to hit $37.9 billion by 2031, with an annual growth rate of 27.5% [16][18].
Before diving into the technical work, establish a Master Data Management (MDM) protocol. This ensures your data is clean, standardized, and accurate for real-time updates. Define which system owns specific data - like customers in your CRM, vendors in accounts payable, or products in inventory management. Without clear ownership, you risk conflicting reports and endless reconciliation issues [15][4]. Poor-quality data - such as duplicates, outdated records, or missing fields - can undermine the credibility of your dashboard [15][16].
A phased rollout minimizes disruptions and allows for continuous evaluation. Instead of tackling everything at once, follow a structured sequence:
Reo stated, "An ERP system integration is not once and done. It is an apparatus of continuous improvement." [16]
To keep your dashboard running smoothly as your business evolves, plan for regular maintenance cycles and version updates.
| Integration Method | Best For | Key Advantage | Primary Challenge |
|---|---|---|---|
| Point-to-Point | Small-scale, 1–2 apps | Quick setup | High maintenance; poor scalability [16][18] |
| Middleware | Complex/legacy systems | Bridges old and new tech | Expensive; requires IT expertise [16][18] |
| iPaaS | Cloud-first setups | Low-code; easily scalable | Subscription costs; cloud reliance [16][18] |
| Hub-and-Spoke | Multi-app ecosystems | Centralized mapping | Moderate setup complexity [18] |
With a solid strategy in place, the next step is tackling common technical challenges:
Your dashboard's reliability hinges on the quality and security of its data.
Field-level validation rules are crucial. These ensure data meets target requirements before it’s loaded into the ERP, preventing errors like missing values or formatting issues [18].
Prioritize security at every integration point. Use Transport Layer Security (TLS) for data encryption, OAuth tokens for authentication, and role-based access controls to limit user access based on responsibilities [4][15][18].
Continuous monitoring is non-negotiable. Set up transaction logging and automated alerts to catch anomalies early [15]. Also, ensure your integration complies with regulations like GDPR, CCPA, or SOC2 [15][18].
In 2023, 95% of organizations evaluating ERP systems showed interest in cloud deployments, reflecting a shift toward modern, secure infrastructures [18]. Cloud providers often handle compliance and security updates, simplifying management. Still, CFOs should confirm that their specific integration setup meets all applicable standards.
Document your data governance policies. Clearly outline how changes - like updates to customer records or vendor payment terms - propagate through your system. This documentation reinforces the dashboard as a single source of truth and proves invaluable during audits or when preparing for acquisitions or fundraising [15][4].
Integrating dashboards is just the first step - ongoing adjustments are essential to unlock their full potential. CFOs who treat dashboards as static tools risk missing out on opportunities to improve efficiency and gain deeper strategic insights.
A one-size-fits-all dashboard rarely works. Different roles in an organization require tailored views to make the most of the data:
To make dashboards truly useful, define user access by combining "Roles" (tasks a user can perform) and "Responsibilities" (the specific data they can access). A Common Information Model (CIM) framework can help align the level of detail with the needs of various teams and leaders.
Keep widgets concise and focus on drill-through features that allow users to move from broad metrics to detailed views. To establish the dashboard as the go-to source for data, discourage reliance on manual Excel reports.
As CBIZ pointed out, "If a manager's bonus is directly tied to the designated system report, they will ensure that the data is correct!" [3]
Once dashboards are tailored, it’s crucial to keep users engaged by tracking how they interact with the system.
Keeping an eye on dashboard usage is key to ensuring teams don’t fall back into old habits, like using spreadsheets. Set up a quarterly value realization dashboard for finance and operations leaders to evaluate whether the system is saving costs and reducing reporting time.
Dashboards require ongoing attention to remain effective. Plan for regular updates to address evolving business needs, changes in master data, and staff turnover. Budget for maintenance, as systems don’t run themselves [3].
Assign clear roles for data ownership and retire outdated, oversized reporting packages. Focus on KPIs that align with your business strategy to streamline reporting. Encourage leaders to make checking the dashboard a daily habit - starting their day by reviewing key metrics before diving into emails. This practice reinforces the dashboard's importance as a primary decision-making tool.
Once usage is optimized, the next step is to measure the financial impact of your dashboard integration.
To calculate ROI, use the formula: (Investment Value – Investment Cost) / Investment Cost × 100 [20]. When assessing Total Cost of Ownership (TCO), consider a five- to ten-year timeframe and include factors like software subscriptions (which can start at $10,000 annually for mid-market SaaS ERPs), infrastructure, consulting, data migration, training, and ongoing personnel costs.
Differentiate between measurable savings - such as reduced labor costs, faster financial closes, and lower inventory carrying costs (often 20–30% of average inventory value annually [19]) - and less tangible benefits like improved decision-making and higher employee morale. Organizations that conducted pre-implementation ROI analysis and have been live for over a year report an 83% success rate in achieving their expected ROI [20].
Perform sensitivity analyses under various scenarios - conservative, moderate, and optimistic - to demonstrate financial resilience to your board. Tie specific KPIs to measurable results. For instance, has Days Sales Outstanding (DSO) decreased? Has the monthly close process been shortened (e.g., one distributor reduced it from 14 days to 5 days [2])? Has automating intercompany eliminations saved significant time (e.g., over 30 hours per month [2])?
As Bizowie stated, "The challenge isn't proving that modern ERP delivers value... The challenge is quantifying that value in ways that withstand board scrutiny." [19]
Real-time insights and streamlined processes lead to measurable ROI, making the integration costs worthwhile. Provide concise ROI summaries for leadership while offering detailed efficiency metrics for managers. Standardized reporting across the organization ensures consistent interpretation of data and enables the finance team to shift from routine scorekeeping to delivering strategic, forward-thinking insights.
Bringing ERP dashboards into your financial operations requires a thoughtful, step-by-step plan. Start by outlining clear goals for improving financial visibility, streamlining automation, and maintaining compliance. Build a cross-functional team that includes members from Finance, IT, and Operations to ensure the integration aligns with both business needs and technical capabilities. Take a close look at your workflows and data processes to identify areas where inefficiencies can be addressed.
Begin with a pilot program in a single department to test the system’s features and iron out any issues. Make sure to implement strong validation protocols and robust security measures, such as TLS 1.3+ and AES-256 encryption, to safeguard your data. Set up automated alerts for critical performance thresholds and adopt daily dashboard reviews to strengthen decision-making processes.
Keep the momentum going with continuous improvements. Schedule quarterly skill assessments and provide targeted training for team members. Perform daily balance reconciliations, review system logs weekly, and monitor performance metrics to anticipate and scale cloud capacity as transaction volumes increase.
These steps can lead to transformative results. Finance teams can move beyond basic scorekeeping to provide strategic insights, manual reconciliation efforts can be significantly reduced, and decision-makers gain instant access to critical metrics like cash flow, profitability, and operational efficiency. It’s worth noting that many ERP projects fail due to inadequate planning [5].
For businesses looking to implement these strategies successfully, Phoenix Strategy Group can be a valuable partner. They offer fractional CFO services, expertise in data engineering, and technical guidance to simplify ERP dashboard integrations. Their skills in API configuration, custom dashboard design, and data security can help ensure your system not only meets your needs today but also grows with your business - turning your financial insights into a true competitive edge.
When designing an ERP-driven financial dashboard, CFOs need to lay down a solid foundation to ensure success. Start by defining clear, measurable goals. These might include reducing the time spent on manual reporting, enhancing cash flow visibility, or ensuring compliance with regulatory requirements. To keep these objectives actionable and achievable, consider using the SMART framework - Specific, Measurable, Achievable, Relevant, and Time-bound.
Next, it’s crucial to align leadership and secure stakeholder buy-in. Share the project’s objectives, highlight the anticipated business benefits, and establish a governance process that brings finance, IT, and other key business units together. This collaborative approach ensures that everyone involved understands the goals and is committed to achieving them.
Finally, take the time to map existing workflows and data sources. This includes areas like accounts payable, payroll, and the general ledger. Understanding how data moves through these systems and into the ERP is essential for setting up real-time dashboard updates. By addressing these foundational steps, CFOs can create a dashboard that supports faster, data-driven decisions and aligns with the company’s broader financial goals.
CFOs often grapple with obstacles like data silos and outdated legacy systems when trying to integrate financial dashboards with ERP platforms. These challenges can result in duplicate data entries, inconsistent reporting, and delays in accessing real-time insights - issues that can significantly reduce the effectiveness of an integrated system.
To address these problems, it’s crucial to establish a single source of truth for your data while enforcing consistent data governance across all departments. Middleware or API solutions can act as a bridge between legacy systems and modern platforms, enabling real-time data sharing without the need for a complete system overhaul. Taking a phased migration approach - starting with non-critical functions and carefully validating data quality along the way - can also help reduce risks and make the transition smoother.
Phoenix Strategy Group provides specialized support to CFOs dealing with these integration challenges. Their services include tailored advisory solutions, data engineering expertise, and fractional CFO support. They can help your organization design a solid integration plan that aligns with your financial objectives, cleans up outdated data, and ensures your dashboards deliver actionable insights seamlessly.
To make well-informed decisions, CFOs need to keep a close eye on key financial metrics like revenue growth rate, gross margin, EBITDA, operating expense ratio, cash flow forecast, debt-to-equity ratio, customer acquisition cost (CAC), and customer lifetime value (CLV). Together, these figures paint a clear picture of the company’s financial standing, operational performance, and potential for long-term profitability.
By concentrating on these metrics, CFOs can spot emerging trends, mitigate risks, and ensure financial strategies align with broader business objectives. Leveraging an ERP dashboard provides real-time access to these critical numbers, empowering CFOs to act quickly and allocate resources more effectively.