Published on
February 20, 2026


When evaluating mergers and acquisitions (M&A), understanding the competition is critical. Why? Because 70% of M&A deals fail to meet their projected value, often due to overlooked market risks or misunderstood dynamics. Competitive landscape analysis helps you identify threats, opportunities, and a target's position in its industry. Here's what you need to know:
Competitive analysis isn't just about listing rivals - it's about identifying hidden risks and ensuring your deal delivers value. Whether it's pricing power, market positioning, or post-deal synergies, thorough research can prevent costly surprises.
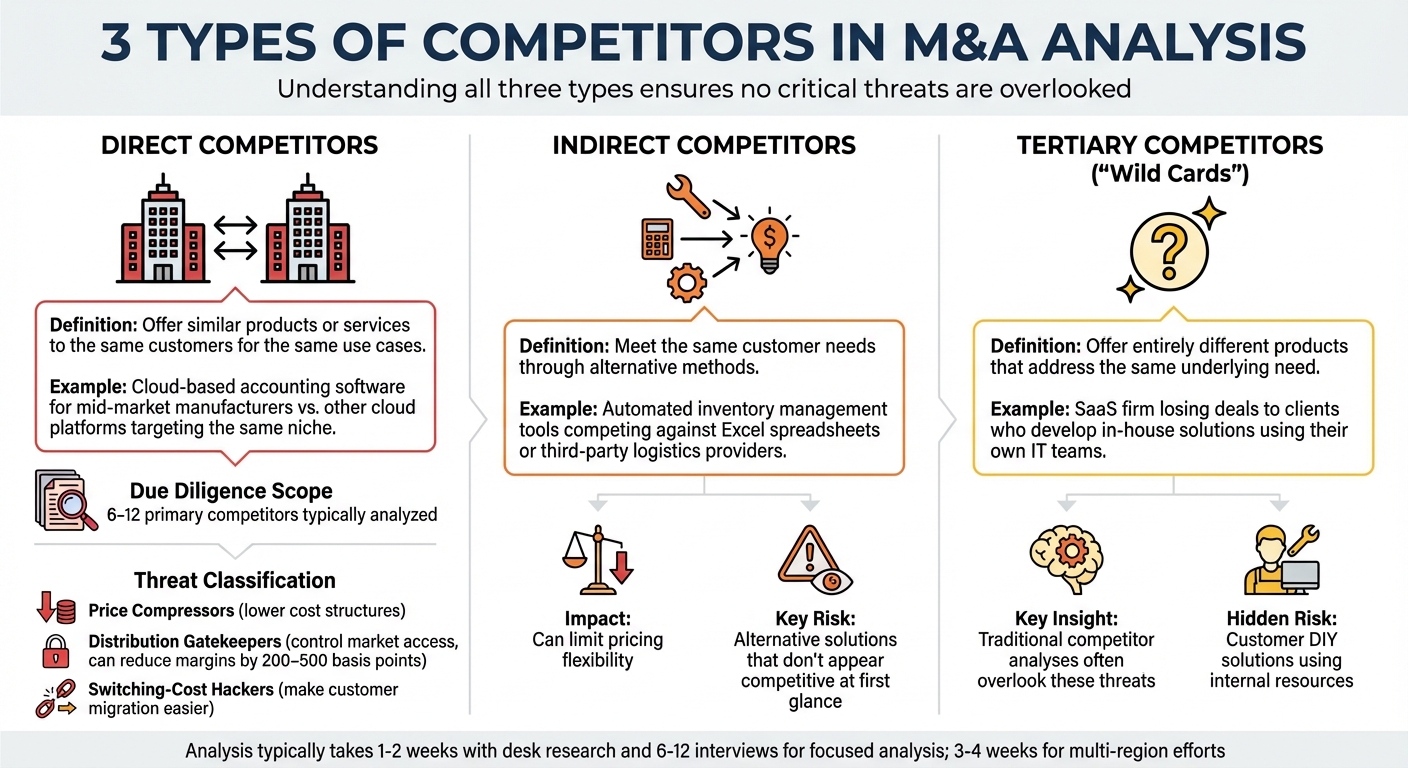
Three Types of Competitors in M&A Analysis: Direct, Indirect, and Tertiary
Understanding competitors - whether direct, indirect, or tertiary - is crucial for crafting strategies in an M&A deal. This approach ensures no critical threats are overlooked.
Direct competitors offer similar products or services to the same customers for the same use cases [2][6]. For example, if a company provides cloud-based accounting software for mid-market manufacturers, its direct competitors would be other cloud platforms targeting the same niche. Typically, due diligence involves a shortlist of 6–12 primary competitors [2].
Indirect competitors meet the same customer needs but through alternative methods, such as manual processes or outsourced services [2][6]. For instance, automated inventory management tools might face competition from Excel spreadsheets or third-party logistics providers, which can limit pricing flexibility [2].
Tertiary competitors, or "wild cards", offer entirely different products that still address the same underlying need. For example, a SaaS firm might lose deals not to rival vendors but to clients who develop in-house solutions using their IT teams - a risk that traditional competitor analyses often overlook [2]. Categorizing these threats can clarify their impact on business valuation. Examples include:
To determine where a target truly excels, analyze competitors across several dimensions: customer segments, geographic reach, pricing strategies, and value propositions [2]. This detailed mapping can reveal specific advantages, such as price premiums, lower operating costs, or superior Net Retention Rates [2].
This analysis highlights competitive strengths and structural risks, such as rivals controlling key distribution channels. The goal is to assess whether the target can maintain or grow its market share while sustaining a price premium of 150–250 basis points [2].
Creating "Competitor Cards" for key players can help. These cards summarize their strengths, pricing strategies, and potential reactions to an M&A deal. Early-warning indicators like discounting trends, advertising spend, or changes in sales team size can provide ongoing insights. Typically, a focused analysis takes 1–2 weeks with desk research and 6–12 interviews, while a broader, multi-region effort may require 3–4 weeks [8].
Competitors aren't limited to established players. New entrants and disruptors can rapidly change the landscape, especially in industries where barriers to entry have diminished. Advances like no-code platforms, cloud infrastructure, and AI make it easier for startups to enter markets that once required significant capital [7].
"The big purpose behind doing one of these is supporting our SLT's decision-making. This isn't just about understanding strengths and weaknesses - it's about charting our course, making sure we've got a well-defined niche, and ensuring we're not going to be overtaken by some adjacent threat we didn't see coming." – Hunter Sones, Competitive Enablement Manager, Klue [7]
When evaluating disruptors, consider their innovation and market execution capabilities. Classify threats as immediate, midterm (6–12 months), or speculative (12–24 months) [2][9]. For example, a startup with cutting-edge technology but no sales infrastructure may pose less of a short-term threat than an established company launching a new product with strong customer relationships [9].
Pay particular attention to adjacent competitors - those solving the same problem differently. Customer interviews can reveal why they left the target company and what alternatives they chose, exposing weaknesses and indirect threats [7]. In some cases, the biggest competitor isn’t another vendor but the customer’s ability to create in-house solutions using their IT resources [2].
Regulatory changes can also shift the competitive landscape. New licenses, interoperability rules, or mandates for data sharing could enable new players to enter the market [2][4]. Conversely, existing regulations might protect incumbents - at least until those protections are weakened. Evaluate how long it would take a competitor to replicate the target’s key advantages. If it’s only about six months, that edge is unlikely to justify a long-term premium valuation [2]. These risks should factor into any valuation adjustments.
After mapping competitor types and market positions, qualitative frameworks provide deeper insights for evaluating mergers and acquisitions (M&A). These tools help turn competitor intelligence into actionable strategies, shaping both valuation and deal structures.
SWOT analysis - Strengths, Weaknesses, Opportunities, Threats - is a tried-and-true method for identifying competitive advantages. In the M&A world, its real strength lies in uncovering "white space", or areas where a target company can carve out a strong, defensible position [6][7]. The key to making SWOT effective is basing it on solid data, like win-loss interviews, customer feedback, and SEC filings [6][7].
A common pitfall is creating generic lists. To avoid this, break down SWOT by specific competitor categories or product use cases [7]. This approach reveals nuances that broader analyses might miss. For example, a company might excel in mid-market manufacturing but struggle with enterprise accounts - a distinction that could significantly influence its valuation.
"The big purpose behind doing one of these is supporting our SLT's decision-making. This isn't just about understanding strengths and weaknesses - it's about charting our course, making sure we've got a well-defined niche, and ensuring we're not going to be overtaken by some adjacent threat we didn't see coming." – Hunter Sones, Competitive Enablement Manager, Klue [7]
Bias often creeps into SWOT analysis. Teams may exaggerate their own strengths or underestimate competitors [10]. To counteract this, many companies turn to third-party firms for win-loss interviews, which tend to yield more honest feedback [10]. Another hands-on tactic is to experience a competitor's customer journey firsthand - subscribe to their emails, test their purchasing process, and interact with their support team. These steps can uncover insights that raw data might miss [6].
For publicly traded competitors, the Management's Discussion and Analysis (MD&A) section in 10-K filings is a goldmine for understanding strategic priorities, R&D focus, and potential vulnerabilities [6]. Pairing SWOT with other frameworks like Porter's 5 Forces or PESTLE can help balance internal biases and provide a broader view of external factors [10][11]. Finally, translating SWOT findings into Competitor Cards can help track how rivals might respond to M&A moves, including pricing strategies and channel control [2].
Insights drawn from SWOT analysis naturally lead to understanding the economic forces at play, which is where Porter's 5 Forces comes in.
Introduced by Michael E. Porter in 1979 through the Harvard Business Review [12][14], the Five Forces framework remains a cornerstone for analyzing industry profitability. In M&A, it helps determine whether a target's market is worth entering and identifies potential margin pressures [11][15].
The framework examines five key forces: Competitive Rivalry, Supplier Power, Buyer Power, Threat of Substitutes, and Threat of New Entrants [12]. These forces outline the economic rules shaping an industry's profitability and can reveal whether a target company can maintain its margins or risks long-term compression.
"Industry profitability is driven less by who you are and more by the economic rules of the game you're playing." – Umbrex [12]
Porter's framework is especially useful in guiding build vs. buy vs. partner decisions. For instance, if supplier power is high - like dependence on a single cloud provider or proprietary API - this risk must be factored into valuation [11]. Similarly, strong buyer power with low switching costs can limit a target's pricing flexibility [11][13].
Precision matters when applying this framework. Avoid general categories like "healthcare." Instead, focus on specifics: product type, customer segment, geography, and distribution channel [12][15]. Many large companies operate across multiple industries, often requiring separate analyses for different business lines [14]. Rather than simply labeling forces as "strong" or "weak", link them to specific impacts on margins and identify actionable steps for improvement - like reducing supplier power through dual-sourcing or raising entry barriers with ERP integrations [12][2].
Modern updates to Porter's framework include factors like network effects, multi-homing, and gatekeepers (e.g., app stores or search algorithms) [12]. Some analysts even add a sixth force - Complementary Products and Services - to account for how related offerings influence profitability and growth [13][14].
While Porter's model highlights structural pressures, Strategic Groups Analysis focuses on clustering competitors by their strategies to pinpoint immediate threats.
Strategic groups analysis organizes competitors into clusters based on similar strategies or market positions [16]. It bridges the gap between broad industry structure and individual firm strategies, showing how competitive dynamics differ across clusters [16].
This framework is particularly valuable in M&A for identifying underserved segments or opportunities to create entirely new strategic groups [16]. It also clarifies which competitors pose the most immediate threats and whether a target company can defend or expand its market share while maintaining pricing power [2][16].
Mobility barriers - like economies of scale, proprietary technology, or exclusive distribution channels - often prevent firms from moving into more profitable groups [16]. When analyzing a target, consider the "cost of entry" into its strategic group. Is it in a defensible position, or is it stuck in a lower-margin segment? Generally, higher-profit groups have stronger barriers to entry and less exposure to substitutes [16].
"The analyst's essential task is to best position the firm's resources and capabilities to capitalize on opportunities and also defend against or move away from threats within the competitive environment." – Babette Bensoussan, Author and CI Professional [16]
Competition between groups depends on two main factors: strategic distance (how different the groups are) and market overlap (how much they share the same customer base) [16]. Even groups with distinct strategies can clash if they target the same segment. For example, a premium SaaS provider and a low-cost competitor might both compete for mid-market customers, intensifying price wars despite their differing approaches.
To visualize these dynamics, map competitors using two strategic variables - like price and geographic reach - as axes. This reveals clusters and highlights underserved areas [16]. Additionally, label rivals by their "threat type", such as "price compressors" (low-cost leaders) or "switching-cost hackers" (those who make it easier for customers to leave) [2].
In mergers and acquisitions (M&A) strategy, numbers add weight to the insights drawn from qualitative analysis. Quantitative metrics help confirm the strength of a competitor's market position by analyzing revenue trends, market concentration, and the resilience of competitive advantages. Here's a breakdown of the key financial metrics that provide a measurable view of competitive strength.
To understand a competitor's market share, track it over 8–12 quarters and cross-check the data with at least two independent sources. One-time snapshots won't cut it - long-term trends are essential. Market share should be calculated as a ratio, ensuring the numerator (target revenue or units) and denominator (total category size) align in scope, timing, and gross-to-net adjustments [2].
Beyond static market share, the Share of Growth (SOG) metric can offer deeper insights, especially in fast-evolving markets [2]. For instance, a company with 20% market share but capturing 40% of new growth is in a much stronger position than one maintaining similar share while losing ground.
Profitability metrics such as EBITDA margins, net profit margins, and cash flow trends are essential for gauging whether a competitor's growth is sustainable. Additionally, innovation capacity, often reflected in research and development (R&D) spending, is critical. Underinvesting in R&D could leave a competitor vulnerable to becoming outdated [1]. Solvency ratios (like debt-to-equity and interest coverage) and liquidity ratios (such as the current and quick ratios) provide insight into a competitor's ability to handle financial shocks and meet obligations. For example, a current ratio above 2:1 generally signals strong short-term financial health [4].
These financial indicators, often analyzed by a fractional CFO, set the stage for evaluating broader market structures, particularly the dynamics of fragmentation versus consolidation.
The Herfindahl-Hirschman Index (HHI) is a widely used tool to measure market concentration. It works by summing the squares of each competitor’s market share. For example, a 30% share contributes 900 points (30² = 900) to the total HHI [2]. A high HHI indicates a concentrated market with fewer, stronger competitors that often hold pricing power but face greater regulatory scrutiny. Conversely, a low HHI points to a fragmented market with many smaller players, intense competition, and lower barriers to entry [4].
"Rising HHI usually means fewer, stronger rivals; it can shape pricing power, promo intensity, and regulatory scrutiny." – Umbrex [2]
Regulatory bodies like the Department of Justice (DOJ) and the Federal Trade Commission (FTC) updated their Merger Guidelines on December 18, 2023, to clarify how they evaluate transactions that could limit competition [17]. Consolidated markets face higher regulatory risks, while fragmented markets may create opportunities for acquisitions aimed at scaling [17].
When calculating HHI, avoid broad market averages. Instead, focus on micro-segments like product tiers, customer sizes, or geographic regions, as economic conditions often vary significantly across these areas [2]. Additionally, don’t overlook "hidden" competitors like white-label providers, open-source solutions, or internal DIY alternatives, all of which can restrict pricing power even in markets that appear consolidated [2].
For sensitive customer or invoice-level data used in share analysis, ensure compliance with antitrust regulations by employing clean-team protocols [2].
The durability of a competitor’s position directly impacts its valuation. Use a VRIO framework (Value, Rarity, Inimitability, Organization) to evaluate whether a competitor’s advantages are defensible [2]. A competitive moat only holds value if it’s difficult or costly for rivals to replicate. To measure durability, track five key factors: technological advances, cost convergence, regulatory changes, channel consolidation, and the rise of substitutes or multi-homing [2].
Set numeric benchmarks to monitor potential erosion of competitive advantages. For instance, a realized price at least 6% higher than peers or a Net Retention Rate above 110% can indicate sustained strength. Breaching these thresholds, however, might signal that a competitive edge is slipping [2]. Tracking these metrics over time can help identify early warning signs.
It’s also important to distinguish between dollar share and unit share. A competitor gaining unit share through heavy discounting might still be losing dollar share and margins. In retail M&A, separating "sell-in" (sales to distributors) from "sell-through" (actual end-consumer sales) is crucial, as only the latter reflects genuine demand [2]. For usage-based business models, activity share metrics - like API calls, compute hours, or Gross Merchandise Value (GMV) - can serve as leading indicators of future dominance [2].
Finally, consider regulatory protections. Industries like healthcare and finance often feature competitors with exclusive licenses or regulatory privileges that shield their positions, even if their operational efficiency is lacking [2]. For example, violations of GDPR regulations have led to fines exceeding $50 million [4]. These quantitative insights can shape valuation adjustments, earnout structures, and protective clauses in M&A deal terms [2].
Understanding the competitive landscape plays a crucial role in shaping every phase of your M&A strategy. From valuation to negotiation and integration, insights into market dynamics, competitor strengths, and industry positioning provide a roadmap for making informed decisions. Here's how these insights translate into actionable strategies.
Before finalizing a deal, anticipate how competitors might react to the acquisition. One way to do this is by creating "Competitor Cards" that outline potential responses - like price wars, product bundling, or channel pressure. Classify competitors into categories such as price compressors, distribution gatekeepers, switching-cost hackers, or category reshapers to better understand the risks [2].
After the deal closes, implement early-warning indicators to track competitor behavior. Metrics like changes in discount strategies, advertising spend, partner relationships, and pipeline composition can signal shifts in the competitive environment [2].
"Done well, you will leave with... competitor response scenarios tied to early‑warning indicators. That enables sharper valuation, better terms, and a post‑close plan that concentrates firepower where it counts." – Umbrex [2]
Competitive insights help refine both valuation and deal terms. For example, if a competitor has a structural cost advantage or if channel consolidation threatens to shrink margins by 200–500 basis points, this should be factored into the purchase price or lead to protective deal terms [2]. Adjust valuations by calculating the market share thresholds needed to justify the deal, and account for potential risks.
Incorporate competitive risks into your financial models. For instance, if a rival could replicate your target's innovation within a year, adjust your discounted cash flow (DCF) model to reflect a reduced long-term terminal value [2]. Use tools like the Herfindahl-Hirschman Index (HHI) to assess market concentration - higher HHI values often indicate stronger competition and may warrant a higher risk premium [2]. Instead of simply lowering the price, consider structuring deals with earnouts tied to performance metrics or covenants that manage promotional intensity [2].
| Competitive Red Flag | Impact on Valuation/Negotiation |
|---|---|
| Structural Cost Advantage of Rival | Lower margins or direct price adjustments [2] |
| Platform Owner "Take Rate" Risk | Reduced revenue forecasts if platforms favor their own products [2] |
| Competitor Migration Tools | Higher churn assumptions, reducing switching cost valuations [2] |
| Regulatory Privileges of Rivals | Slower market entry or expansion, leading to discounts [2] |
Integration planning should start during the diligence phase. Use competitive assessments to identify areas where the merged entity can achieve synergies and build a stronger market position. For instance, map competition at the micro-segment level - by customer size, industry vertical, and use case - to locate opportunities where the combined company has a clear advantage [2].
Define specific KPIs and milestones for capturing synergies, and focus on actions like securing exclusive channel agreements or developing tools that increase switching costs. These moat-widening plays can protect and enhance the value of the acquisition [2] [18].
"Assign responsibility for capturing synergies with defined KPIs and target milestone dates. When synergies are captured, the result will be a successful acquisition." – Barry Glauberman, Gartner [18]
Competitive insights also guide cost-saving measures. For example, consolidating overlapping teams or product lines can drive efficiencies. Translate competitive advantages into measurable outcomes, such as improvements in net revenue retention (NRR), customer acquisition cost (CAC), or pricing power [2].
| Synergy Type | Competitor Insight Required | Integration Action |
|---|---|---|
| Revenue Synergies | Overlap in audience and product fit | Implement cross-selling and unified go-to-market strategies [18] |
| Cost Synergies | Cost structures and infrastructure scale | Streamline teams and optimize supply chains [2] [18] |
| Market Power | Competitor pricing and promotions | Adjust pricing strategies and refine discount frameworks [2] [18] |
| Operational Synergies | Talent gaps and rival expertise | Acquire key talent and rationalize redundant roles [18] |
Competitive landscape analysis transforms M&A from a gamble into a calculated strategy. By using both qualitative and quantitative frameworks to assess a target’s market position, you can gauge whether it’s equipped to maintain its edge after the deal closes.
Consider this: 70% of M&A deals fail to deliver on their promised value [3]. On the other hand, companies that perform thorough technology due diligence are 28% more likely to meet their post-deal goals [3]. These numbers highlight one key takeaway - rigorous analysis is what separates successful acquisitions from costly missteps.
This is where competitive intelligence becomes indispensable.
"Competitive intelligence can do more than just inform strategy. It provides a foundation on which to base intelligent M&A due diligence." – IBCA Editorial Team [3]
The real strength of competitive analysis lies in its ability to refine valuations, pinpoint risks, and uncover synergies. By mapping the competition down to micro-segments and cross-checking claims with the two-source rule [2], you can avoid overpaying and identify hidden challenges - like a rival’s lower cost structure or looming technological risks [3]. For example, one manufacturing company used outside-in diligence to uncover more than 200% of its original cost synergy estimate through deeper competitive research [5].
Looking ahead, AI-driven diligence and ongoing competitive intelligence are set to reshape the M&A landscape. While only 16% of M&A professionals currently leverage generative AI, adoption is expected to soar to 80% by 2028 [3]. The tools and frameworks discussed here are designed to help businesses stay ahead - delivering sharper valuations, stronger negotiations, and smoother integrations.
To move quickly, structured market research is key. Start by setting clear objectives and relying on trustworthy data sources like industry reports and AI tools. When assessing competitors, focus on factors such as their market position, product lineup, and strategic alignment. For extra support, Phoenix Strategy Group offers resources that can simplify target screening and competitor analysis.
Key metrics to evaluate a company's competitive position in an M&A deal include revenue growth, EBITDA margin, market share, valuation multiples (like EV/EBITDA), and operational efficiency. These factors provide a clear picture of financial stability, competitive edge, and potential synergies - critical elements for determining the deal's overall worth.
To tackle competitive risks in deal terms, consider adjusting the purchase price to account for varying risk levels. You can also implement earnouts that are tied to future performance, ensuring both parties remain aligned on incentives. Additionally, include covenants like non-compete clauses to help reduce potential threats. These approaches can help safeguard your investment while maintaining alignment between all involved parties.