Published on
December 12, 2025


In SaaS mergers and acquisitions (M&A), competitive landscape analysis is the foundation of evaluating a company's market position, potential risks, and future value. Buyers analyze metrics like ARR (Annual Recurring Revenue), churn rates, and net revenue retention (NRR) to assess a company's sustainability and differentiation. Unlike traditional industries, SaaS relies heavily on recurring revenue, customer retention, and scalability, making this analysis critical to avoid overpaying or misjudging risks.
Key takeaways include:
For SaaS companies aiming to sell, preparing detailed competitive analyses early - covering customer metrics, peer benchmarks, and market threats - can improve valuations and negotiation outcomes. Engaging experienced advisors can help refine this process and maximize deal success.
Even SaaS companies with solid revenue growth can stumble when crafting their competitive story for mergers and acquisitions (M&A). These missteps don’t just weaken the seller’s pitch - they can directly impact valuation, deal structure, and whether the transaction closes at all. Buyers tend to focus on three key areas where companies often fall short.
Sellers frequently rely on basic metrics like ARR (Annual Recurring Revenue), growth rates, and customer counts. While numbers like $15M ARR and 500 customers might sound impressive, they can hide deeper vulnerabilities. For instance, a high ARR might be heavily concentrated in price-sensitive SMBs with month-to-month contracts and a 30% annual churn rate. On the other hand, a competitor with $10M ARR but multi-year enterprise contracts and net revenue retention over 120% can command a higher valuation - even if their ARR seems smaller at first glance.
What buyers want is a detailed breakdown of ARR by customer size, industry, and geography. They also look for metrics like gross retention, net retention, expansion revenue, and gross margin for each segment. For example, if U.S. mid-market healthcare customers show less than 5% annual churn and over 130% net revenue retention, that’s a strong signal - even if weaker SMB performance pulls down the blended churn rate. Without this level of segmentation, sellers risk overestimating value and losing credibility during negotiations. Simply treating all ARR as equal is a quick way to undermine trust and negotiating power.
Sellers often present metrics like CAC (Customer Acquisition Cost), LTV (Lifetime Value), or churn without comparing them to industry standards. A 12-month CAC payback or 10% annual churn might sound reasonable, but without peer benchmarks, these numbers lack context. Buyers, especially sophisticated ones, always compare these figures to data from public SaaS companies and private market deals to gauge performance.
Buyers rely on benchmarks from sources like public filings, industry reports, and proprietary data from past transactions. They examine metrics like revenue growth, net dollar retention, sales efficiency, and Rule of 40 scores for companies in similar ARR ranges and industries. If sellers skip this step, buyers control the narrative, often using their own comparisons to justify lower valuations or more conservative deal terms. A simple benchmarking table that shows where the company stands - above, in line with, or below peers - can address these concerns early. Experienced advisors, like Phoenix Strategy Group, help SaaS companies create these analyses to support stronger valuations and more favorable deal terms.
Another common blind spot is ignoring new and non-traditional competitors. Sellers often focus solely on familiar rivals, missing the disruptive forces reshaping their market. AI-powered tools offering cheaper automation, large platforms bundling SaaS features into existing subscriptions, and private equity-backed vertical SaaS consolidators are all shaking up the landscape. Buyers increasingly use advanced tools to monitor new entrants, funding activity, product launches, and hiring trends in real time. If a seller’s competitive analysis doesn’t account for these threats, buyers may question the management team’s awareness of market risks.
When buyers uncover competitive blind spots during due diligence - whether through customer interviews, third-party data, or their own research - it can erode trust. This often leads to more conservative revenue projections, lower valuation multiples, and deal structures tied to performance targets. For example, discovering that a well-funded AI competitor is gaining traction in key U.S. markets can significantly shift the deal narrative, sometimes compressing valuations. Addressing these emerging threats upfront is critical for setting realistic expectations and securing strong deal terms. A 2024 SaaS M&A study analyzing 3,598 deals found that SaaS M&A activity surged by over 41% compared to 2023, with valuations climbing for high-quality assets - making detailed competitive analysis more important than ever for pricing and risk evaluation. [4]
To transition from identifying problems to presenting solutions, you need a framework that buyers can rely on. This framework should directly address the gaps and weaknesses previously identified. The aim? To clearly understand your market position, compare your performance to real competitors, and highlight areas where you have distinct advantages. And here's the key: this groundwork must be done before entering a formal M&A process - not during due diligence when buyers take control of the narrative. Below, we’ll break down how to map your market, benchmark critical metrics, and analyze customer segments effectively.
Start by defining the problems your product solves and the core use cases it addresses. For instance, does it cater to marketing automation, vertical ERP tailored for healthcare, or CPQ solutions for mid-market companies? Once you’ve nailed that down, map out vendors based on these use cases and target segments. A good SaaS market map typically organizes along two or three dimensions:
For visual clarity, use a 2x2 market map to position your company against competitors and uncover strategic gaps. Complement this with a competitive grid that categorizes direct competitors, indirect players, and emerging threats, including substitutes like spreadsheets or adjacent tools that could siphon budgets.
To dig deeper, consider adapting Porter’s Five Forces for SaaS to analyze:
In the U.S. M&A landscape, advisors often integrate these maps into investment memos and board presentations to shape deal strategies and post-acquisition growth plans.
When buyers evaluate your company, they’ll compare your performance to benchmarks from public SaaS companies and private market deals. The key metrics to focus on include:
Gather benchmark data from sources like public filings (10-Ks, 10-Qs, earnings decks), industry reports, and proprietary deal data. Then, organize this data into percentile bands - bottom 25%, median, and top quartile - based on segments (e.g., SMB vs. enterprise) and average contract value (ACV).
Create a comparison table that juxtaposes your current and projected metrics with peer benchmarks. For each metric, determine whether you’re above, at, or below the benchmark and highlight the strategic implications. For example:
Standardize all data in U.S. dollars ($), use trailing twelve months (TTM) figures, and ensure consistency in definitions - for instance, separating logo churn from revenue churn or distinguishing between marketing CAC and fully loaded CAC. Firms like Phoenix Strategy Group can help SaaS companies create investor-grade benchmarking tables that align with data room materials, boosting valuations and securing better deal terms.
After benchmarking, take a closer look at your customer data to uncover where your strengths lie. Buyers want to know not just how you perform, but why. Start by defining your ideal customer profile (ICP) based on factors like industry, company size, job roles, ACV, and geography. Then, align this with competitors targeting similar segments.
Conduct a win/loss analysis to quantify win rates and identify whether you succeed due to pricing, features, relationships, or vertical expertise. Compare pricing models - per-seat, usage-based, tiered, or freemium - across competitors and assess how your pricing structure impacts competitiveness in different segments.
Build a feature comparison matrix that goes beyond marketing claims to focus on critical enterprise features, such as:
Categorize features as "parity", "advantage", or "gap", and connect these directly to revenue or churn scenarios. This level of detail not only shows buyers that you understand your market position but also proves you’re not overstating your strengths. It’s all about demonstrating a clear, defensible niche.
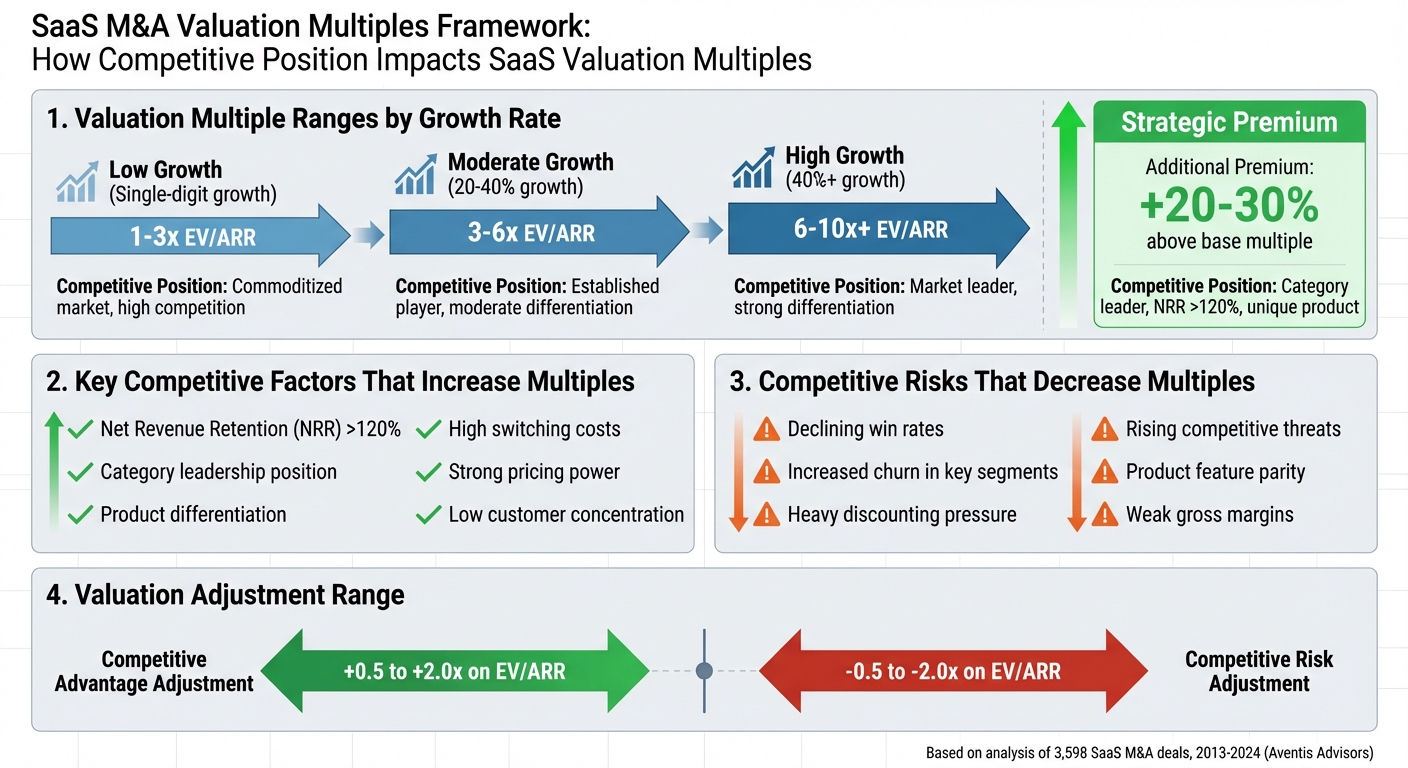
SaaS M&A Valuation Multiples by Growth Rate and Competitive Position
When buyers evaluate SaaS companies, they rely on revenue multiples (EV/ARR or EV/Revenue), adjusting for factors like growth, net retention, gross margin, and market share [2][3][6]. Companies that lead their category, offer distinct products, and boast net retention above 120% often achieve higher multiples compared to their peers [2][4][6]. On the other hand, signs of rising competition - slower win rates, increased churn in key segments, or heavy discounting - can lead buyers to apply discounts or shift more of the purchase price to contingent payouts [3][4].
Revenue multiples typically fall into ranges based on growth rates: 1–3x for single-digit growth, 3–6x for growth between 20–40%, and 6–10x or more for high-growth companies with strong competitive advantages, especially in strategic acquisitions [4][6]. A study by Aventis Advisors, covering 3,598 SaaS M&A deals from 2013 to 2024, revealed that faster-growing companies secure much higher multiples, reflecting the value placed on competitive strength [4]. By analyzing competitors, deal teams can refine comparisons to companies with similar customer profiles, contract values, go-to-market strategies, and market conditions [3][8][4]. M&A advisors often conduct sensitivity analyses to link market share, pricing power, product differentiation, and switching costs to valuation adjustments (ranging from ±0.5–2.0x on EV/ARR). This approach helps create a solid narrative during negotiations, sometimes justifying acquisition premiums of 20–30% or more over average SaaS valuations [2][3][4][6].
These valuation adjustments set the stage for deal structures that directly address competitive risks.
Competitive risks don’t just shape valuations - they also influence how deals are structured. Buyers often respond to these risks by reducing upfront cash payments and relying more on contingent mechanisms [3][6][7]. Earnouts tied to measurable metrics like ARR, GAAP revenue, or net dollar retention over 12–36 months are common when there’s a strategic fit but uncertainty about how competition might affect short-term growth [3][7][6].
Other tools include holdbacks or escrows to guard against potential churn from unstable customer relationships [3][6]. When competitive pressures demand higher sales and marketing spend, buyers may tighten working capital and net debt adjustments [3]. Deferred payments or seller notes over 12–24 months allow buyers to monitor how competitive conditions evolve [3][6]. Representations and warranties related to competition - such as customer concentration and pricing commitments - help mitigate known risks [3][6]. If key talent, product features, or customer relationships are critical differentiators, buyers often offer retention packages (like RSUs, cash bonuses, or multi-year vesting) and enforce non-compete and non-solicit clauses to maintain their edge [3]. Competitive analysis plays a key role in determining whether risks should be reflected in the price or explicitly addressed in deal terms.
Once valuations are set and competitive risks addressed, it’s crucial to tailor the narrative to the type of buyer.
Strategic buyers focus on acquisitions that enhance their ecosystem by filling product gaps, countering rivals, or expanding market share [3][5][6]. For these buyers, competitive analysis should emphasize synergies in go-to-market strategies and cross-selling opportunities, while showing how the deal weakens competitors (e.g., removing a key rival). These insights can justify higher multiples and more upfront cash in cases where the target is seen as essential [4][6].
Private equity buyers, on the other hand, prioritize steady cash flow, operational improvements, and growth - whether organic or through add-ons [3][4][6]. For these buyers, the focus should be on demonstrating revenue stability under competitive pressures, backed by solid retention rates, strong contract terms, and high switching costs. Highlighting opportunities for operational and pricing improvements compared to peers is also key [3][4]. PE deals often feature narrower valuation ranges and a heavier reliance on contingent considerations like earnouts, ratchets, or performance-based equity [4][6].
To prepare for a successful M&A transaction, growth-stage SaaS companies need to build on a strong competitive analysis framework. Here's a closer look at the steps involved.
Start by identifying your competitive set. This means listing your direct, indirect, and emerging competitors, organized by customer segment and use case. Centralize key metrics - like ARR, MRR, logo count, churn, cohort data, win/loss records, and pricing - into a single data repository, such as a data warehouse or BI system. Each metric should be clearly tied to specific customer segments to ensure clarity and relevance.
Consistency is key when tracking SaaS KPIs. Use standardized formulas and ensure all metrics are reported in U.S. dollars. Focus on core KPIs like ARR/MRR, net and gross retention, logo churn, CAC, LTV, CAC payback, expansion revenue, and gross margin. To make this data actionable, create a concise competitive narrative (1–2 pages) highlighting your win/loss drivers and product differentiation.
Regularly review your competitive landscape. Set up monthly or quarterly dashboards to track competitor activity - such as funding rounds, pricing adjustments, major product launches, and hiring trends. These reviews will help you keep your competitive narrative up to date, which is critical when buyers evaluate your business. Use win/loss analysis to identify which competitors you face most often, why deals are won or lost, and how to refine your product, pricing, and positioning accordingly. Additionally, segment your customer base by industry, size, contract value, and use case, and align each segment with its primary competitors and key differentiators.
Before approaching potential buyers, organize a well-structured data room. This should include categorized folders for financials, customers, product details, sales/marketing information, and competition insights. Include detailed ARR/MRR tables with segment-specific tags and competitor data. Visual dashboards showcasing market share, growth, and retention metrics can make buyer evaluations smoother and boost their confidence in your business.
Once your competitive data and narrative are solidified, seek expert advisory support to further refine your M&A readiness.
Specialized advisors can play a pivotal role in turning competitive insights into higher valuations and better deal terms. Phoenix Strategy Group, for example, offers fractional CFO services, FP&A, data engineering, and M&A advisory. Their expertise helps refine KPI frameworks, automate ARR and retention tracking, and connect competitive dynamics to valuation.
Phoenix Strategy Group has an impressive track record, having completed over 100 M&A transactions and raised more than $200 million for portfolio companies in the past year alone [1]. With firsthand experience in building and selling multiple nine-figure businesses, they excel at positioning companies to attract the right buyers - whether it's strategic acquirers looking for synergies or private equity firms focused on strong financials.
"PSG and David Metzler structured an extraordinary M&A deal during a very chaotic period in our business, and I couldn't be more pleased with our partnership." - Lauren Nagel, CEO, SpokenLayer
Engaging advisors early - ideally 12 to 24 months before a sale - can make a significant difference. They can help you build the necessary data infrastructure, refine your competitive narrative, conduct peer benchmarking, and manage buyer interactions effectively. These steps not only streamline the process but also improve the likelihood of a successful exit for growth-stage SaaS companies.
To stand out during mergers and acquisitions, SaaS companies need to emphasize metrics that showcase their financial health and potential for growth. Key indicators like monthly recurring revenue (MRR) or annual recurring revenue (ARR), customer acquisition cost (CAC), customer lifetime value (CLTV), and churn rate are essential. These numbers provide a clear picture of revenue consistency and customer value.
Other important metrics include gross margin, which highlights profitability, net revenue retention (NRR) to demonstrate customer retention and upsell success, and the overall growth rate, which signals scalability.
By focusing on these figures, you not only make it easier for buyers to evaluate your business but also position your company as a competitive force in the SaaS industry.
To gauge how well they stack up against competitors, SaaS companies should zero in on critical metrics such as revenue growth, customer acquisition cost (CAC), churn rate, and customer lifetime value (LTV). Comparing these figures with industry benchmarks can reveal both strengths and areas needing improvement.
Using dependable industry reports, financial data, and competitive analysis tools can uncover trends and highlight effective strategies. Consistently revisiting and refining key performance indicators (KPIs) helps ensure they stay in sync with market expectations, enabling smarter, data-driven decisions that fuel growth and scalability.
SaaS companies sometimes miss critical competitive risks when evaluating mergers and acquisitions (M&A), which can lead to unexpected hurdles after the deal is closed. A common blind spot is hidden customer concentration, where a large chunk of revenue relies on just a few clients. This can create vulnerabilities if those clients leave or reduce spending. Another issue is overly optimistic growth projections that fail to consider market saturation or increasing competition.
Additional risks include unnoticed dependencies on specific products, markets, or technologies. These dependencies can become liabilities if market conditions shift or technologies become obsolete. Integration challenges are another pain point, as they can disrupt daily operations or delay the expected benefits of the merger. Spotting these risks early is essential for ensuring the deal delivers on its promises.