Published on
December 10, 2025


Contribution margin is the key to understanding your business's profitability and growth potential. It shows how much money is left after covering variable costs - funds that can be used to pay fixed expenses and generate profit. Without a strong contribution margin, scaling your business could mean losing money with every new customer or sale.
Here’s why it matters:
For example, if your product sells for $80, with $50 in variable costs, your contribution margin is $30. If fixed costs are $60,000 monthly, you need to sell 2,000 units to break even. Improving contribution margin - like lowering variable costs - makes it easier to scale profitably.
This article breaks down how contribution margin connects to pricing, cost control, and growth strategies, helping you make smarter financial decisions.
How to Calculate Contribution Margin: 3 Essential Formulas with Examples
Grasping these metrics is crucial because they directly impact unit economics, pricing strategies, and cost management.
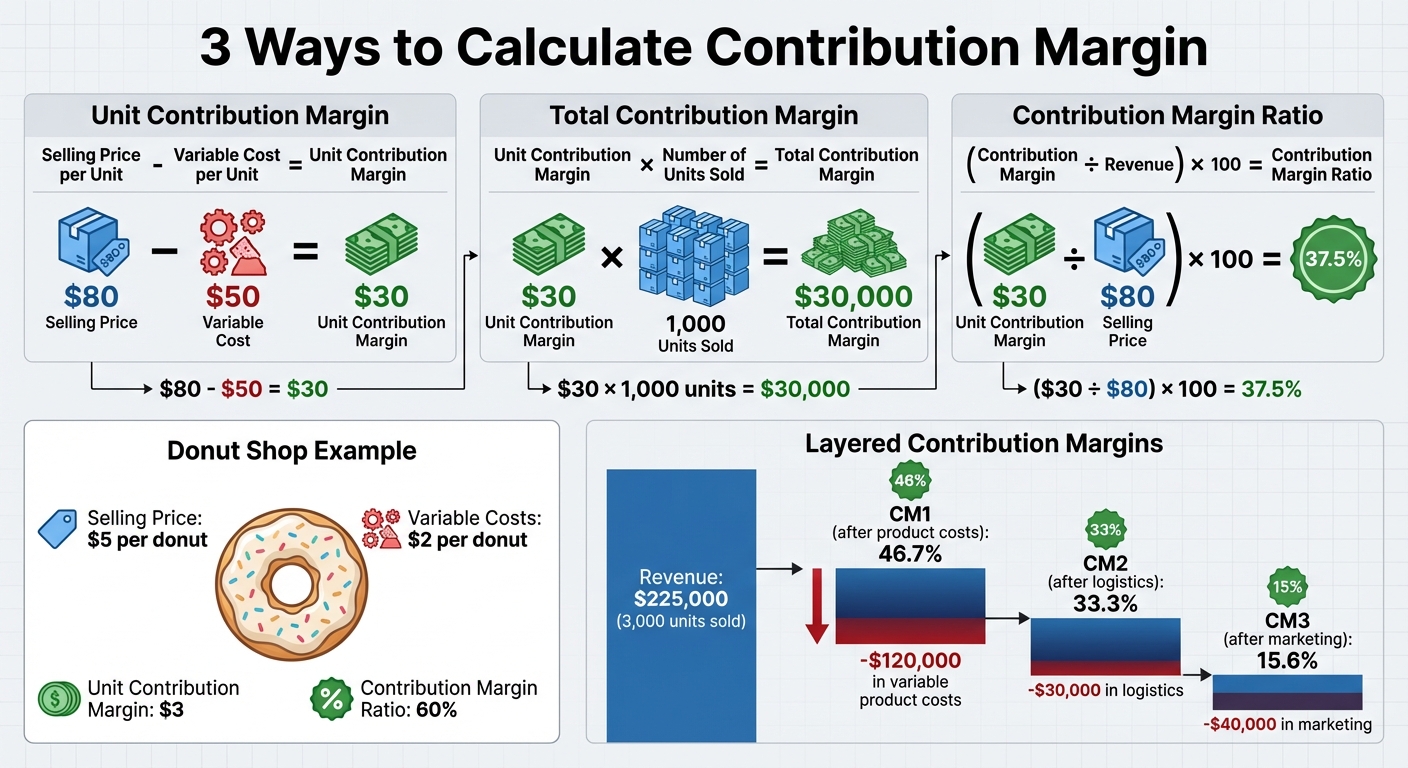
There are three primary formulas to calculate contribution margin. The unit contribution margin is found by subtracting the variable cost per unit from the selling price per unit. For instance, if a product sells for $80 and its variable costs are $50, the unit contribution margin is $30. The total contribution margin is calculated by multiplying the unit contribution margin by the number of units sold. Using the same example, selling 1,000 units at $30 each results in a total contribution margin of $30,000. Finally, the contribution margin ratio expresses this as a percentage by dividing the contribution margin by revenue. In this case, $30 divided by $80 equals a 37.5% contribution margin ratio.
Imagine a donut shop selling donuts at $5 each with $2 in variable costs. Each donut contributes $3 to the margin, or 60% of the sales price.
To dig deeper, businesses often track contribution margins at different levels. CM1 focuses on direct product costs, CM2 also deducts logistics and payment fees, and CM3 goes further by subtracting variable marketing expenses. For example, consider an e-commerce brand with $225,000 in revenue from selling 3,000 units. If the brand incurs $120,000 in variable product costs, $30,000 in logistics, and $40,000 in marketing, their margins would be: CM1 at 46.7%, CM2 at 33.3%, and CM3 at 15.6%. This layered approach helps businesses identify where profits are shrinking and which products, channels, or customer groups perform best.
These calculations are essential for categorizing costs, which we'll explore next.
Differentiating between variable and fixed costs is a key step in understanding contribution margins. Variable costs fluctuate based on the number of units sold, orders processed, or customers served. For e-commerce, these might include product costs, packaging, shipping, payment fees, commissions, and returns. In the SaaS world, variable costs often involve cloud computing tied to active users or transactions, third-party service fees charged per use, customer support costs that grow with ticket volume, and messaging fees for SMS or email.
On the other hand, fixed costs stay relatively constant regardless of sales volume over a given timeframe. Examples include rent for office or warehouse space, salaries for administrative or engineering staff, flat-rate software subscriptions, annual insurance premiums, and allocated overhead. However, some costs fall into a gray area. For instance, customer support might combine fixed salaries with variable overtime or contract labor. Similarly, cloud services may involve a base fee plus usage-based charges. To classify costs, ask: Does this expense increase with each additional unit sold? If yes, it’s variable.
Finance teams often formalize these classifications by reviewing a profit and loss statement, categorizing each cost as variable, fixed, or mixed based on actual behavior, and breaking mixed costs into components using vendor rate cards or historical data. Gray areas often include customer support, marketing expenses (performance campaigns are variable, while brand retainers are fixed), and cloud costs. Growth-stage companies frequently turn to experienced FP&A teams or fractional CFOs, like those at Phoenix Strategy Group, to streamline these definitions and adjust them as the business evolves.
Clear cost classification is a must for accurate profitability analysis, which we’ll dive into next.
Contribution margin forms the backbone of profitability analysis at various levels. At the product level, comparing unit contribution margins across SKUs reveals which products deliver the most value after covering variable costs. This insight drives decisions on pricing, promotions, and inventory. For example, a jewelry maker selling handmade pieces for $100 with $60 in variable costs earns $40 per piece. Selling 250 units monthly results in $10,000 in contribution margin before accounting for fixed costs.
At the customer or cohort level, contribution margin analysis helps identify which customer groups are truly profitable after factoring in variable servicing costs. For instance, a SaaS company generating $60 per user per month, while spending $8 on cloud costs, $4 on support, and $1.80 on payment fees, achieves a contribution margin of $46.20 per customer per month - or about 77%. This data is crucial for calculating customer lifetime value and refining acquisition strategies.
At the channel level, analyzing contribution margin after deducting channel-specific fees and marketing expenses highlights which sales channels offer the best returns. Whether it’s direct-to-consumer, Amazon, retail partnerships, or affiliate networks, this level of analysis helps businesses optimize their distribution strategies.
Contribution margin plays a key role in understanding unit economics, shaping decisions around pricing, cost control, and scalable growth. Let’s break down how these metrics directly influence essential business measures.
The contribution margin helps determine how many units you need to sell before your business becomes profitable. The formula is simple: breakeven units = total fixed costs ÷ contribution margin per unit. For breakeven revenue, use total fixed costs ÷ contribution margin ratio.
Here’s an example: Imagine a product priced at $100 with variable costs of $60 and monthly fixed costs of $20,000. To break even, you’d need to sell 500 units or generate $50,000 in revenue. Each additional unit sold contributes $40 to profit.
Even small improvements in contribution margin can significantly lower your breakeven point. For instance, reducing variable costs from $60 to $50 increases your contribution margin to $50 per unit. That change means you’d only need to sell 400 units to break even - a 20% reduction in the volume required. This highlights how optimizing contribution margin can make your path to profitability much smoother.
Next, let’s look at how contribution margin impacts customer-focused metrics.
For businesses with subscription or recurring revenue models, contribution margin directly affects how quickly you recover Customer Acquisition Costs (CAC) and the long-term value customers generate.
The CAC payback period is calculated as your total CAC divided by the monthly contribution margin per customer. A higher contribution margin shortens this payback period, freeing up cash to reinvest in acquiring more customers.
Consider a SaaS company charging $50 per month with $15 in variable costs (e.g., payment processing, support). The monthly contribution margin per customer is $35. If the CAC is $210, the payback period is 6 months ($210 ÷ $35). Now, if the company reduces variable costs to $10, the contribution margin increases to $40, and the payback period drops to 5.25 months. This improvement accelerates cash flow, enabling faster growth.
The LTV/CAC ratio is another critical metric, and it should always be based on contribution profit - not gross revenue. Using the same SaaS example, if a customer stays for 24 months at a monthly contribution margin of $30, the contribution LTV is $720 ($30 × 24). With a CAC of $240, the LTV/CAC ratio is 3.0, which is a solid benchmark for growth-stage companies. Calculating this ratio using revenue instead of contribution margin could inflate the numbers and lead to poor financial decisions.
Contribution margin also provides insight into how efficiently your business can scale. Operating leverage refers to how profits grow at an accelerated rate as revenue increases - especially when fixed costs are high and contribution margins are strong. Once fixed costs are covered, every additional unit sold adds its full contribution margin to profit.
For example, let’s say your business has a $40 contribution margin per unit and $20,000 in fixed costs. At 500 units, you’re at breakeven with zero profit. But at 1,000 units, total contribution margin is $40,000 (1,000 × $40). After subtracting the $20,000 in fixed costs, you’re left with $20,000 in profit. Doubling sales volume more than doubles your profit because fixed costs remain constant while contribution margin grows with each additional unit sold. This is how operating leverage can amplify profitability - provided your contribution margin stays healthy.
Growth-stage businesses often work with FP&A teams or fractional CFOs, such as those at Phoenix Strategy Group, to model how changes in contribution margin affect scalability. These insights help determine when to ramp up spending on customer acquisition to fuel sustainable growth.
Think of contribution margin as your go-to tool for fine-tuning pricing and trimming costs. By understanding how price, variable costs, and contribution margin interact, you can make informed decisions that boost your unit economics.
Start by calculating your unit contribution margin: selling price minus variable cost per unit. For instance, if you sell a product for $50 and your variable costs are $30, your contribution margin is $20, or 40%. From there, figure out how much total contribution you need to cover fixed costs and achieve your profit goals. Let’s say you have $300,000 in fixed costs annually and aim for $200,000 in profit. That means you need $500,000 in total contribution. If you plan to sell 25,000 units, your contribution per unit must be $20. Adding this to your $28 variable cost gives you a minimum viable price of $48.
Run scenarios to see how changes in volume, costs, or discounting impact your contribution margin, breakeven units, and profits. Establish pricing benchmarks for your team, such as ensuring new products maintain at least a 60% contribution margin. When offering discounts, build a price sensitivity table showing how much additional volume is needed at different discount levels (e.g., –5%, –10%, –20%) to maintain the same total contribution dollars. Many businesses find that heavy discounts hurt profitability because the volume increase doesn’t make up for the reduced margin per unit.
Once pricing is set, look at your costs to further improve profitability.
While pricing determines your revenue baseline, cutting variable costs can significantly boost margins. Start by reviewing every per-unit expense - materials, packaging, labor, payment processing, shipping, commissions, and software fees. Some common ways to lower costs include renegotiating supplier contracts based on volume, consolidating vendors for bulk discounts, redesigning packaging to use less material, and switching to more efficient shipping or fulfillment partners.
Here’s an example: an e-commerce retailer selling a $60 product with $30 in variable costs ($18 for materials, $4 for pick/pack, $6 for shipping, and $2 for payment fees) has a 50% contribution margin. By renegotiating shipping to $4 and cutting packaging costs by $2, total variable costs drop to $24, raising the contribution margin to $36, or 60%. Similarly, a SaaS company earning $100 in monthly revenue per customer with $30 in variable costs (hosting, support, and third-party tools) has a 70% margin. By optimizing infrastructure and scaling customer success resources, they reduce variable costs to $22, increasing the margin to 78%. This improves key metrics like CAC payback and LTV/CAC ratios without raising prices.
These pricing and cost strategies create a solid foundation for financial planning.
Design your financial model with contribution margin at its core. Break down your income statement into levels: CM1 (revenue minus COGS), CM2 (CM1 minus logistics and operational variable costs), and CM3 (CM2 minus variable sales and marketing costs). For each product, region, or channel, track units sold, price per unit, and variable costs by category. Use this to calculate contribution margin dollars and percentages.
Incorporate drivers like volume, pricing, and variable costs to simplify forecasting. The model should show total contribution dollars by segment, margin percentage trends, breakeven units, and how profit changes with adjustments in price, volume, or costs. This approach keeps unit economics front and center, ensuring each product or channel contributes to overall profitability. Growth-stage companies often work with FP&A teams or fractional CFOs - such as those at Phoenix Strategy Group - to create these margin-focused models. These models automate reporting and integrate contribution margin analysis into cash-flow forecasts and funding strategies.
Once you’ve built a contribution-margin-driven model, the next step is to set up systems that consistently track and report these metrics. Without well-defined terms and regular updates, your insights can quickly lose their reliability.
Start by defining what constitutes a "unit" for your business - whether it’s an order, an active subscription month, or a completed transaction. Document this definition in a finance data dictionary to ensure everyone’s on the same page. Then, categorize costs clearly: variable costs (like materials, shipping, payment fees, commissions, and performance ads) fluctuate with volume, while fixed costs (such as salaries, rent, or software subscriptions) remain steady. Avoid inconsistencies, like classifying customer support as fixed in one report and variable in another, as this undermines comparability and skews your unit economics.
For reporting, weekly flash reports are effective for quick operational decisions, such as adjusting ad spend or promotions. On the other hand, monthly reports - with fully reconciled numbers - are better suited for board meetings and long-term strategic planning. Break down contribution margin by product, acquisition channel, and customer cohort to pinpoint which segments are driving profitability and which need improvement. Many growth-stage businesses collaborate with fractional CFO teams, like Phoenix Strategy Group, to design reporting frameworks, integrate data from billing and marketing systems, and automate dashboards that keep contribution margin top of mind.
These standardized reports form the foundation for deeper analyses, such as scenario and sensitivity planning.
Once your definitions and reporting cadence are in place, scenario planning becomes a powerful tool. It allows you to explore how changes in pricing, volume, customer acquisition cost (CAC), or variable expenses impact your unit contribution margin and broader unit economics. Use a driver-based model to tweak inputs (e.g., a 5% price hike, a 10% increase in shipping costs, or higher ad spend) and immediately see the effects on metrics like breakeven volume and LTV/CAC ratios.
Scenario analysis helps you evaluate full "what-if" scenarios - like "Base case", "Aggressive growth", or "Cost shock" - while sensitivity analysis zeroes in on how individual variables affect outcomes. For instance, you might find that a 10% rise in fulfillment costs lowers your contribution margin from 60% to 52%, meaning you’d need 15% more sales volume to meet the same profit target. Alternatively, increasing prices by just $3 per unit could improve your contribution margin enough to shorten CAC payback by two months. These insights allow you to set clear guardrails, such as maximum CAC per channel or minimum contribution margin thresholds for new products, so you can make quicker, more confident decisions when the market shifts.
While both gross margin and contribution margin measure profitability, they serve different purposes. Here’s a quick comparison:
| Dimension | Gross Margin | Contribution Margin |
|---|---|---|
| Formula | Revenue − COGS | Revenue − all variable costs |
| Costs included | Direct production costs | COGS plus shipping, fees, commissions, and performance marketing |
| Key question | "How profitable is the product after production?" | "How much does each unit contribute after all variable costs?" |
| Primary use | Financial reporting, high-level pricing | Unit economics, CAC payback, breakeven, and channel decisions |
| Relevance for growth | Important but not comprehensive | Essential for evaluating scalable, profitable growth |
It’s common for companies to report strong gross margins but struggle with weak or even negative contribution margins once sales and distribution expenses are factored in. This can obscure poor unit economics. While both metrics should be part of your monthly reporting, rely on contribution margin for operational decisions like scaling marketing efforts, fine-tuning pricing, and assessing new channels. Clearly distinguishing between the two ensures your unit economics remain accurate and actionable.
Contribution margin plays a crucial role in shaping unit economics and driving profitability for growth-stage businesses. It reveals how much of each revenue dollar remains after covering variable costs - funds that can then be used to address fixed expenses and generate profit. Without a positive contribution margin per unit, gaining new customers only increases losses, no matter how impressive revenue growth may appear.
The smartest founders and CFOs rely on contribution margin as a core metric for making informed decisions. Pricing strategies, marketing budgets, and channel investments are better aligned with CM-based unit economics rather than focusing solely on revenue. Operational improvements that lower variable costs directly enhance contribution margin, reducing breakeven volumes and increasing profitability for every unit sold beyond that point.
Consistent and disciplined reporting strengthens these efforts. Contribution margin should be embedded in FP&A models and tracked across products, channels, and customer cohorts. Regular scenario analysis can help assess the impact of pricing adjustments, cost changes, or shifts in sales channels on breakeven points, CAC payback periods, and LTV/CAC ratios. This level of financial rigor is exactly what U.S. investors and acquirers expect when evaluating growth-stage companies in today’s efficiency-focused market.
The contribution margin is a key metric for assessing how well your business can scale. It shows the profit remaining after accounting for variable costs, essentially revealing the funds available to fuel growth. A higher contribution margin means there’s more room to invest in areas like marketing, product innovation, or scaling operations.
This metric also helps identify your most profitable products or services, enabling you to channel resources into what drives consistent growth. By understanding and improving your contribution margin, you set the foundation for a scalable and financially sound business.
Improving your contribution margin is all about finding ways to increase profitability. Here are a few actionable strategies to help you get there:
For businesses in the growth stage, having expert advice can be a game-changer. Phoenix Strategy Group offers specialized financial and strategic advisory services to help companies manage costs, scale efficiently, and achieve long-term profitability.
The contribution margin plays a key role in driving growth because it reveals how much revenue is left after covering variable costs. This metric offers a sharper view of profitability on a per-unit basis, enabling businesses to make informed decisions regarding pricing, cost control, and expansion strategies.
Unlike gross margin - which accounts for fixed costs - the contribution margin zeroes in on variable costs. This makes it a more practical tool for fine-tuning unit economics and planning for long-term growth.