Published on
March 12, 2026


Beta calculation helps investors evaluate a stock's risk by comparing its volatility to the market. Beta values above 1.0 indicate higher volatility than the market, while values below 1.0 suggest lower volatility. For instance, a beta of 1.2 means a stock is 20% more volatile than the market.
Excel templates simplify beta computation, eliminating manual calculations. Popular options include:
SLOPE function for straightforward analysis with visual aids.Each template caters to different needs, from basic calculations to professional-grade financial modeling.

The Corporate Finance Institute (CFI) offers a beta calculator template that's both easy to use and effective for financial analysis. Trusted by over 2.8 million professionals, this free Excel template simplifies beta calculation by using Excel's SLOPE function. This approach eliminates the need for manual covariance and variance calculations, making it a practical tool for analyzing a stock's returns against a market index [6][7].
One of its standout features is its ability to visually represent data. The template includes a chart that plots the relationship between stock and market returns, helping users spot patterns and evaluate systematic risk for CAPM (Capital Asset Pricing Model) calculations [7]. This visual aspect enhances the overall analysis.
To get started, download the free template from CFI's website [6][7]. Then, gather weekly price data for both the target stock and a benchmark index, such as the S&P 500. It's important to ensure the datasets align in terms of dates and frequency [6].
Follow these steps:
For accurate results, use Adjusted Close prices and aim to include at least 24 to 36 months of return data [1][5].
This template combines ease of use with robust analysis, making it a valuable tool for financial professionals.

The 365 Financial Analyst Stock Beta Excel Template is a free XLSX tool designed for professionals who need a versatile way to assess risk. It’s part of a collection of Excel templates for calculating beta and incorporates tools like CAPM, regression analysis, and the Security Market Line [2].
This template stands out by catering to those pursuing careers in portfolio management or studying the CFA Level 1 Portfolio Management module [2]. It calculates beta using the classic formula: covariance between stock and market returns divided by the variance of market returns [2]. Its open-access format allows users to tweak formulas and structures to suit specific analytical needs.
"Beta is a measure of systematic risk that shows how an individual security moves when the overall stock market increases or decreases." - Ivan Kitov, 365 Financial Analyst [2]
The template offers flexibility by letting you import historical prices for any security and compare them against various indices, such as the S&P 500, NASDAQ, or even sector-specific benchmarks [2]. This is particularly useful for analyzing stocks that don't align neatly with broad market indices.
You can adjust the lookback period to suit your analysis goals. For example:
Additionally, the template supports the Adjusted Beta formula - (2/3 × Raw Beta) + (1/3 × 1.0) - which accounts for beta's natural tendency to move toward the market mean of 1.0 over time [9].
Another useful feature is the ability to match data frequency to your investment strategy. Use daily returns for short-term trading insights or weekly and monthly returns to reduce noise and focus on long-term trends [8][4].
The template’s user-friendly design makes it easy to get started. Here’s how:
Once you’ve determined your beta, you can dive deeper into systematic risk analysis using the Portfolio Management framework, aligning with the CFA Level 1 curriculum [2].
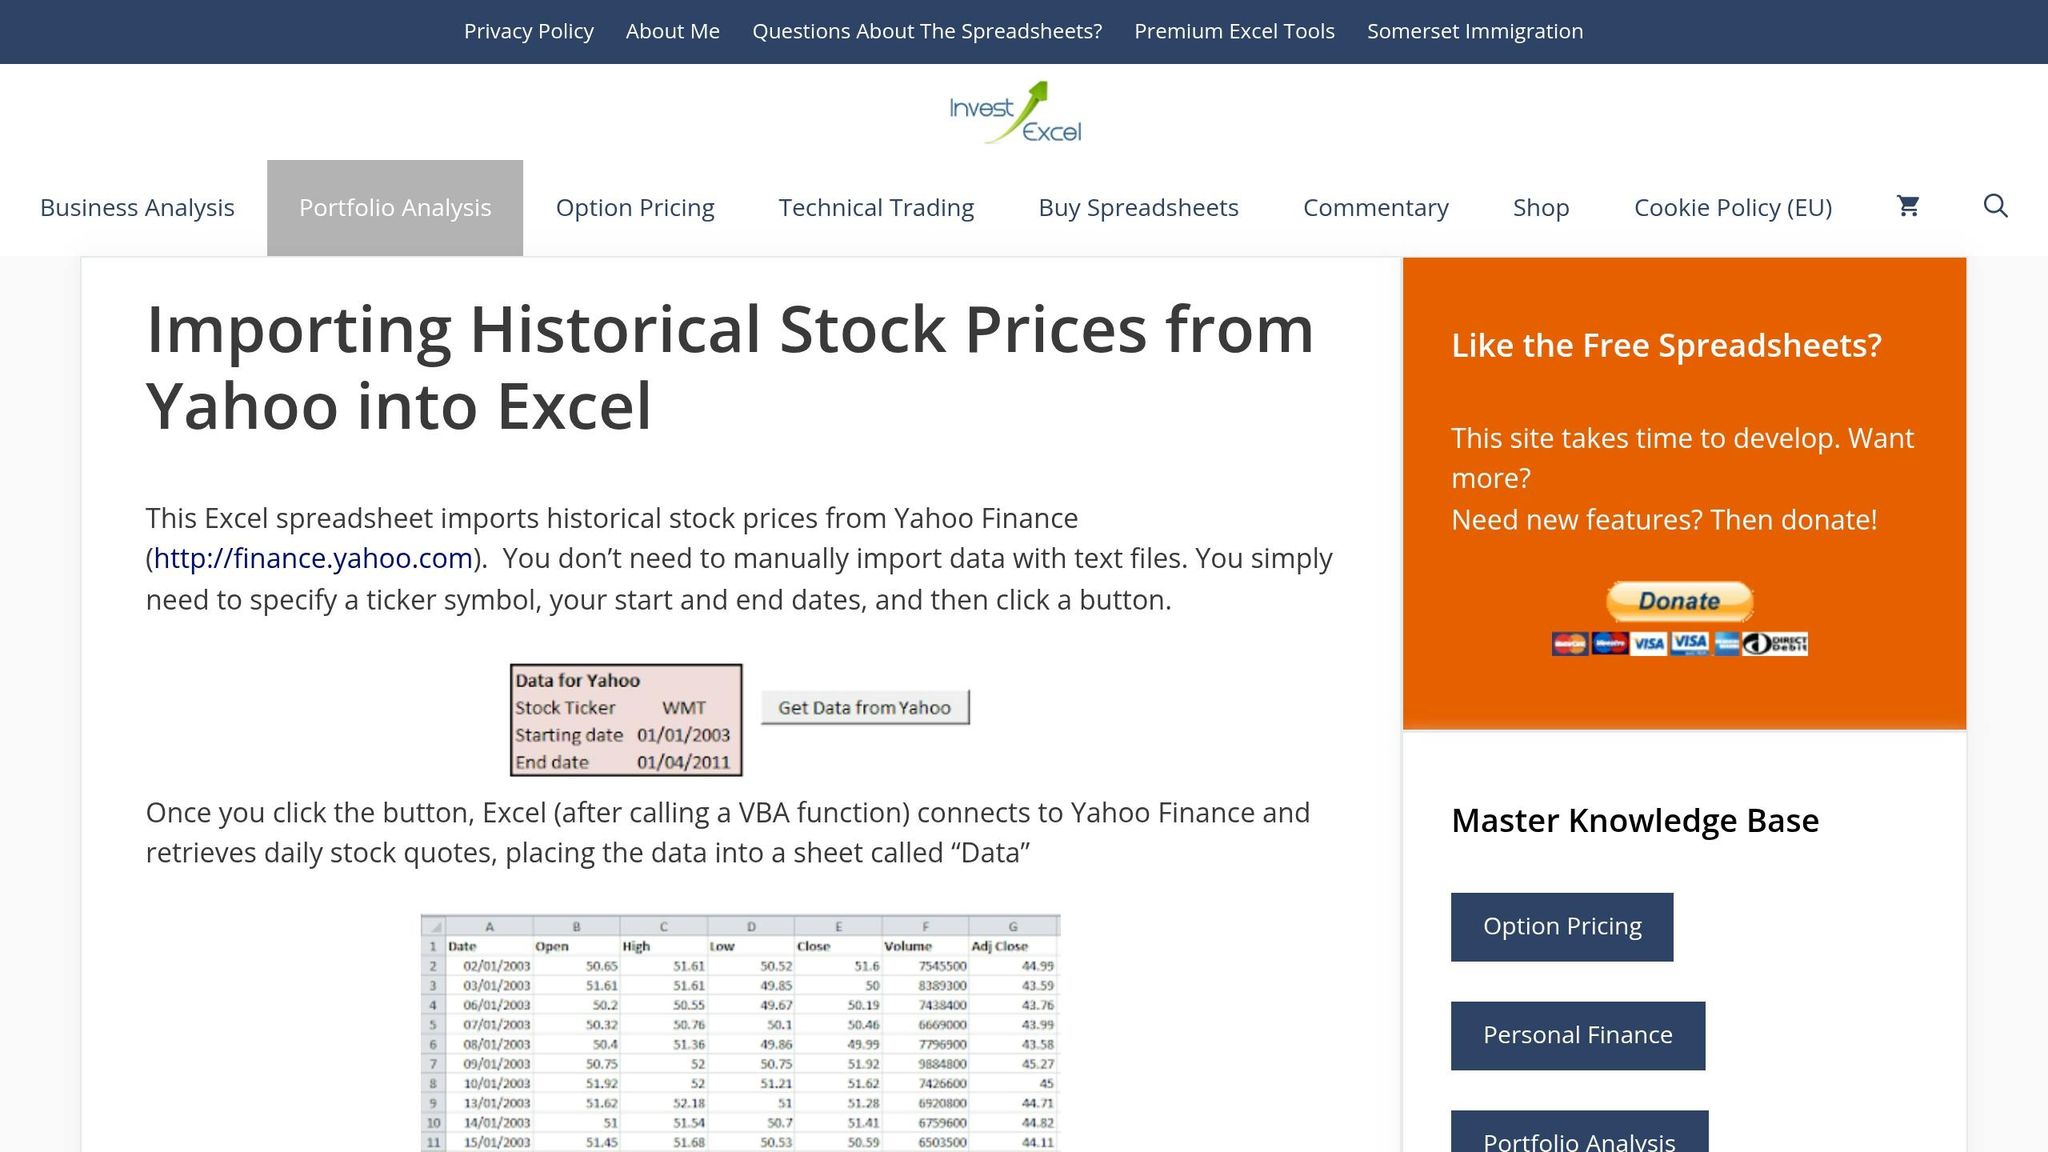
The InvestExcel tool simplifies beta analysis by automating data retrieval and offering two calculation methods. It pulls beta data directly from Yahoo Finance, allowing users to set custom date ranges and choose benchmarks. This Excel template calculates beta for any stock against any benchmark, replicating Yahoo Finance's "close price" beta while giving users full control over parameters. Note: This template requires macros and isn't compatible with Open Office or Excel Online.
Users can compute beta using either the Covariance/Variance method or the SLOPE function. Both methods produce the same results but cater to different analytical needs.
"Just enter a stock ticker whose beta you want, a benchmark ticker, and two dates. After you click the prominently-placed button, the tool grabs the historical market data from Yahoo Finance and calculates beta." - InvestExcel
The template uses specific Excel functions to calculate beta based on daily returns derived from adjusted prices. Here's how each function contributes:
| Function | Role in Beta Calculation | Formula Example |
|---|---|---|
| COVARIANCE.P | Measures the covariance between stock and market returns | =COVARIANCE.P(Stock_Returns, Index_Returns) |
| VAR.P | Determines the variance of benchmark returns | =VAR.P(Index_Returns) |
| SLOPE | Calculates beta directly by finding the regression line slope | =SLOPE(Stock_Returns, Index_Returns) |
For presentations or audits, the Covariance/Variance method provides transparency by breaking down the calculations. This level of detail is often required when preparing reports for fractional CFO services that oversee strategic financial planning. The SLOPE function, however, offers a quick, one-cell solution. Keep in mind that COVARIANCE.P is available from Excel 2010 onward; Excel 2007 users must use the older COVAR function instead.
Once the Excel functions are understood, the next step is importing and processing historical data. The template includes a macro-enabled button for automated data import. Simply input the stock ticker, benchmark ticker (e.g., ^GSPC for the S&P 500), and desired date range. Click the button to download the data and calculate beta.
If automation fails, you can manually download historical data from Yahoo Finance. Use the "Adj Close" column, which accounts for dividends and stock splits. Calculate daily returns with this formula:
(Today's Price - Yesterday's Price) / Yesterday's Price.
Then, use either the SLOPE function or the combination of COVARIANCE.P and VAR.P to compute beta.
Important Note: Always use the caret prefix (e.g., ^NDX for NASDAQ 100) for benchmark tickers, and ensure date ranges match exactly to avoid errors in calculations.

The Eloquens Beta Calculator Excel Model provides a way to analyze stock volatility over the long term. By using up to 5 years of monthly data, this model smooths out short-term fluctuations, offering a more stable and statistically reliable beta estimate.
This tool allows you to compare multiple stocks against a single benchmark. To get started, you'll need historical "Adjusted Close" prices, which can be sourced from platforms like Yahoo Finance or Google Finance.
Make sure to align all stock and index data by date within the same spreadsheet. When comparing multiple stocks, use the same 5-year lookback period and benchmark index (such as the S&P 500) to ensure consistent and meaningful comparisons. It's also crucial that the benchmark is in the same currency as your stocks to avoid distortions caused by currency fluctuations.
Once your data is properly aligned and formatted, you can use the model's built-in functions to calculate beta.
The template offers two methods to calculate beta: Excel's SLOPE function or the covariance/variance approach. After calculating beta, use the RSQ function to assess reliability. An R-squared value above 0.7 indicates strong market predictability.
To interpret the results, remember:

Excel Beta Calculation Templates Comparison: Features and Best Use Cases
This section outlines how various Excel templates cater to different analytical needs, making it easier to choose the right one for your specific goals. Each template aligns with distinct skill levels and objectives, offering tailored solutions for beta analysis.
The Corporate Finance Institute (CFI) template is the most straightforward option. It uses weekly price data and Excel's SLOPE function, making it ideal for professionals who need quick and simple calculations [6]. On the other hand, the 365 Financial Analyst template takes a more detailed, academic approach. By calculating the covariance of stock and market returns divided by market variance, it’s a great fit for CFA Level 1 candidates or students aiming to grasp the mathematical concepts behind beta [2].
For investors who want more control over their data, InvestExcel is a solid choice. It automates data imports from sources like Yahoo Finance and uses Excel functions such as COVARIANCE.P and VAR.P to perform calculations [3][1]. This makes it a good option for those who prefer customizing benchmarks, including international ones. Lastly, the Eloquens template is the most advanced. It includes professional-grade models for levered and unlevered beta calculations, making it particularly useful for M&A professionals and valuation analysts [5].
While all four templates are budget-friendly, they vary in complexity and data requirements. For instance, CFI and 365 Financial Analyst rely on manual data entry, whereas InvestExcel allows for custom benchmarks. Eloquens, however, requires the most detailed data, including tax rates, debt, and equity values for capital structure adjustments [5].
| Template | Ease of Use | Key Formulas | Data Period | Best For |
|---|---|---|---|---|
| Corporate Finance Institute | Easy | SLOPE | Weekly (flexible) | Quick, straightforward calculations [6] |
| 365 Financial Analyst | Moderate | Covariance/Variance | Daily or Weekly | Academic learning, CFA students [2] |
| InvestExcel | Easy | COVARIANCE.P, VAR.P | Historical returns | Investors needing custom benchmarks [3][1] |
| Eloquens | Moderate | Regression, Levered/Unlevered | 5 years (monthly) | M&A and valuation professionals [5] |
When choosing a template, consider your experience level and the type of analysis you’re conducting. Beginners might find CFI or InvestExcel easier to use, while advanced users handling complex financial models will benefit from Eloquens. This breakdown helps you pick the right tool for efficient and precise beta analysis.
Excel templates make beta analysis faster, easier, and more accurate by handling complex calculations in seconds. What might take 45 minutes manually can be completed almost instantly, with the added benefit of minimizing errors - since even one misaligned cell can throw off your beta results significantly [3]. Templates with audited formulas ensure precision and consistency, which is crucial for reliable financial analysis.
The right template can also cater to your specific needs. For quick and straightforward results, students and professionals might turn to templates from the Corporate Finance Institute or InvestExcel. CFA candidates will find the 365 Financial Analyst template valuable for its step-by-step breakdown of covariance and variance formulas. Meanwhile, M&A professionals may prefer the Eloquens template, which offers advanced tools for calculating both levered and unlevered beta.
Beyond templates, the quality of your data plays a major role in accurate beta analysis. Always rely on adjusted closing prices to account for dividends and stock splits [4]. Additionally, make sure the benchmark index matches the currency and market of the stock you're analyzing. To achieve reliable results, use a return history spanning at least 24 to 36 months [5].
Ultimately, selecting the right template depends on your priorities - whether it's speed, educational insights, or professional-grade functionality. Each template mentioned provides a trustworthy approach to beta calculation, with download links and detailed instructions outlined earlier in this guide. This eliminates the guesswork and reduces the risk of errors that come with building spreadsheets from scratch.
When calculating beta, it's standard to use Close prices, as this aligns with most commonly accepted methods. However, if a particular analysis specifies the use of Adjusted Close prices, make sure to follow that recommendation instead.
The most dependable beta calculation usually relies on a lookback period of 2 to 3 years combined with a monthly return frequency. This method strikes a balance by including sufficient historical data while reducing the influence of short-term market fluctuations.
Beta, even when calculated accurately, can sometimes be unreliable. This is because factors like the time period used for analysis, fluctuating market conditions, or the specific calculation method can distort results. These variables might fail to reflect the stock's actual systematic risk, resulting in inconsistencies.