Published on
April 3, 2026

IRR (Internal Rate of Return) and ROI (Return on Investment) are essential metrics for evaluating real estate projects. Here's what you need to know:
Both metrics work best together, offering a complete view of profitability and return timing. For instance, a project with a 13.8% IRR and 70.6% ROI over five years might meet some investors’ goals but fall short of others’ hurdle rates.
Quick Example: A $15M redevelopment project generates $21.35M in five years. Its ROI is 70.6%, while its IRR is 13.8%, reflecting annualized returns.
Want deeper insights? Combine these metrics with Equity Multiple and stress-test variables like exit cap rates, cost overruns, or market shifts for more reliable projections.
In real estate, calculating ROI involves breaking down both costs and revenues to get a clear picture of profitability.
Cost components cover a wide range of expenses, including the purchase price, stamp duty, legal fees, construction costs, renovations, repairs, and financing costs like down payments and mortgage interest. Selling-related expenses - such as appraisal fees, advertising, and agent commissions - also play a part. Don’t forget recurring costs like taxes, insurance, and utilities, which are often overlooked [11].
There are two main ways to calculate ROI: the Cost Method and the Out-of-Pocket Method. These approaches can yield very different results. For instance, if you buy a property for $100,000, spend $50,000 on improvements, and sell it for $200,000, the Cost Method gives you a 33% ROI. But if your cash investment was only $70,000 (e.g., a $20,000 down payment), the Out-of-Pocket Method shows a 71% ROI because it focuses on the cash you directly invested rather than the total cost [9].
Revenue components include capital gains (sale price minus adjusted costs) and net rental income. A good rule of thumb is that 50% of rental income typically goes toward operating expenses, while professional management fees usually run between 8%–10% of the rent [11] [12].
By understanding these elements, you can compare ROI benchmarks across different types of real estate projects.
Once you’ve calculated ROI, the next step is to interpret what the numbers mean for your commercial real estate investment. ROI measures profitability as a percentage of growth over the project’s duration [4]. For stable, low-risk properties, a cash-on-cash return of 8% to 12% is generally considered solid [10]. However, riskier ventures, like new developments or extensive renovations, often aim for a higher ROI - typically 15% to 20% or more - to justify the added uncertainty [10]. Some investors use the S&P 500’s historical average annual return of around 10% as a benchmark for comparison [9].
"A great investment is born from great analysis. A commercial property ROI calculator doesn't make the decision for you, but it provides the critical intelligence needed to make the right decision." – Sherer Architects [10]
To interpret ROI effectively, start with Net Operating Income (NOI), which reflects the property’s cash-generating ability without factoring in financing or taxes [10]. The Capitalization Rate (calculated as NOI divided by the purchase price) helps compare similar properties within the same market. When assessing ROI, it’s important to include a 5%–10% vacancy allowance and set aside 1%–2% of the property’s value annually for maintenance [10]. For renovation projects, a contingency fund of 10%–15% should be part of your budget to account for unexpected costs [10].
In 2024, industrial properties stood out, delivering an average ROI of 9.5% - the only commercial sector to post positive returns that year [9].
Regularly updating your ROI calculations is critical. Reassess at least once a year or after major changes, such as signing a long-term lease or refinancing. This ensures your projections stay aligned with the ever-changing market. The accuracy of your inputs directly impacts the reliability of your ROI analysis [10].
To calculate IRR for a real estate project, you need three key cash flow components: the initial investment (entered as a negative number), annual operating cash flows during the holding period, and the exit proceeds from the sale. IRR represents the annualized rate that sets the net present value (NPV) of these cash flows to zero [14].
Start by identifying the Year 0 investment, which includes the purchase price, closing costs (typically 2%–5%), and any immediate rehab or development expenses. For subsequent years, calculate cash flows by subtracting debt service from the net operating income (NOI). In the final year, calculate the exit proceeds by applying an exit cap rate to the projected NOI, then subtract the remaining mortgage balance and selling expenses.
The simplest way to compute IRR is by using the =IRR() function in Excel or Google Sheets. Enter all cash flows in chronological order, starting with the initial negative investment.
"By finding the specific discount rate that brings the net present value (NPV) of all future cash flows to zero, IRR reveals the true, time-adjusted return on every single dollar you put into the deal." – Property Scout 360 Team [14]
It's important to stress-test your assumptions by tweaking variables like vacancy rates, renovation budgets, or exit cap rates. Adding a Capital Expenditures (CapEx) line item for major replacements, such as roofs or HVAC systems, can also prevent overestimating your returns [14].
Once you’ve calculated the IRR, you can use it to guide strategic decisions for your development project.
IRR offers a detailed perspective on a project's viability by factoring in both the timing and scale of returns. In commercial real estate, understanding IRR is crucial for aligning project outcomes with investment goals.
Unlike static metrics, IRR accounts for the time value of money, highlighting that money received earlier is more valuable. This makes it a powerful tool for evaluating the full investment lifecycle, from initial cash outflows to eventual sale proceeds [2]. For context, benchmark IRR ranges can help assess project feasibility:
As an example, leveraged single-family rentals in the U.S. have historically delivered an average IRR of approximately 11.7% over the past two decades [14].
Developers can also use IRR to determine the best exit timing by comparing projected IRRs across different holding periods [2]. However, keep in mind that IRR assumes interim cash flows are reinvested at the same rate, which may not always be realistic - especially for high-return projects. Frank Gallinelli, Founder of RealData, emphasizes this point:
"Money received earlier is more valuable due to the time value of money. This is why IRR is so insightful. It not only answers how much, but when." – Frank Gallinelli, Founder, RealData [2]
While IRR is a valuable metric, it shouldn’t be used in isolation. Pair it with other measures like Cash-on-Cash returns or cap rate analysis to get a well-rounded view of a project’s financial potential. Setting a minimum acceptable IRR, or hurdle rate, before analyzing deals ensures that the expected returns justify the investment risks [14].

IRR vs ROI: Key Differences for Real Estate Investment Analysis
Let’s break down the differences between IRR and ROI to understand how each plays a unique role in evaluating project profitability.
Both metrics focus on profitability but approach it differently. ROI measures overall growth without factoring in the timing of cash flows, while IRR accounts for the time value of money - acknowledging that money today is worth more than the same amount in the future [4].
This distinction becomes especially important for long-term projects. Take an example: an 80% ROI might seem impressive at first glance. But if it takes 35 years to achieve, the annualized return is much lower than it appears - something IRR would highlight immediately [4].
| Feature | ROI (Return on Investment) | IRR (Internal Rate of Return) |
|---|---|---|
| Core Definition | Measures total percentage growth over a set period [4] | Annualized compound rate that makes NPV equal to zero [1] |
| Time Value of Money | Ignores the timing of cash flows [4] | Discounts future cash flows to their present value [5] |
| Calculation Complexity | Simple: (Current Value - Original Cost) / Original Cost [4] | Complex: Requires iterative solving or financial software [4] |
| Best Use Case | Quick evaluations and short-term investments [4] | Long-term projects with uneven cash flows [1] |
| Primary Limitation | Can mislead for long-term projects [4] | Assumes reinvestment of interim cash flows at a constant rate [2] |
Consider a 2026 analysis by JPMorgan comparing two properties, each requiring a $1,000,000 investment and returning $1,200,000 in Year 5. Property A provided $50,000 annually starting in Year 1, resulting in a 7.58% IRR. Property B, on the other hand, produced no cash flow for the first two years but generated $100,000 annually in the remaining years, leading to a lower IRR of 7.3%. The difference? The timing of cash inflows [1].
These nuances are critical for determining which metric to use in specific scenarios.
Knowing when to use IRR or ROI can make all the difference in evaluating commercial projects.
ROI is ideal for quick assessments, particularly for short-term investments lasting less than a year. On the other hand, IRR shines in evaluating projects with varying cash flow patterns or longer holding periods. For example, many developers apply the "50% Rule" (assuming expenses equal half the rental income) to quickly filter out overpriced properties [15].
IRR is especially valuable for development projects with uneven cash flows, such as those involving significant upfront costs for construction followed by a stabilization period. It’s also the preferred metric for determining the optimal exit strategy by forecasting returns across different potential sale years [2].
"You can't eat IRR" [5].
This quote highlights a key limitation: a high IRR doesn’t always guarantee substantial profits. For example, a small project with a high IRR might generate less total profit than a larger project with a lower IRR. That’s why savvy developers often start with ROI for initial screening and later evaluate IRR alongside the Equity Multiple, which provides insights into both return rates and absolute profits [8].
The speed at which Net Operating Income (NOI) stabilizes plays a big role in shaping IRR and ROI. In real estate development, IRR often follows a "J-curve" trajectory - it starts negative during the construction phase and only turns positive once the initial capital investment, along with its time value, has been fully recovered [5]. Refinancing at the point of stabilization can significantly accelerate equity returns, thereby increasing the annualized IRR [16]. On the flip side, a slower-than-expected lease-up period can negatively impact IRR [16][8].
Many financial projections assume full occupancy, but in reality, the average occupancy rate for residential properties across the U.S. hovers around 90% [7]. Adjusting cash flow models to account for a 5%–10% vacancy rate provides more accurate estimates for both IRR and ROI [7].
With cash flow covered, let’s look at how cost control and schedule management shape returns.
Keeping costs under control and sticking to the schedule are just as important as cash flow timing. Cost overruns - whether due to labor shortages or rising material prices - can eat into profit margins. To mitigate this, developers often include a contingency of 5%–10% for both hard and soft costs [13].
Delays are another factor that can erode annualized IRR. Even if the total profit remains unchanged, setbacks in construction timelines or delays in securing the certificate of occupancy push cash inflows further out, lowering the annualized return [16]. For example, in cities like Los Angeles, the permitting and entitlement process alone can stretch over 12 to 18 months, adding financing burdens and delaying revenue generation [13].
"When ROI depends on hitting a schedule, time saved in permitting can equal real profit."
The timing of the project’s exit and prevailing market conditions at that moment are often the biggest determinants of IRR. Residual value at the time of sale typically makes up the largest portion of returns in a development project [16]. Factors like cap rate fluctuations and interest rate changes have a direct impact on final returns. Additionally, absorption rates - the pace at which units lease or sell - affect both the refinancing timeline and the exit strategy by influencing when NOI stabilizes [16][13].
Stress-testing projects under different scenarios, such as a 5% drop in rents or a 10% rise in costs, can reveal whether the project remains viable under less favorable conditions [13].
"The development holding period can have a tremendous effect on project returns."
- Ike Hoffman, Owner, Tactica RES [16]
Together, these exit dynamics, along with earlier cash flow and cost considerations, form the complete picture for assessing development returns.
Imagine you're tackling a redevelopment project for an older office building. You purchase the property for $10,000,000 and plan to invest another $5,000,000 in renovations, bringing your total initial investment in Year 0 to $15,000,000. The plan? Hold onto the property for five years, lease it out, stabilize operations, and eventually sell it for an estimated $20,000,000.
Here’s how the cash flow looks during the hold period:
At the end of Year 5, you sell the property for $20,000,000. Adding that year’s NOI, the final cash inflow totals $21,350,000. This example highlights how the timing of cash flows and ultimate sale price influence the IRR and ROI of a real estate project.
To calculate ROI, you sum up all cash inflows over five years ($25,600,000) and subtract the initial investment ($15,000,000). This gives you a net profit of $10,600,000, resulting in a 70.6% ROI over the period, or about 14.1% per year.
For IRR, you can use Excel’s =IRR() function. Input the cash flow series [-$15,000,000, $500,000, $1,200,000, $1,250,000, $1,300,000, $21,350,000], and the result is approximately 13.8%. This figure reflects the annualized return, heavily influenced by the sale proceeds at the end of Year 5.
"IRR calculates how high the discount rate would have to be for the present value of all cash flows from the property to be equivalent to the cost of investing."
If your hurdle rate - the minimum acceptable return for this type of project - is between 15% and 20%, this deal might not meet your expectations. ROI and IRR are essential tools for evaluating whether a project aligns with your financial goals.
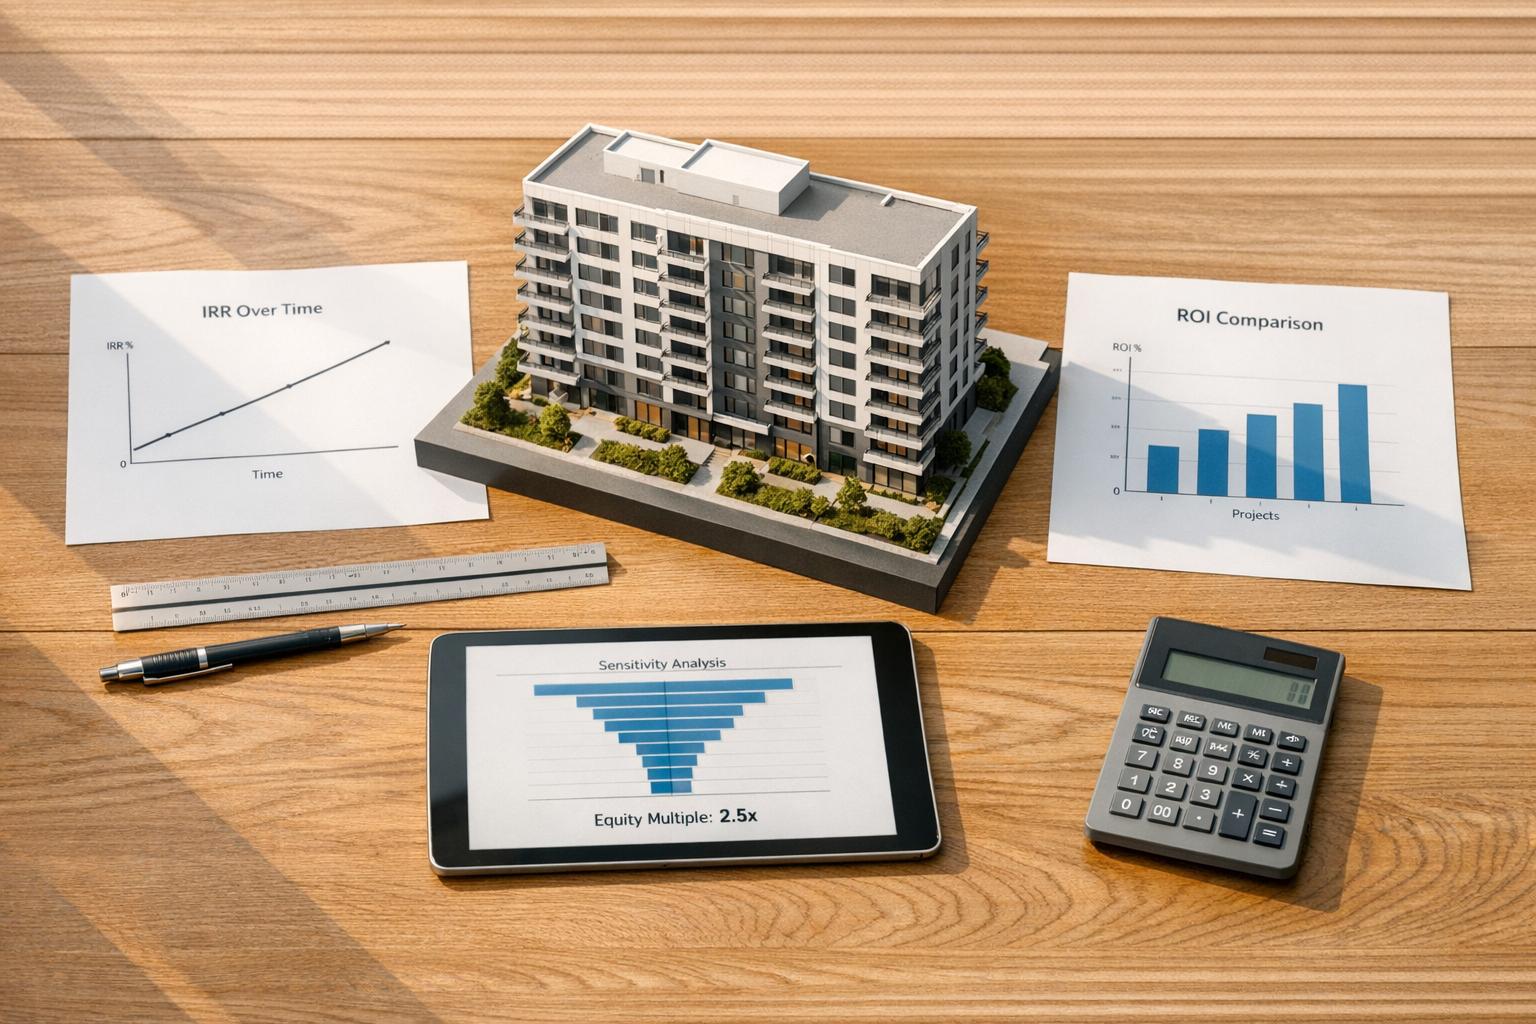
Building on IRR and ROI, the equity multiple gives a clearer picture of total profit. When paired with sensitivity analysis, it helps investors better understand both risk and return.
The equity multiple shows how much you earn for every dollar invested. It’s calculated by dividing total cash distributions by total equity invested. For example, if you invest $1,750,000 and receive $3,500,000 in return, your equity multiple is 2.0x - you’ve doubled your money.
Here’s how it compares to IRR: IRR measures the speed of returns, while equity multiple measures the overall profit. As Property Scout 360 explains:
"Equity Multiple is about how much profit, IRR is about how fast you earn it, and Cash-on-Cash is about how much you're earning right now" [17].
Let’s break this down further. Take two investments with a 2.0x equity multiple. If Investment A returns your capital in three years, the IRR is about 26%. If Investment B takes eight years, the IRR drops to 9% [18]. While both yield the same total profit, the efficiency of the returns is vastly different.
This is why both metrics matter. A high IRR can be deceptive if the total profit is minimal. Different types of real estate projects also come with varying equity multiple benchmarks:
For example, REEP Equity has achieved an average equity multiple of 2.04x as of February 2026. One of their value-add deals even returned 104% of the original investment through a mid-hold refinance before selling the property [17].
To refine these insights further, sensitivity analysis comes into play, helping to evaluate how changes in assumptions influence returns.
Sensitivity analysis helps you test how shifts in key variables affect metrics like IRR and equity multiple. It’s about asking, What happens if the market slows down? What if construction delays occur? What if interest rates climb?
To start, build sensitivity tables in Excel to explore different scenarios. One critical variable to analyze is the exit cap rate. For instance, on a $5,000,000 asset with $1,750,000 in equity, a $500,000 change in exit proceeds could shift the IRR by 100 to 200 basis points [18]. Other variables to test include:
A March 2025 analysis by Coldwell Banker Horizon Realty showed how a single percentage point increase in interest rates (from 5% to 6%) reduced ROI on a $1,000,000 multifamily property from 15% to 11% [19].
To keep projections realistic, establish three scenarios: Base Case, Optimistic, and Pessimistic. Use Excel’s Data Tables or Scenario Manager to run these models. Also, update your exit valuation assumptions regularly - at least annually or when significant market changes occur. As RIOO cautions:
"The exit valuation assumption is typically set at acquisition and updated infrequently... a stale exit assumption produces an IRR that reflects the original underwriting thesis rather than the current asset reality" [18].
This disciplined approach ensures your projections align with current market conditions, avoiding outdated or overly optimistic assumptions.
Begin by defining a hurdle rate, which is the minimum return you’re willing to accept compared to other investment opportunities. As JPMorgan Chase explains:
"Assessing whether a potential investment's IRR exceeds the hurdle rate is one factor that can help an investor decide whether it's worth pursuing" [1].
Your targets should align with the level of risk involved. For example:
When it comes to ROI, a 7% average is often seen as profitable, though the exact figure depends on the project type [4].
To get a more comprehensive view, pair IRR and ROI with metrics like the equity multiple, which combines return speed with total profit. As Zack Otte and Zach Brown from Plante Moran explain:
"The appropriate IRR, or 'discount rate,' for each project will depend on the project and each investor's risk tolerance" [5].
Your target-setting should consider the entire project lifecycle - initial costs, operating cash flows, and proceeds from the sale. A useful guideline is the 1% rule, which suggests monthly rent should equal at least 1% of total purchase and repair costs [21].
Refining these targets often requires sophisticated tools and expert input, which are discussed below.
Once you’ve established your targets, the next step is to leverage financial tools that can account for current market conditions and project specifics.
Calculating IRR manually can be tricky. Instead, use tools like:
Sensitivity analysis is especially valuable - it allows you to see how changes in assumptions impact returns. For instance, increasing the vacancy rate from 5% to 8% might lower IRR from 14.5% to 12.8%, while a 0.5% rise in exit cap rates could drop IRR to 10.5% [14].
Expert advisors can also play a critical role in validating your inputs and ensuring your assumptions - like vacancy rates, exit cap rates, and repair costs - are accurate [5][14]. For example, Phoenix Strategy Group (https://phoenixstrategy.group) provides FP&A support and cash flow forecasting to help developers align financial models with their strategic goals.
To avoid overstating returns, consider using MIRR instead of standard IRR [4]. And always set your hurdle rate with passive alternatives in mind - if index funds yield 10%, your real estate project should aim higher to justify the additional effort and risk [1][6][14]. Don’t forget to factor in capital expenditures like roof or HVAC replacements, which are often left out of basic ROI calculations [14].
Finally, keep your models updated with actual cash flows. This helps guide decisions on whether to hold, sell, or reinvest in the property [20].
The analysis above highlights how key metrics like IRR and ROI come together to shape smart decision-making in real estate development. These tools offer a comprehensive view of investments, from the initial costs to the final returns.
IRR stands out for its ability to measure both the size and timing of returns. This makes it easier for developers to evaluate different opportunities - like comparing a stabilized apartment building to a ground-up project - on equal terms. It helps pinpoint which option delivers the best balance of risk, return, and timeline [1] [6].
But relying on just one metric can be misleading. For example, while IRR focuses on efficiency, it doesn’t show the total profit in dollar terms - that’s where the Equity Multiple comes into play. Similarly, ROI offers a quick snapshot of profitability but overlooks the timing of cash flows. The most experienced developers use these metrics together, setting realistic benchmarks (like aiming for a 12–15% IRR on value-add projects) and running sensitivity analyses to understand how factors like exit cap rates or construction delays might impact outcomes [15].
As seen in the calculations and examples above, pairing these metrics with advanced tools and expert guidance - such as the FP&A and cash flow forecasting services offered by Phoenix Strategy Group (https://phoenixstrategy.group) - can help developers refine their financial models, test assumptions, and align their strategies with market realities. This kind of integrated approach ensures that investment decisions are both data-driven and adaptable, preparing projects to perform well, even in shifting market conditions.
A solid IRR for a real estate project often depends on the type of investment and the level of risk involved. For commercial real estate, an IRR in the range of 12% to 20% is typically seen as favorable. However, it’s crucial to assess this within the context of your specific project and the current market environment.
Leverage and financing can increase IRR by amplifying returns through the use of borrowed capital. At the same time, they can decrease ROI if the cost of debt exceeds the gains achieved. This happens because leverage affects both the timing and magnitude of cash flows, which are key factors in calculating IRR and ROI.
When dealing with irregular cash flows or situations where a more precise measure of profitability is needed, XIRR or MIRR can be better options than IRR. These methods take into account factors like the timing of cash flows or reinvestment rates, providing a more accurate picture of your investment's performance in more complex scenarios.