Published on
January 7, 2026

Want to improve your conversion rates and reduce acquisition costs? Start by analyzing performance at the segment level. Here's why: Companies that break down their data into specific customer groups uncover actionable insights, like a 25% reduction in Customer Acquisition Costs (CAC) by reallocating resources to high-performing segments.
Key Takeaways:
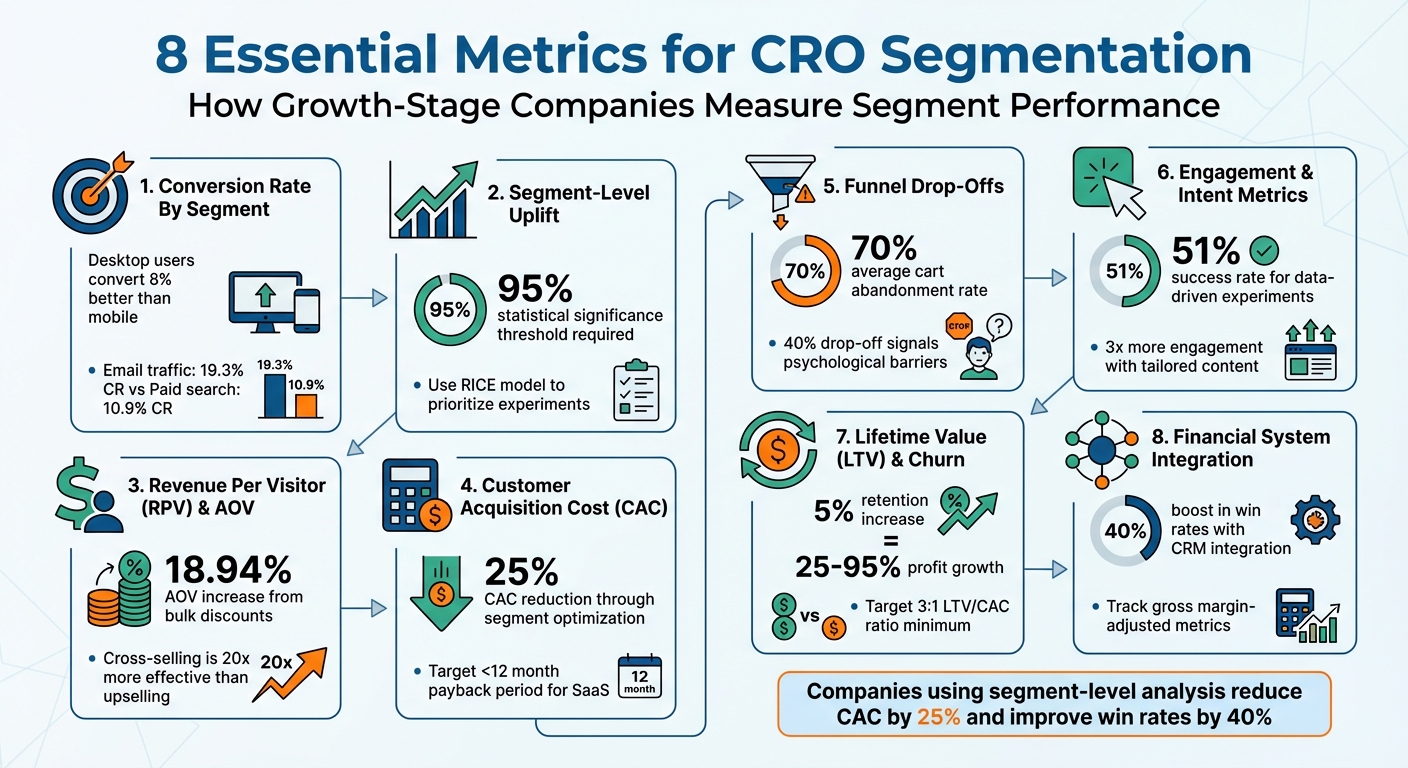
8 Essential CRO Segmentation Metrics for Growth-Stage Companies
Before diving into metrics, it's crucial to create a segmentation framework that defines what you'll measure and how you'll collect the data. A good starting point is mapping out a conversion funnel - from Awareness to Interest to Action [9]. Each stage uncovers different friction points, and segmentation helps identify where specific audiences drop off. The next step is pinpointing the segmentation dimensions that reveal these drop-offs.
Key dimensions to focus on include traffic source (organic, paid, social, email), user behavior (new vs. returning visitors, logged-in vs. logged-out users), geography, and device type (mobile vs. desktop) [1][8][4]. For B2B companies, adding firmographic data - things like industry and company size - is especially important to align conversion rate optimization (CRO) efforts with sales cycles [2][3]. For instance, email traffic boasts a 19.3% conversion rate, compared to 12% for paid social and 10.9% for paid search. Similarly, desktop users convert 8% more often than mobile users [8].
To support this level of granularity, ensure your data infrastructure is up to the task. This means integrating tools like analytics platforms (e.g., GA4), CRM systems (e.g., Salesforce, HubSpot), and financial reporting tools that connect CRO metrics to critical business measures like Customer Acquisition Cost (CAC) and Lifetime Value (LTV) [2][4]. As Morgan Brown, VP of Growth at Shopify, puts it:
"You can't be great at growth without robust data infrastructure" [5].
Start by establishing baseline metrics for each segment. Capture the "as-is" performance - such as reach, win rates, or Average Contract Value - before launching any experiments [2]. Use funnel reports to identify leaks. For example, if 40% of social traffic drops off at the pricing page, you’ve pinpointed a specific issue [8]. Baseline data and micro-conversions (like newsletter sign-ups or PDF downloads) can highlight areas that need attention [8][9]. When prioritizing experiments, use a simple evaluation matrix: focus on tests with high potential impact and low implementation effort for quick wins [8].
This structured approach allows you to run targeted experiments and make precise optimizations, setting the stage for an effective CRO strategy. Once the framework is ready, you can dive into the metrics that directly influence conversion optimization by segment.
Segment conversion rates are a cornerstone of effective CRO. Instead of relying on a single, site-wide figure - like the 6.6% median conversion rate - it's far more insightful to break performance down by factors such as traffic source, device type, and user intent [8]. This detailed approach uncovers which groups are driving growth and which might be slowing progress. It’s a critical starting point for deeper, more targeted analyses.
Segmented conversion data reveals trends that overall numbers often hide. For example, while 83% of landing page visits may come from mobile devices, desktop users convert 8% better [8]. These gaps can point to specific issues, like slow mobile load times or clunky layouts, that need attention.
The value of segmentation becomes clear when differences between segments are statistically significant. As The Pedowitz Group explains:
"If segments perform almost identically, your model may be too noisy or superficial" [2].
A great example comes from a B2B technology company that simplified dozens of fragmented segments into four needs-based groups connected to their CRM. This change resulted in a 40% boost in opportunity-to-win rates and a 25% reduction in customer acquisition costs (CAC) by shifting spending away from underperforming segments [2].
Once you’ve segmented your audience, start by establishing baseline performance metrics for each group - such as reach, win rate, and average order value (AOV) - before running any tests [2]. With this data, you can build hypotheses for improvement. For instance, if 60% of visitors in a specific segment scroll past your form, moving it above the fold could significantly increase completions [8]. Focus your experiments on high-impact, low-effort changes for the segments that generate the most revenue [8]. This targeted strategy ensures you’re using your budget efficiently while laying the groundwork for more advanced CRO techniques.
Segment-specific conversion rates directly influence CAC and payback periods. Higher conversion rates in key segments reduce CAC and speed up payback [4]. For instance, if paid search converts at 10.9% compared to email’s 19.3%, you’re essentially paying nearly twice as much for each customer acquired through paid search [8]. By tracking conversions by segment, you can shift your budget toward the channels and audiences that deliver the best ROI. Phoenix Strategy Group often highlights this approach to help growth-stage companies align their marketing strategies with financial goals.
Looking at uplift at the segment level helps you figure out if your targeting strategy is genuinely making a difference or just adding unnecessary complexity. The main question here is: are your segments distinct enough to justify treating them differently? If two segments show similar results after an experiment, it’s time to revisit and refine your segmentation model [2].
Segment-level uplift separates a segment’s individual performance from the improvement it gains over a control group. This ensures that any gains are directly tied to your targeted efforts [2].
For example, a personalized onboarding flow might boost conversions among mobile users but have no effect on desktop users. Without segmentation, this kind of insight could easily get lost in aggregated data, making it harder to spot valuable opportunities [8].
Start by comparing segment performance against clear benchmarks - like reach, engagement, win rate, or average contract value (ACV) - before you run any tests [2]. Always include a control group to confirm that any observed uplift is due to your specific treatment and not just random chance. For Conversion Rate Optimization (CRO) experiments, a 95% statistical significance threshold is the standard. This means there’s only a 5% likelihood that the results happened by chance [12].
If a segment has low traffic, you can speed up data collection by testing the same hypothesis across multiple pages. Alternatively, focus on micro-conversions - like clicks on a call-to-action or visits to a pricing page - that are closely tied to final purchases [8][12]. For smaller segments, prioritize testing big changes (like a complete page redesign or a new value proposition) over minor adjustments, such as tweaking button colors [12].
The RICE scoring model (Reach × Impact × Confidence / Effort) is a helpful tool for prioritizing experiments that are most likely to deliver strong financial results. You can also use a segmentation performance scorecard to track both absolute performance and relative improvement across segments. This makes it easier to spot underperforming segments that might need to be merged or removed [2]. These focused experiments not only highlight segment differences but also align with your broader financial goals.
Segment-level uplift doesn’t just guide operational decisions - it plays a big role in shaping financial strategies. By narrowing in on what works, you can cut Customer Acquisition Costs (CAC) while driving revenue growth. This is especially important for growth-stage companies where every dollar matters.
Micro-conversion data often highlights early signs of customer intent, which directly supports key financial metrics like Annual Recurring Revenue (ARR) and Monthly Recurring Revenue (MRR) [8]. Knowing which segments respond best to specific strategies helps fine-tune everything - from sales territory planning to product development - so you can focus on what really drives growth [2]. At Phoenix Strategy Group (https://phoenixstrategy.group), we use these insights to help growth-stage businesses optimize their marketing and financial strategies, ensuring every investment contributes to sustainable growth.
Building on earlier discussions about conversion rates and performance improvements, segment-level Revenue Per Visitor (RPV) and Average Order Value (AOV) offer a deeper financial understanding of audience behavior. These two metrics work hand-in-hand: RPV is calculated by multiplying AOV with the conversion rate [13]. Together, they provide a more complete picture, capturing both how often people buy and how much they spend, rather than focusing solely on conversion rates.
Segment data can reveal which groups gravitate toward premium products and which lean toward budget options. For instance, a drop in RPV might signal an increase in low-intent visitors, while a lower AOV could mean your recommendation engine isn’t effectively showcasing the right products. A great example of this comes from Paperstone, which ran an A/B test on bulk discount deals. The result? An 18.94% increase in AOV and a 16.8% boost in total revenue [13]. By analyzing these metrics at the segment level rather than as a whole, businesses can uncover actionable insights that refine their conversion rate optimization (CRO) strategies.
To make the most of segment-level RPV and AOV, compare AOV to the Cost Per Order (including shipping and fulfillment) for each segment. This comparison helps pinpoint which segments are driving profits and which may be eating into margins. For example, setting free shipping thresholds slightly above the average AOV for a segment can encourage larger purchases without increasing the risk of cart abandonment [13].
For segments with high conversion rates but low AOV, consider testing upselling - offering premium versions of products - or cross-selling complementary items. Cross-selling, in particular, has been shown to be up to 20 times more effective than upselling, especially at checkout [13]. A case in point: BEAR, an American retailer, boosted its revenue by 16% by implementing cross-selling strategies [13].
"RPV involves both these dimensions [CR and AOV] leaving no blind spots."
– Shanaz Khan, Brand Marketer, VWO [13]
Tracking RPV ensures that growth in conversion rates and AOV translates into actual revenue increases. Focusing solely on conversion gains without considering AOV can hurt profit margins [14]. For companies in a growth phase, improving RPV at the segment level can lead to significant revenue gains without requiring a major increase in customer acquisition spending. For example, customers who have been with a brand for over 30 months spend 67% more per order than first-time buyers [5]. By reallocating marketing budgets away from low-performing segments and toward those with higher AOV and conversion rates, businesses can achieve better efficiency [2].
RPV and AOV go beyond just tracking performance; they directly tie into key financial goals like Annual Recurring Revenue (ARR) growth and gross margins. Companies like Phoenix Strategy Group align these metrics with broader financial objectives, ensuring that CRO efforts contribute to sustainable, long-term growth. For example, adjusting customer acquisition cost (CAC) payback to account for gross margins across different segments can provide a clearer picture of profitability [3].
Before launching any CRO experiments, it’s crucial to establish baseline metrics - current AOV, conversion rates, and RPV - so you can measure the true impact of your efforts [2]. These metrics not only validate your optimization strategies but also inform strategic decisions that drive financial success.
Once you've analyzed revenue and engagement, diving into Customer Acquisition Cost (CAC) can sharpen your cost-efficiency game. CAC measures the total sales and marketing expenses required to gain a new customer within a defined segment [5][15]. When broken down by segment, this metric helps pinpoint which audience groups are worth the investment in tailored CRO strategies and campaigns [2].
Take the example of a B2B tech company that categorized its customers into four need-based groups. By setting up a performance dashboard, they cut their overall CAC by 25% and boosted their opportunity-to-win rates by 40% in their most lucrative segments [2]. Segment-level analysis also flags when your segmentation model might be overly complex and in need of simplification [2].
The CAC Payback Period adds another layer of insight, showing how long it takes (in months of gross profit) to recoup the acquisition costs for a specific segment [15]. For high-growth SaaS companies, the sweet spot is usually a payback period under 12 months, as anything over 18 months can stretch cash reserves thin [15]. This metric is especially crucial for growth-stage companies, as it impacts how quickly they can reinvest capital [3].
To make the most of CAC data, tag campaigns with segment-specific details in your CRM. This allows you to track CAC performance on a scorecard, revealing which segments yield better digital ROI compared to generalized campaigns [2]. For segments with longer sales cycles - say, three months or more - you can fine-tune your efficiency calculations by aligning sales and marketing expenses with the cycle length [16]. Adjusting CAC payback to account for gross margins rather than just revenue ensures you're measuring actual cash contributions [15][3].
Keep an eye on trends over time. Efficiency might dip as a segment becomes saturated or as competition ramps up [16]. A high CAC might still be acceptable if the segment shows standout retention rates. On the flip side, a lower CAC doesn't mean much if churn is high before you recover your costs [16]. Separating CAC metrics for new customer acquisition versus upselling or expansion efforts also gives a clearer picture of efficiency [15].
Investors often look at the LTV/CAC ratio to assess a company’s health. Venture capital firms typically aim for at least a 3:1 ratio, while private equity buyers prefer it to be 5:1 or higher [15]. Alternatively, if you flip the ratio to CAC-to-LTV, a value below one indicates that you're generating more revenue from a customer than it costs to acquire them [17].
"Having great telemetry is a necessary condition for being a great growth team. You can't be great at growth without rock-solid data infrastructure."
– Morgan Brown, VP, Growth, Shopify [5]
With digital ad costs rising by 30%–50% over the past five years due to saturation and procurement challenges [15], segment-level tracking has never been more important. At Phoenix Strategy Group (https://phoenixstrategy.group), we integrate these insights into financial strategies for growth-stage companies, ensuring smarter resource allocation and healthier cash flow. Considering that retaining an existing customer is estimated to cost 5–25 times less than acquiring a new one [5], optimizing CAC at the segment level becomes a key lever for improving overall unit economics and driving sustainable growth.
Expanding on the segmentation framework, this metric zeroes in on how users move through your funnel and where they drop off. Funnel reports can pinpoint exactly where visitors disengage. For instance, if 40% of users leave between your pricing page and checkout, it might signal a psychological barrier or an unclear value proposition that needs attention [8]. These detailed insights are the starting point for analyzing micro-conversions.
Micro-conversions - such as signing up for a newsletter, adding items to a cart, or downloading a PDF - offer a glimpse into early buyer intent [8]. They can also highlight friction points in the sales process before they impact your primary conversion rates. For example, while the average shopping cart abandonment rate hovers around 70% across industries [5], breaking this data down by segment can uncover valuable trends. Mobile users might drop off due to technical glitches, while visitors from social media could be discouraged by pricing that doesn’t match their expectations [8].
To make the most of this metric, segment your funnel reports by traffic source, device type, and user intent. This approach helps identify hidden bottlenecks [8]. Create separate views for organic versus paid traffic, and focus on 3–5 key micro-conversions that align closely with your final sales goals [8]. Using an Impact/Effort matrix can help prioritize changes, starting with "High Impact/Low Effort" fixes that deliver measurable results quickly [8].
Pay special attention to form abandonment. High drop-off rates often stem from forms that are too long or lack clear guidance [6]. Additionally, complex language can hurt performance - data shows that high word complexity correlates with a 24.3% lower conversion rate [8]. Session recordings can also offer valuable insights; look for "rage clicks" (rapid, repeated clicks) that signal user frustration. Tailored content is another key factor: users are three times more likely to engage when the content speaks directly to their specific needs or segment [10].
Addressing funnel drop-offs directly impacts financial metrics like Customer Acquisition Cost (CAC) and Average Revenue Per Visitor. For example, fixing a 40% drop-off on your pricing page can significantly reduce CAC while boosting revenue [2][8]. For growth-stage companies, improving early funnel progression and activation rates can predict and prevent long-term churn, allowing you to intervene before losing customers [5].
Segment engagement and intent metrics can provide valuable insights into buyer readiness, building on what you learn from funnel drop-offs. These metrics help you distinguish between segments that are ready to make a purchase and those that are just browsing. For instance, metrics like time on page, scroll depth, and pages per session can reveal how interested a segment is in your content [6][18]. Take pricing pages as an example: if a segment spends several minutes reviewing this page, they’re likely closer to making a purchase than those who only glance at it for a few seconds. This level of engagement can guide specific, actionable changes to improve conversion rates.
Intent metrics dig even deeper. Comparing form starts to form completions can uncover points of friction in your conversion process [1][6]. For example, if mobile users are completing forms at a much lower rate than desktop users, there could be a technical or user experience issue at play. Similarly, analyzing cart behavior - like adding and removing items or abandoning carts - can help you differentiate serious buyers from casual visitors [1][5].
For companies in the growth stage, tracking micro-conversions - such as clicks on CTAs, newsletter signups, or video views - can offer quicker, actionable insights rather than waiting for full purchases to occur [12]. Tools like heatmaps and click maps show where different segments focus their attention, allowing you to strategically place CTAs based on actual user behavior instead of assumptions [1]. For example, if users frequently engage with content lower on the page before leaving, you might want to move your primary CTA to that section. On the other hand, if segments show high bounce rates, optimizing the content above the fold is critical to capturing their attention right away [1].
These metrics directly influence critical financial metrics like customer acquisition cost (CAC) and profit margins. By identifying high-intent segments - such as those visiting pricing pages, interacting with features, or starting forms - you can shift marketing resources away from lower-performing groups to those more likely to convert [2]. A B2B technology company, for instance, reduced its CAC by 25% by leveraging these insights [2]. Additionally, tracking activation rates, or how quickly a segment reaches its "aha moment", offers a strong indicator of long-term retention and lifetime value (LTV) [5]. Data-driven experiments, like those informed by heatmaps, have shown a 51% success rate compared to only 35% for decisions based on instinct alone [19].
Segment-level LTV measures the total revenue and profit generated by each customer group over time, highlighting which segments deserve more focus for retention efforts [5]. Breaking down LTV by segments - such as customer quartiles - uncovers patterns behind the success of top-performing groups [21]. It also sheds light on differences in purchase behavior, product preferences, and brand loyalty. This detailed view helps align conversion rate optimization (CRO) strategies with financial goals.
Analyzing churn at the segment level can reveal where retention strategies are falling short. For instance, if a high-LTV segment has a rising churn rate, it’s a signal to address potential pain points in their experience, whether during onboarding or elsewhere in their journey [15].
By combining segment analysis with LTV insights, you can refine both cost management and retention strategies. Use this data to define segment-specific Customer Acquisition Cost (CAC) targets: allocate more resources to high-value segments while being cautious with lower-performing ones. Aiming for an LTV-to-CAC ratio of at least 3:1 ensures sustainable growth [15].
Focus CRO efforts on moments that drive higher LTV, often referred to as "aha moments" - those initial actions or milestones that correlate with long-term success. Streamline your onboarding process to help high-value segments reach these milestones faster [5][20].
Keep an eye on churn signals like reduced purchase frequency or a drop in Average Order Value (AOV) to launch retention campaigns before issues escalate [15]. If segments show similar LTV and engagement metrics, it might indicate that your segmentation criteria need refinement [2]. Customize messaging and offers for top-priority segments, and track LTV improvements against a baseline to measure progress [2].
For companies in the growth stage, retention plays a crucial role in boosting enterprise value and improving capital efficiency. Even a small increase in retention - just 5% - can drive profit growth of 25% to 95% [15]. This is especially critical as customer acquisition costs have surged by 30% to 50% in recent years, making long-term customer relationships essential for achieving payback [15]. Companies with Net Revenue Retention (NRR) exceeding 120% often enjoy valuation multiples that are 50% to 100% higher than those with lower NRR [15].
"Raising customer retention by just five percentage points can lift profits 25–95 percent, primarily through higher lifetime revenue and lower servicing costs." – Bain & Company [15]
To calculate LTV accurately, factor in gross margin for a clearer picture of cash flow and profitability. Use this formula: (Average Revenue × Gross Margin %) ÷ Revenue Churn Rate [15]. This approach ensures growth efforts don’t erode margins. Additionally, track metrics like logo churn, Gross Revenue Retention (GRR), and NRR on a monthly, cohort basis to identify retention challenges and fine-tune CRO strategies accordingly.
Segment-level data helps uncover disparities that aggregated data can hide. By analyzing performance across distinct customer groups, you can identify significant gaps in engagement, conversion rates, and revenue. These insights guide you on where to allocate your budget more effectively [2]. The true advantage lies in pinpointing which segments deliver higher revenue and pipeline growth per dollar spent. This allows you to redirect resources from underperforming areas to those that yield better outcomes [2]. Such granular segmentation paves the way for smooth integration with financial systems.
For example, a B2B technology company streamlined its segments into four needs-based groups and linked these metrics to its financial systems. The payoff? A 40% boost in opportunity-to-win rates for its top-performing segments and a 25% reduction in CAC. This integration made it clear where resources should be reallocated [2]. Achieving this level of precision requires seamless data flow between CRO tools, CRM platforms, and financial systems.
Once segmentation data is in place, aligning it with financial goals becomes crucial for growth-stage companies. This connection enables tracking of key metrics like gross margin-adjusted CAC payback at the segment level, offering a clear picture of whether your performance measures up against competitors in your revenue range [3]. By integrating segment data with tools like Stripe and your CRM, you can monitor long-term financial indicators such as Revenue Per Visitor (RPV), Average Order Value (AOV), and Customer Lifetime Value (CLV) for each customer group [7][11].
"Having great telemetry is a necessary condition for being a great growth team. You can't be great at growth without rock-solid data infrastructure." – Morgan Brown, VP of Growth, Shopify [5]
The key is ensuring standardized calculations across all segments. Use consistent formulas for metrics like CAC payback, account for gross margins, and make sure comparisons are valid across different product lines or regions [3]. Create segment-specific scorecards that track engagement, funnel progression, and pipeline performance. Regularly review these dashboards during Quarterly Business Reviews (QBRs) to align sales, marketing, and finance teams on growth objectives [2].
To get started, configure your systems to capture the right data. Add fields like industry, intent, and value band into your CRM and marketing automation platforms (MAP). Automate tagging with first-party data and enrichment tools to ensure consistency [2].
Before running any segmented CRO tests, establish baseline metrics for each segment, such as win rates, Average Contract Value (ACV), and sales cycle duration. This baseline will help you measure the true impact of your optimizations [2]. Always compare segment-level CAC against CLV to confirm that acquisition costs remain both sustainable and profitable [7]. If your segments show similar performance metrics, it may be time to refine your segmentation criteria - effective segments should be distinct enough to justify tailored strategies [2].
Once your segmentation data is connected to your financial systems, the next logical move is to benchmark your segments against industry peers. Why? Because benchmarks provide the context you need to interpret your metrics. For example, is a 15% conversion rate for enterprise customers excellent, or does it signal an issue? Benchmarks help answer that.
For growth-stage companies, the most meaningful benchmarks are those segmented by factors like revenue size, go-to-market strategy, and product type [3]. Take this scenario: a $5 million SaaS company using a bottom-up approach will have very different efficiency metrics compared to a $50 million company relying on enterprise sales. Comparing metrics like CAC payback or win rates only works if you're measuring against companies with similar characteristics - otherwise, it's like comparing apples to oranges. This approach lays the groundwork for uncovering key insights about each segment's performance.
To figure out if a segment is underperforming, holding steady, or excelling, benchmark it against the 25th, 50th, 75th, and 90th percentiles within your peer group [3]. For instance, if your mid-market segment's CAC payback sits in the 75th percentile but your enterprise segment lags at the 25th, it's a clear signal to shift resources. A well-executed segmentation strategy should highlight these differences in customer outcomes.
Once you've established benchmarks, create a segmentation scorecard for executive reporting. This scorecard should track each segment's performance throughout its lifecycle - from initial engagement to long-term value [2]. Dashboards are key here, and they need to rely on standardized calculations (as discussed earlier) for metrics like gross margin-adjusted CAC payback. This consistency allows for valid comparisons across different product lines or regions [3]. As a16z Growth aptly puts it:
"In many cases, the trend is more important than the current data point" [3].
Your board will want to see not only where each segment stands today but also how it has evolved over the past four to six quarters. If all segments perform similarly across engagement and revenue metrics, it might be time to revisit and refine your segmentation model [2].
Finally, make it a habit to conduct quarterly reviews to evaluate and, if necessary, phase out underperforming segments. This ensures your segmentation model stays dynamic and focused on the segments that deliver the most profitable growth. Regular reviews also help align your segmentation strategy with broader CRO and financial goals.
After diving deep into conversion and financial metrics, it’s clear that segmentation is a powerful driver of growth. By focusing on metrics like conversion rates, uplift, revenue per visitor, customer acquisition cost, funnel drop-offs, engagement, and lifetime value - at the segment level - you can move from vague optimization efforts to actionable, data-driven strategies. This approach provides the clarity needed to make targeted decisions throughout your conversion funnel. Growth-stage companies that scale effectively know exactly which customer segments deserve investment - and which do not.
Here’s the way forward: start small, with 3–7 core segments that reflect distinct buying behaviors. Then, follow a structured measurement process. Define your hypotheses, set up proper tagging, benchmark your starting points, test specific strategies, measure the lift, and refine your focus over time. As Josh Gallant, Founder of Backstage SEO, wisely states:
"What gets measured gets managed" [1].
To take it a step further, automate segment tagging in your CRM and marketing automation tools. This lets you track revenue back to specific cohorts, ensuring your segmentation efforts are operational, not just theoretical. True growth engines rely on this discipline, not ad-hoc segmentation.
But segmentation isn’t just about creating static groups. If it doesn’t drive behavioral changes, it’s falling short. Your segment data should shape everything from territory planning and account-based marketing tiers to product strategies and quarterly business reviews. Use a segment performance scorecard to identify high-value groups that deliver more pipeline and revenue per dollar spent. At the same time, don’t hesitate to retire or merge segments that aren’t delivering unique value.
Finally, tying these insights into your financial strategy brings the process full circle. Successful companies connect segmentation metrics to financial outcomes, allocating resources with precision. At Phoenix Strategy Group, we view segmentation as a cornerstone of sustainable growth, seamlessly integrating it with financial systems. By building this infrastructure now, you ensure that every dollar you spend fuels growth.
Segmentation is a game-changer when it comes to lowering Customer Acquisition Costs (CAC). Instead of spreading your marketing budget thin across a broad audience, segmentation helps you zero in on the groups most likely to convert. By analyzing behavior, demographics, or purchase intent, you can craft personalized messages and offers that truly connect with your audience. The result? Higher conversion rates and shorter sales cycles.
When your conversion rates improve, you need fewer ad clicks or impressions to bring in a customer. This directly reduces your CAC since the formula is simple: total spend ÷ new customers. Segmentation also cuts down on wasted spending by identifying and avoiding low-performing channels. For growth-stage companies, this means you can focus your resources on strategies that deliver a better return on investment, boosting profitability.
Tracking metrics like CAC, conversion rates, and Customer Lifetime Value (CLV) before and after implementing segmentation gives you a clear picture of its impact. It’s a way to ensure your marketing dollars are working harder and smarter for sustainable growth.
If you’re looking to scale efficiently, Phoenix Strategy Group offers the expertise and tools to develop data-driven segmentation strategies tailored to your business needs.
To measure how well your CRO segmentation efforts are working, keep an eye on key metrics like conversion rate, click-through rate (CTR), and bounce rate. These numbers can tell you how effectively different segments are responding to your content or offers.
You might also want to track metrics such as average time on page, pages per session, and form or cart abandonment rates. These can highlight where users might be running into issues or losing interest during their journey. For a closer look at revenue impact, focus on average order value (AOV), revenue per visitor, and customer lifetime value (CLV). Additionally, studying funnel-stage conversion rates can uncover how well each segment moves through your sales process.
By consistently analyzing and tweaking these metrics, companies in growth mode can fine-tune their strategies to drive more conversions and boost overall results.
Segment-level metrics like conversion rates, Customer Lifetime Value (LTV), Customer Acquisition Cost (CAC), and average revenue per visitor are game-changers for growth-stage companies. They provide a clear picture of which customer groups deliver the highest returns and help businesses allocate resources more effectively. By breaking these metrics down by demographics, marketing channels, or product lines, companies can fine-tune their revenue forecasts, target their marketing to top-performing segments, and set budgets that align with actual performance.
Here’s an example: Imagine Segment A boasts a 4.5% conversion rate, an LTV of $3,200, and a CAC of $150. With these numbers, finance teams can confidently channel more investment into this segment to boost profitability. On the flip side, segments that underperform can either be restructured or deprioritized altogether. This kind of analysis doesn’t just optimize resource spending - it also strengthens financial planning and creates a compelling case for fundraising or mergers and acquisitions by showcasing sustainable growth patterns.
Phoenix Strategy Group leverages this data-driven strategy to help growth-stage companies focus their financial efforts on their most profitable customer segments. The result? Every dollar works harder to deliver measurable growth.