Published on
June 19, 2026


If your CAC looks fine in one dashboard but growth still feels expensive, your data is probably hiding the problem.
I’d sum up the article like this: lower CAC comes from tighter measurement, channel-level reporting, funnel fixes, and monthly rules for spend. The piece focuses on five core metrics: CAC, CAC payback period, LTV/CAC, funnel conversion rates, and retention cohorts. It also points to a few numbers that matter fast: many SaaS teams aim for LTV/CAC of 3:1 and CAC payback under 12 to 18 months.
Here’s the short version:
A few points stood out to me:
In plain terms, this article says CAC comes down when I stop treating it like a marketing-only metric and start treating it like a company-wide math problem.
If I want lower CAC that lasts, I need clean numbers, clear ownership, and tighter spending decisions.
CAC analysis only works when CRM, ad, billing, and finance data match up. Once you define CAC, the next job is simple in theory but messy in practice: get every team working from the same data.
Start with the CRM as the source of truth for paid new customers. But don't stop there. Check closed-won deals against your billing system before you count them as customers. If someone signed a contract but never turned into a paid subscription, they should not be in your customer denominator.
On the cost side, the general ledger gives you the full spend picture. That includes sales salaries, commissions, agency fees, and software overhead. If you leave those out, CAC can look cheaper than it is.
Here’s how each source fits into a clean CAC calculation:
| Data Source | What It Contributes |
|---|---|
| CRM (e.g., Salesforce, HubSpot) | Authoritative new customer count (paid closed-won customers) |
| Ad Platforms (Google, LinkedIn, Meta) | Direct paid media spend by channel and campaign |
| Billing System (e.g., Stripe) | Payment verification; prevents inflated customer counts |
| General Ledger / Accounting System | Salaries, commissions, agency fees, software overhead |
Use server-side tracking to preserve attribution as cookie data degrades. [2]
With the source data lined up, the next step is deciding what counts.
Loose definitions can wreck CAC reporting fast. If one team counts free trial conversions as new customers and another counts only first-time paid accounts, the numbers won't match. Count only first-time paying customers. [2]
Attribution rules matter just as much. In B2B SaaS, long sales cycles make last-click attribution systematically undervalue awareness channels. Multi-touch attribution spreads credit across the full buyer journey in a way that better reflects how deals happen. [2]
A practical reporting rhythm usually looks like this:
With definitions locked in, CAC becomes much easier to connect to cash planning.
CAC data shouldn't sit in a marketing dashboard and go nowhere. Historical CAC by channel is a direct input to cash forecasts and expected new-customer volume. [2] Without that link, growth plans are mostly guesswork.
This is where finance and marketing need to use the same model, often with the guidance of a fractional CFO. Use CAC payback period to test whether acquisition fits your cash window. [2] When you tie acquisition efficiency to burn rate and funding timelines, CAC stops being just a marketing metric and starts acting like a core business signal.
Before you cut budgets, find the actual problem. If you slash spend without a clear diagnosis, you usually slow growth and leave the root issue untouched.
Once your CAC data is clean, the next move is to see which channels, segments, or funnel stages are pushing costs up. In many cases, a small set of channels drives most new revenue.[3]
That means total spend isn't enough. You need CAC at the channel level. Paid search, paid social, SEO, outbound, and partner marketing should each have their own number. Then go deeper and look at campaigns and keywords to spot waste. A competitor search ad campaign, for instance, might bring in plenty of clicks while converting almost no one into revenue.[3]
"By focusing on high-value signals - the specific actions that have the biggest impact - you avoid wasting time and resources on unproductive efforts." - MergeYourData [3]
Customers don't all cost the same to acquire. And they don't all stick around.
When you compare CAC and retention across segments - by ICP, ACV band, or use case - you'll often find a pattern: some segments are expensive to win, but still pay off over time. That's why CAC on its own can mislead you.
Use this view to keep high-CAC segments only when retention and LTV support the spend. Some higher-cost segments are still worth keeping if they bring strong long-term value, so check LTV before making cuts.
High CAC doesn't always start with pricey traffic. A lot of the time, it comes from a broken funnel. Every leak pushes the effective cost per customer higher.
Map the funnel and find the first step where volume drops hard - the bottleneck, or weakest step - before you spend more to fill the top.[1] Healthy traffic with poor landing page conversion is one problem. High signups with low activation is another. Those need different fixes.[1]
Say a segment has a 5% activation rate because onboarding is confusing. In that case, the cost per activated customer can become unsustainable even if traffic is cheap.[1]
Once you know where the bottleneck is, you can move budget and effort to the lever most likely to lower CAC. That diagnosis shows you where to cut waste and where to put more money to work.
Now that you know where CAC is slipping, shift spend toward the fixes that bring in the most return. The aim is simple: more revenue from every $1 spent. Start with the bottleneck you found, then put money behind the change most likely to move it.
In many SaaS businesses, a handful of channels drives most new revenue. That means broad budget cuts often miss the point and waste spend.
A better approach is to find the channels that bring in the most revenue, focus on signals tied to closed-won deals, and shift budget only after you’ve checked that pipeline quality still holds. A channel may look cheap in a dashboard but still bring in customers who churn fast. That’s why LTV:CAC and payback matter. They help you see whether a channel is bringing in durable customers, not just low-cost leads.
Once you move budget toward stronger channels, the next step is to cut friction between the click and activation.
Speed matters more than most teams think. Responding within one hour materially improves conversion, and CRM automation helps make that response steady instead of hit-or-miss. Responding to inbound leads within one hour achieves a 53% conversion rate, compared with just 17% when response takes 24 hours.[4]
Then look at where trial users drop off before they activate. That’s often where money quietly leaks out. Zapier cut CAC 87% with 25,000 long-tail landing pages, while Ampd cut CAC from $317 to $64 with AI lead scoring.[4]
The bigger takeaway is pretty clear: match the message to the right intent signal, then make it easier for people to get from click to activation.
If acquisition costs don’t change, improve the math by increasing customer value. Better retention and expansion lift LTV, which improves acquisition economics. Pricing discipline helps protect that value instead of letting it slip through discounts or weak packaging. Track those gains monthly so they hold over time.
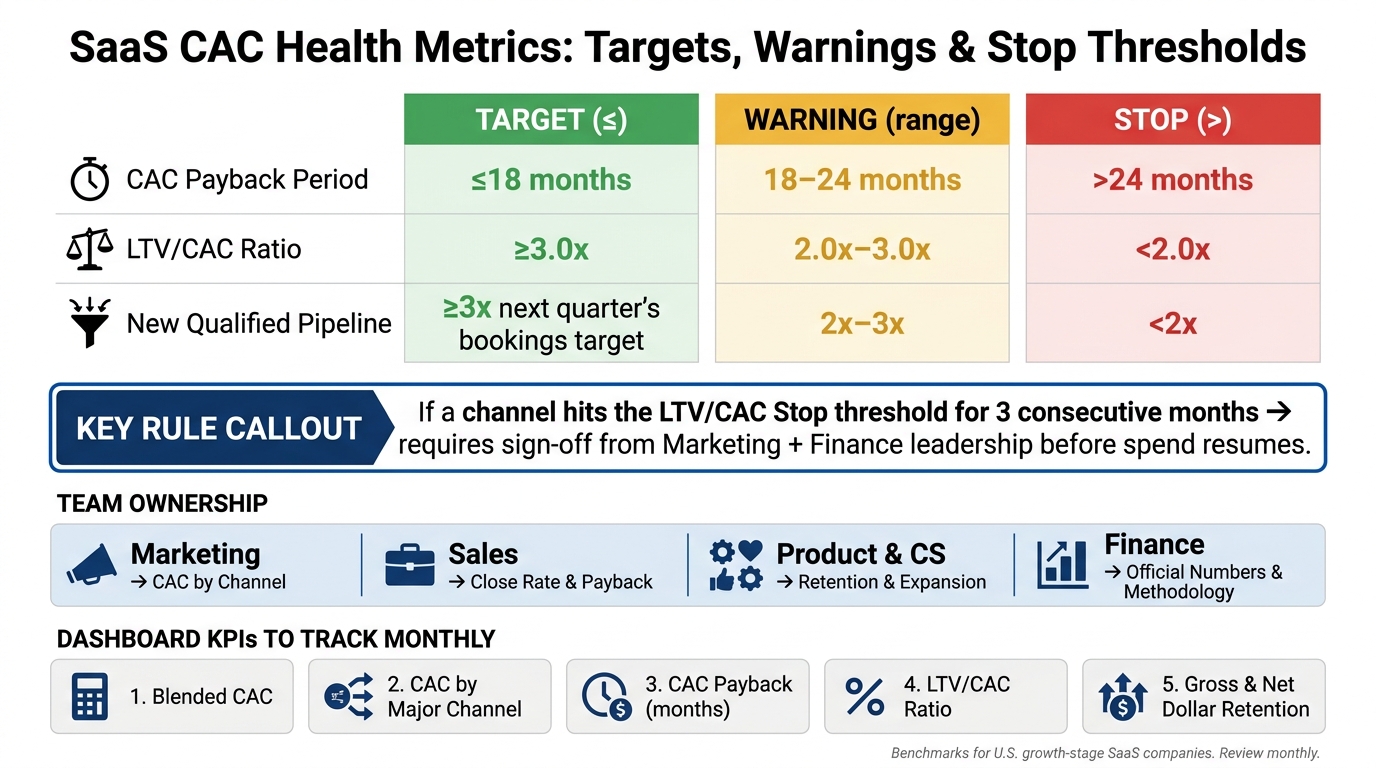
SaaS CAC Health Metrics: Targets, Warnings & Stop Thresholds
Cutting CAC once is the easy part. Keeping it down is where teams usually slip.
After budget changes, conversion fixes, and retention work start improving CAC, you need a steady operating rhythm to keep those gains in place. If not, CAC can creep right back up.
When no one owns CAC, it turns into a shared problem that no one actually drives. The fix is simple: give each team a clear lane.
Marketing owns CAC by channel.
Sales owns close rate and payback.
Product and customer success own retention and expansion.
Finance owns the official numbers and methodology.
That ownership should tie directly to monthly thresholds the team reviews on a set cadence. For U.S. growth-stage SaaS companies, this is a solid starting point:
| Metric | Target | Warning | Stop |
|---|---|---|---|
| CAC Payback | ≤18 months | 18–24 months | >24 months |
| LTV/CAC Ratio | ≥3.0x | 2.0x–3.0x | <2.0x |
| New Qualified Pipeline | ≥3x next quarter's bookings target | 2x–3x | <2x |
These thresholds are practical starting points for growth-stage SaaS companies and should be reviewed monthly. [5][6]
One rule can save a lot of wasted spend: if a channel hits the LTV/CAC stop threshold for three straight months, require direct sign-off from marketing and finance leadership before spending starts again.
That sounds strict. It should. Otherwise, weak campaigns often keep running simply because no one wants to be the person who turns them off.
Ownership only works if leaders can see what’s happening as it happens. A dashboard doesn’t need bells and whistles. It just needs to show the same few numbers every month, in the same way.
Focus on:
Trend lines matter more than a single month’s snapshot. A one-month spike can be noise. A three-month drift is a signal. That’s usually where teams spot trouble before it turns into a bigger problem. [5]
The dashboard also needs to shape decisions, not just document them. If a team wants to add SDR headcount, scale a paid channel, or launch a major test, that request should include the expected effect on CAC and payback before approval.
That keeps the conversation grounded. Not “Does this sound promising?” but “What will this do to unit economics?”
Once this rhythm is in place, CAC management gets a lot less reactive. The process starts to correct itself because the team is watching the right numbers, reviewing them every month, and tying spend to clear rules.
Lower CAC comes from clean measurement, focused fixes, and a monthly operating cadence. The companies that keep their gains tend to treat CAC as a unit economics and operating discipline issue. That’s often the difference between efficiency that lasts and a one-quarter win that slowly slips away.
CAC should include all direct sales and marketing costs tied to winning new customers. That means costs like:
It should also include full sales and marketing compensation - salaries, commissions, bonuses, and benefits - plus any resources used to onboard new customers.
SaaS teams should review CAC on a regular schedule so they can spot trends and see how each marketing channel is performing.
Checking it month to month is especially helpful for tracking payback period and catching cash flow problems early, before they turn into a bigger mess. Automated dashboards make this much easier. They let teams keep an eye on CAC in real time or on a set cadence, and they can flag anomalies right when they show up.
Keep a high-CAC segment if it consistently delivers LTV that more than pays for the upfront spend.
A 3:1 LTV:CAC ratio is a common benchmark. But some enterprise segments work differently.
If you use a land-and-expand model, a higher CAC can still make sense. The payback period can also be longer - sometimes up to 20 months - as long as the segment stays profitable over time and lines up with your growth strategy.