Published on
February 21, 2026

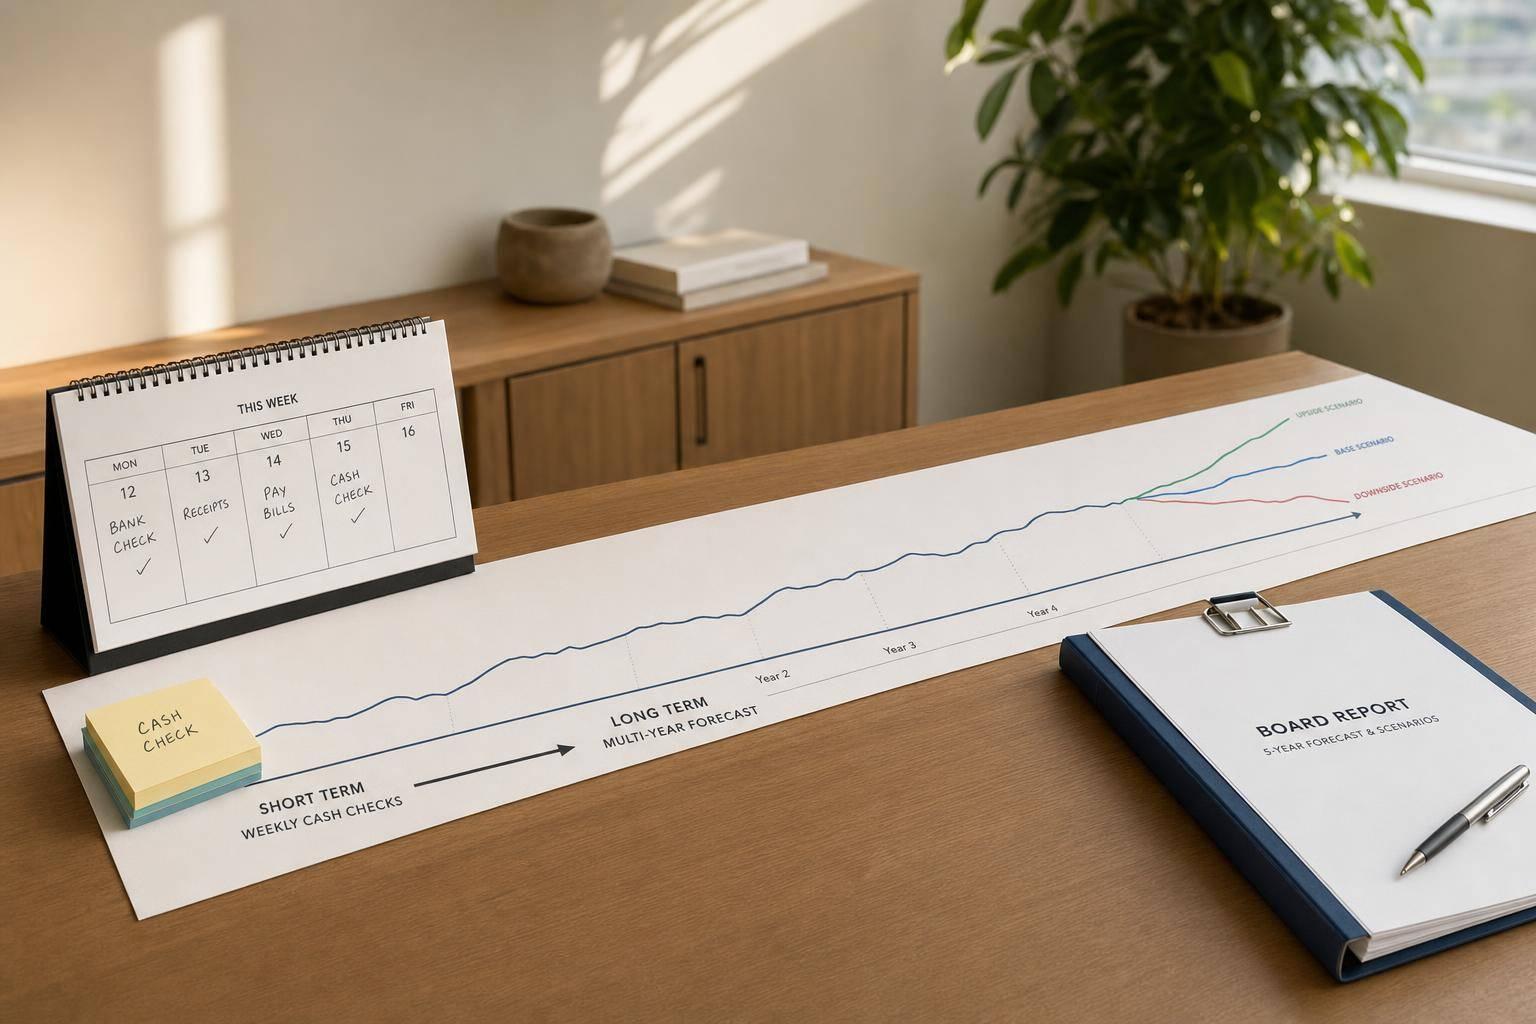
Managing rental properties without the right metrics is risky. To ensure success, focus on these five key performance indicators (KPIs) that directly impact your property's financial health and tenant satisfaction:
These KPIs work together to provide a full picture of property performance. For example, high occupancy means little if rent collection is poor. Monitoring these metrics through dashboards allows property managers to address issues early, ensuring steady income and tenant retention.
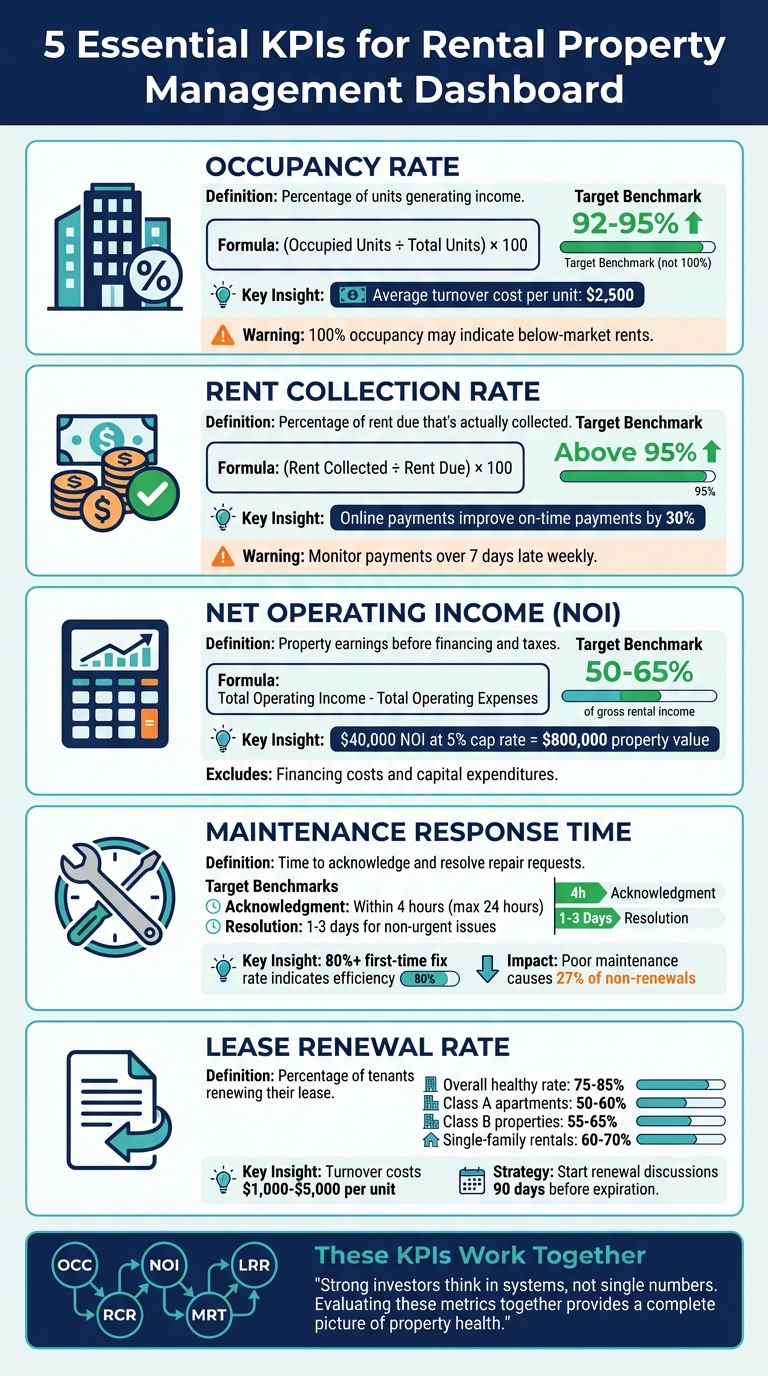
5 Essential KPIs for Rental Property Management Dashboard
Occupancy rate shows the percentage of your units generating income, offering a snapshot of your property's revenue consistency. To calculate it, divide the number of occupied units by the total units, then multiply by 100. This metric provides a foundation for understanding how occupancy affects financial performance.
Occupancy has a direct influence on cash flow. As Saad Shah from RentViewer explains:
"Occupancy is a leading indicator of revenue performance. A well-built multifamily occupancy dashboard lets you anticipate problems and manage leasing proactively." [9]
If occupancy drops, your net operating income will likely take a hit. Interestingly, achieving 100% occupancy isn’t always a good thing. TheGuarantors highlight this issue:
"Properties with high vacancy rates are underutilized, which means there is money being left on the table. However, properties with no vacancy might present a completely different problem – rents that are substantially below market value." [8]
If your property is fully occupied throughout the year, it’s worth conducting market research to determine if you’re underpricing your units.
Beyond its financial implications, occupancy data plays a crucial role in strategic planning. Monthly monitoring can help identify seasonal trends. For instance, markets like Phoenix, Arizona, experience seasonal shifts that require adjustments to marketing and pricing strategies[1]. Sam Caulton, CFO at Re-Leased, explains:
"A property with 92% occupancy that's trending down is more concerning than one at 89% that's climbing. Use rolling three-month averages to smooth out seasonal variations." [2]
A downward trend at 92% occupancy is more alarming than an upward trend at 89%. Combining occupancy data with a lease expiration calendar can help you better predict vacancies and secure renewals[9]. To minimize turnover, start lease renewal discussions 90 days before expiration. This proactive approach can significantly improve cash flow, as the average cost of turning over a single apartment unit is approximately $2,500[8].
Much like occupancy rate, rent collection rate is a key metric for understanding financial health. This metric measures the percentage of rent due that’s actually collected, serving as a critical indicator of cash flow. To calculate it, divide the rent collected by the rent due, then multiply by 100. Ideally, this number should exceed 95%[6].
The rent collection rate has a direct impact on the cash available for critical expenses like operations and debt payments. As Buildium points out:
"Having a lot of arrears (outstanding debt owed to you) on your books can really affect your company's cash flow." [10]
Even if occupancy is high, poor rent collection can undermine financial stability. Since property management fees - typically 8% to 12% of monthly revenue - are based on collected rent, a manager’s profitability depends on actual payments received, not just amounts owed[10].
This highlights the importance of improving collection practices to maintain a healthy cash flow.
The collection rate provides insight into the effectiveness of tenant screening and payment systems. If collections are low despite full occupancy, it may point to issues with tenant approval processes or payment methods. TCT Property Management Services highlights this connection, noting that weak collections in fully occupied properties often signal deeper systemic problems[3].
Switching to online payment platforms can improve on-time payments by as much as 30%[11]. Matthew Kaddatz, Senior Director of Product Management at AppFolio, explains:
"Online payments benefit everyone by moving money faster, speeding up downstream processes like paying owners and vendors." [11]
To prevent arrears, focus on rental payments that are more than 7 days late and monitor delinquency weekly instead of monthly. This proactive approach can help avoid major cash flow disruptions[10][12].
Analyzing collection trends can guide adjustments to tenant screening criteria or late fee policies[2]. Consider using a "tenant health score", which combines actual rent payment history and credit utilization with traditional credit scores, to better predict payment reliability[2].
Set clear thresholds - if the collection rate falls below your target, immediately review lease terms or communication practices[2]. Automated payment reminders and consistent applicant criteria can reduce legal risks and improve collection rates[11].
Net Operating Income (NOI) measures your property's earnings before financing and taxes. The formula is simple: Total Operating Income minus Total Operating Expenses. This includes revenue from rent, parking fees, and laundry services, minus costs like property taxes, insurance, maintenance, utilities, and management fees. It specifically excludes financing costs and capital expenditures.
NOI plays a central role in determining your property's market value. For instance, a $40,000 NOI with a 5% cap rate translates to an asset value of roughly $800,000 [12]. Investors often aim for an NOI margin of 50% to 65% of gross rental income [12]. Sam Caulton, CFO at Re-Leased, highlights its importance:
"NOI is the baseline for valuation, cap rate analysis, and lender conversations." [2]
A strong NOI not only boosts refinancing potential but also supports favorable Debt Service Coverage Ratio (DSCR) outcomes.
Tracking NOI monthly helps catch cost increases early [12]. If NOI margins drop below 50% - compared to the 40% target - it’s time to audit your expenses. Breaking down NOI on a per-unit basis further clarifies how much each resident contributes to profitability [14].
Streamlining reporting through dashboards can significantly cut time spent on manual data entry. For example, reducing reporting hours from 40 to 8 per month saves over $23,000 annually [13]. This freed-up time allows property managers to focus on improving operations rather than struggling with spreadsheets.
NOI, combined with metrics like occupancy and rent collection, offers a clear picture of operational success. It isolates management efficiency from financing [12]. Comparing NOI across properties in your portfolio can highlight which assets need operational changes or rent adjustments. Year-over-year NOI growth confirms that strategies like property upgrades or rent hikes are delivering financial results [4][6]. However, if NOI is climbing but cash flow is shrinking, it might signal a need to revisit refinancing options or capital expenditure plans [2].
These insights make NOI an essential tool for proactive and effective property management.
Maintenance response time measures how quickly repair requests are acknowledged and resolved. It focuses on two key stages: the initial acknowledgment of the request and the time it takes to fully complete the repair[15].
Slow repairs can lead to tenant dissatisfaction and even lease non-renewals. Surveys consistently show that overdue maintenance is one of the main reasons tenants choose not to renew their leases[17]. For example, poor maintenance practices, which can result in missed rental income, cause 27% of landlords to face non-renewals, while 59% report tenants leaving altogether[15]. Companies like AvalonBay Communities and Greystar have achieved tenant satisfaction scores exceeding 4.2 out of 5.0 by leveraging digital platforms to streamline repair tracking and responses[17].
To maintain high satisfaction, aim to acknowledge requests within 4 hours (acceptable within 24 hours) and resolve non-urgent issues within 1–3 days. Delays beyond these timeframes - over 24 hours for acknowledgment or 4 days for resolution - can significantly impact tenant happiness[15].
Monitoring response times uncovers inefficiencies in workflows, such as delays in vendor dispatch, communication breakdowns, or overburdened technicians[5][15]. This data can help evaluate contractor performance and guide decisions about renewing contracts or adjusting staffing levels[15][17]. For instance, Ahlstrom used the MaintainX platform to cut its Mean Time to Repair by 90%, dropping from 580 hours to just 60 hours per month[18].
An 80% or higher first-time fix rate is a strong indicator of efficiency, as it reduces labor costs and eliminates unnecessary travel. On the other hand, recurring issues - problems reappearing within 30–90 days - may signal poor workmanship or the need for system replacements rather than temporary fixes[15]. Efficient maintenance not only lowers repair costs but also prevents minor problems from snowballing into costly emergencies, protecting your Net Operating Income (NOI).
Quick response times can save money by stopping small problems from turning into major expenses. For example, fixing a small leak promptly costs far less than repairing extensive water damage caused by delays. This proactive approach helps safeguard your NOI[15][16]. Allocating about 1% of your property's purchase price annually for maintenance can also prevent deferred maintenance from piling up. Over time, tracking maintenance data helps with capital expenditure planning, showing when it's better to replace systems rather than repeatedly patch them[15][6].
Tracking metrics like maintenance response time is crucial for tenant satisfaction, but the lease renewal rate takes it a step further, highlighting how proactive property management can impact long-term tenant retention.
Lease renewal rate refers to the percentage of tenants who decide to renew their lease when it expires. A healthy rate typically falls between 75% and 85%, though this varies by property type. For instance, Class A apartments usually see renewal rates of 50%–60%, Class B properties range from 55%–65%, and single-family rentals often achieve 60%–70% due to higher moving costs and family-related considerations [19].
Keeping existing tenants is far more cost-effective than finding new ones. Tenant turnover can cost anywhere from $1,000 to $5,000 per unit when you factor in lost rent, marketing, cleaning, repairs, and administrative tasks. High renewal rates help ensure steady cash flow and stabilize your Net Operating Income (NOI). On the other hand, properties with renewal rates below 70% often encounter reduced profitability because of these added turnover expenses [19]. Alongside occupancy and collection rates, strong lease renewals are a cornerstone of consistent financial performance.
Lease renewals are a clear reflection of tenant satisfaction. For example, unresolved maintenance issues can quickly lead to disputes and lower the likelihood of a tenant renewing their lease [19] [3]. Prompt maintenance - especially responses within 48 hours - greatly increases the chances of tenants staying. Starting renewal discussions early also allows property managers to address any lingering concerns before it's too late.
Analyzing lease renewal trends can provide valuable insights for resource planning. If renewal rates are consistently high, you might scale back on marketing efforts aimed at acquiring new tenants. Conversely, lower rates signal potential problems, such as delayed maintenance, uncompetitive pricing, or property condition issues. Conducting exit interviews with departing tenants can reveal specific reasons for non-renewal - like poor communication or conflicts with neighbors - that surveys might overlook. These insights can guide decisions about property improvements or modest incentives for renewal, both of which are often more cost-effective than dealing with a vacant unit [19].
The five KPIs don’t work in isolation - they operate as a connected system, offering a complete picture of your rental property’s performance. For example, high occupancy rates might seem like a win, but if rent collection is lagging, it could point to tenant screening issues rather than success [3][7]. Similarly, a strong Net Operating Income (NOI) might mask underlying problems, such as poor maintenance leading to lower lease renewal rates. As Bigham & Associates aptly states:
"Strong investors think in systems, not single numbers. Evaluating cash flow, expenses, leverage, vacancy, and returns together provides a complete picture of property health." [7]
This interconnected approach becomes even more powerful with real-time insights. By using dashboard monitoring, you can turn these metrics into an early warning system. Instead of reacting to issues after they’ve impacted your bottom line, you can catch red flags - like a rising vacancy rate above your submarket average or a growing maintenance backlog - and address them immediately [2][8]. This proactive stance is what separates properties that merely survive from those that thrive.
Tracking metrics together also highlights the financial impact of decisions. Monitoring occupancy and rent collection simultaneously helps you determine your Effective Gross Income - the actual cash flow you have to cover expenses [2]. This integrated view allows you to anticipate costs, like turnover expenses, before they disrupt your cash flow. Considering that the average apartment turnover costs $2,500 per unit [8], maintaining high renewal rates becomes a key strategy for protecting NOI.
Automation plays a crucial role in eliminating manual errors. As Sam Caulton, CFO of Re-Leased, advises:
"Use reporting tools with automation, dashboards, and seamless integrations." [2]
When your dashboard compares actual performance to budgets and benchmarks - like a 95% rent collection standard [6] or a 35%–50% operating expense ratio [2][4] - you gain the clarity needed to manage risks effectively [7]. These tools give property managers the ability to implement strategies like those from Phoenix Strategy Group for real-time financial control.
Focus on addressing the KPIs that directly influence cash flow and profitability, like your occupancy rate or rent collection. These metrics are the backbone of steady income and essential for covering expenses. Tackling issues in these areas quickly can help bring stability to your rental business.
Setting KPI targets requires a careful look at industry benchmarks and market data. Focus on critical metrics such as occupancy rate, rental yield, and net operating income. Start by analyzing local market averages and compare these figures to your property's past performance.
Consider the property's classification - whether it's luxury, mid-range, or affordable - and adjust your targets accordingly. Regularly revisit these goals to ensure they remain competitive and reflect current market trends and economic shifts. This approach helps you stay proactive and aligned with the ever-changing real estate landscape.
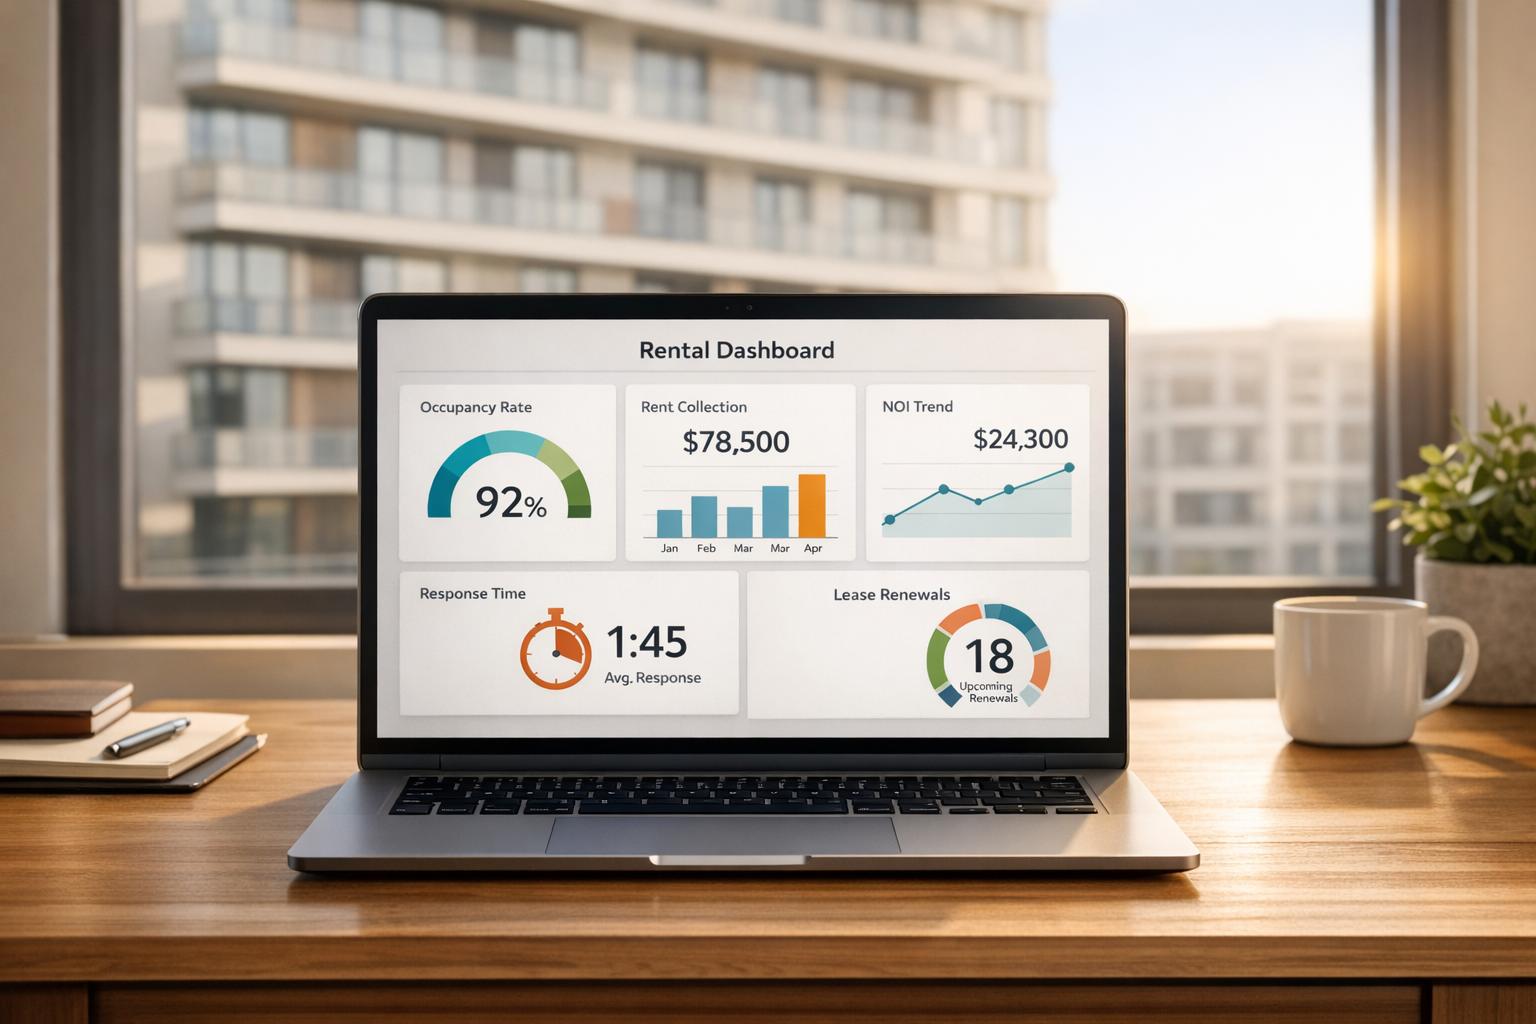
A rental dashboard becomes truly effective when it includes key data points such as occupancy rates, rent collection rates, vacancy durations, tenant retention, operating expenses, maintenance costs, and crucial financial metrics like net operating income (NOI). Keeping this information updated regularly allows landlords and property managers to keep a close eye on performance and make informed decisions.