Published on
March 7, 2026

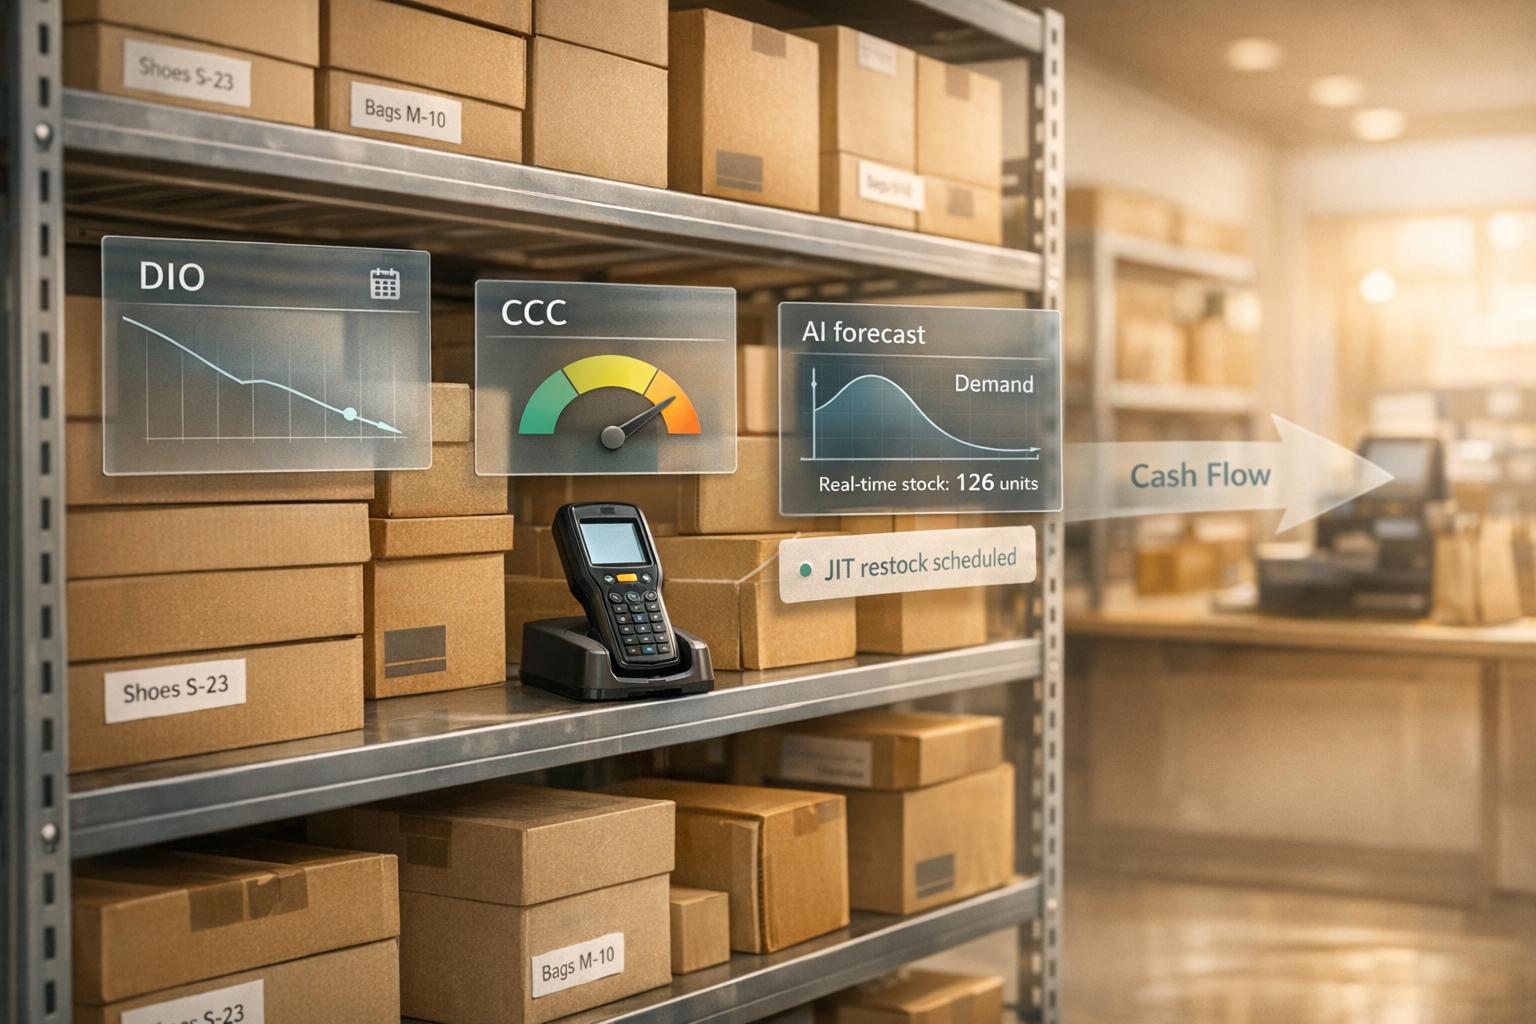
Retail inventory directly affects cash flow. Too much stock ties up money and raises storage costs, while too little leads to lost sales and unhappy customers. Modern solutions like real-time inventory tracking and AI-powered forecasting are helping retailers manage stock better and improve cash flow.
Key takeaways:
Retailers can improve cash flow by shortening the CCC, adopting just-in-time practices, and leveraging AI tools to optimize inventory decisions.

Retail Inventory Management Impact on Cash Flow: Key Statistics and Metrics
Retailers often face a cash flow challenge because they have to pay suppliers upfront, sometimes 30–90 days before the products are sold. This creates a gap where cash is tied up in inventory, making it unavailable for other needs like payroll, marketing, or paying off debt[5]. On top of this, carrying costs and operational inefficiencies add to the financial strain.
Carrying costs alone can eat up 20–30% of a retailer's inventory value annually[4]. For direct-to-consumer (DTC) brands between 2024 and 2026, these costs have been even higher - ranging from 22% to 41%. These include capital costs (8–15%), obsolescence (6–12%), storage (2–5%), and shrinkage (1–3%). In fact, the Logistics Manager’s Index reported that inventory costs hit record highs in 2025, signaling what many experts are calling a major shift in supply chain economics.
As the ZenStatement Intelligence Team explains:
"You don't feel an inventory decision when it's made - you feel it two quarters later when the markdowns and cash gaps hit."
- ZenStatement Intelligence Team[5]
Poor inventory management can lead to "ghost inventory" - items that are lost, damaged, or stolen but still recorded as available. This wastes capital and can result in dead stock, which can cost a business up to 11% of its revenue. Excess inventory often forces retailers to offer steep discounts to clear stock, cutting into profit margins and reducing cash flow[4]. Research shows that 70–80% of DTC brands fail within three years, often due to cash flow problems tied to poor inventory management[5].
A key metric for understanding inventory’s effect on cash flow is Days Inventory Outstanding (DIO), which measures how long inventory sits before being sold. Higher DIO means cash is tied up for longer periods. This problem can worsen when businesses expand their product range without analyzing which items are actually profitable, leaving capital stuck in underperforming products[4][5].
Many businesses make inventory decisions based on merchandising plans without considering treasury forecasts or real-time cash burn rates[5]. This disconnect can create a false sense of profitability, where reported profits mask dwindling cash reserves. Add in unexpected discounts, payment processing fees, and returns outside expected timeframes, and the cash flow situation can become even more strained[5].
Understanding these metrics is essential for managing the broader cash conversion process.
The Cash Conversion Cycle (CCC) measures how long it takes to turn inventory investments back into cash. It’s calculated using this formula:
CCC = Days Inventory Outstanding (DIO) + Days Sales Outstanding (DSO) – Days Payable Outstanding (DPO)[4]
Each part of the CCC affects cash flow in different ways:
| CCC Component | Definition | Impact on Cash Flow |
|---|---|---|
| Days Inventory Outstanding (DIO) | Time inventory is held before sale | Longer DIO ties up capital[4] |
| Days Sales Outstanding (DSO) | Time to collect payment after a sale | Higher DSO delays cash inflow[4] |
| Days Payable Outstanding (DPO) | Time taken to pay suppliers | Higher DPO preserves cash for other uses[4] |
Shortening the CCC helps free up working capital. For example, retailers can negotiate longer payment terms with suppliers, increasing DPO and keeping cash available while inventory sells. Improving inventory turnover to lower DIO also speeds up the conversion of products into cash. By reducing the gap between paying for inventory and collecting revenue, businesses can improve liquidity and gain more financial flexibility.
Real-time tracking offers instant and precise stock visibility across all channels, making cash flow management more efficient by aligning inventory levels with immediate demand [7][8]. By incorporating metrics like Days Inventory Outstanding (DIO) and Cash Conversion Cycle (CCC), this approach enables businesses to react to demand changes within hours instead of days. This quick response helps them make smarter purchasing decisions and avoid tying up funds in excess inventory [7][8]. With this enhanced visibility, retailers can tackle two key cash flow challenges: cutting down on dead stock and adopting just-in-time inventory practices.
The financial benefits are hard to ignore. Companies using real-time tracking systems have reported a 30% reduction in excess stock levels and a 50% drop in stockouts [8]. These improvements free up capital that would otherwise be stuck in slow-moving inventory and minimize lost sales caused by empty shelves. On the flip side, traditional inventory systems cost businesses 15% more annually in storage and labor expenses [8].
Another issue real-time systems address is inventory accuracy. On average, U.S. retail stores operate with only 63% inventory accuracy, and 34% of businesses have shipped late orders because they sold items that weren’t actually in stock [6]. Real-time systems, powered by tools like barcode scanners, RFID tags, and sensor networks, automatically update inventory counts as products move through the supply chain. This automation not only boosts order accuracy by 20% but also reduces the need for manual labor in physical inventory counts [8].
Dead stock and stockouts are two major cash flow drains that real-time tracking helps mitigate. By monitoring inventory movement at the SKU level, retailers can spot slow-moving products early, adjust purchasing strategies, or run targeted promotions to avoid steep markdowns. Automated low-stock alerts help prevent stockouts, which are estimated to result in a 4% annual revenue loss [7]. These strategies optimize stock levels, preserve capital, and directly improve cash flow. Furthermore, businesses maintaining 99% inventory accuracy through real-time systems see customer retention rates exceeding 85% [8].
Real-time tracking also makes just-in-time (JIT) inventory practices more practical. With real-time visibility, retailers can place smaller, more frequent orders and coordinate effectively with suppliers, helping to conserve working capital. The results are measurable: businesses using real-time systems to implement JIT practices achieve 2.5 times higher inventory turnover rates compared to those relying on traditional methods. Additionally, real-time tracking can improve a company’s bottom line by as much as 30% [8].
The key lies in shifting from static safety stock formulas to dynamic calculations that adjust based on actual supplier lead times and real-time demand patterns. This complements cash flow metrics like DIO and CCC [7]. API integrations further enhance these systems by syncing sales, warehouse, and accounting data, which accelerates stock response times by 25% [7][8].
Integrating AI with real-time inventory systems has reshaped how retailers manage stock and predict customer demand. By analyzing over 150 real-time variables - like weather, competitor pricing, social media trends, and local foot traffic - AI enables businesses to shift from reactive to proactive inventory planning [10]. This approach not only prevents revenue loss from stockouts but also reduces the capital tied up in excess inventory, leading to improved cash flow.
For instance, a modest 10% improvement in demand forecasting can increase operating profits by 2–4% [9]. MegaRetail demonstrated the potential of AI by cutting inventory carrying costs by 68% and reducing working capital needs by 36% [10]. These systems also help identify slow-moving products early, allowing businesses to adjust purchasing strategies before funds are wasted on unsold stock.
AI-powered machine learning models excel at detecting subtle and complex patterns [9]. For example, they can assess how a competitor's stockout impacts a brand's price elasticity, enabling dynamic adjustments to pricing and promotions to protect profit margins. These systems also save significant time by automating manual tracking, cutting 20–40 hours of work each month while improving accuracy [11].
Take StyleSphere, a fashion retailer that partnered with 42Signals in February 2026 to implement an AI forecasting tool. This solution incorporated real-time marketplace data and digital shelf analytics. Within a year, StyleSphere saw a 32% improvement in forecasting accuracy, leading to a 40% reduction in stockouts for their top 100 best-selling items and a 25% decrease in end-of-season markdowns [9]. These changes boosted cash flow by reducing lost sales and the need for deep discounts.
MegaRetail offers another compelling example. By deploying an AI system across 500 stores to manage 50,000 SKUs, the retailer achieved remarkable results over a 12-month period ending in 2025. Inventory carrying costs dropped from $180M to $58M (a 68% decrease), while product availability remained at 99.2%. Working capital requirements fell from $450M to $290M, and stock turn rates soared from 4.2x to 12.8x [10]. CEO Sarah Chen reflected on the transformation:
"This AI transformation didn't just optimize our inventory - it fundamentally changed how we think about retail operations. We're now proactive instead of reactive." [10]
Zara has taken AI to the next level with its "Just-In-telligent" system, which combines advanced RFID tags (developed with Intel) and autonomous Fetch Robotics in distribution centers like Zaragoza II [12]. These RFID microchips, embedded in security tags, provide complete visibility of every garment from production to the sales floor, reducing audit times from days to mere hours [13].
This tech-driven approach has cut transit times by 30% and enabled Zara to achieve an industry-leading one-week turnaround for new designs - far faster than the three to six months typical for competitors [12]. As a result, 85% of Zara's inventory sells at full price, minimizing markdown losses and maximizing cash flow [12].
| Financial Metric | Before AI (MegaRetail) | After AI (MegaRetail) | Impact |
|---|---|---|---|
| Inventory Carrying Cost | $180M | $58M | -68% |
| Lost Sales (Stockouts) | $35M | $3M | -91% |
| Markdown Losses | $25M | $5M | -80% |
| Working Capital | $450M | $290M | -36% |
| Stock Turn Rate | 4.2x | 12.8x | +205% |
When it comes to understanding inventory's financial role, tracking specific metrics can transform inventory management into a precise, data-driven strategy. By focusing on the right indicators, businesses can better manage cash flow and operational efficiency. Three metrics stand out in this area: Days Inventory on Hand (DIH), Inventory Turnover Rates, and Gross Margin Return on Investment (GMROI).
Days Inventory on Hand (DIH) - also called Days Inventory Outstanding (DIO) or Days Sales of Inventory (DSI) - measures how long cash remains tied up in inventory [14][15]. A lower DIH means inventory is being converted into cash more quickly, reducing risks like obsolescence and cutting down on holding costs like storage, insurance, or taxes [14][16]. On the other hand, a higher DIH suggests slow-moving stock, which can drain resources. As Runway puts it:
"Every unsold unit is cash in disguise, just sitting there" [15].
DIH benchmarks can vary widely across industries. For example, U.S. retailers typically maintain DIH between 30 and 60 days [15]. Apparel retailers average 50–70 days, electronics 30–45 days, and beauty products 60–75 days. Fast-moving consumer goods and food businesses often aim for 30 days or less [16]. Manufacturing and hardware industries, with their longer production cycles, may see DIH extend to 60–100+ days.
The financial impact of improving DIH can be substantial. For instance, shortening DIH by just 10 days can free up $329,000 for a retailer with $1 million in monthly COGS [18].
Inventory turnover rates are closely tied to DIH. High turnover indicates faster inventory movement, reducing the time cash is locked up. The formula connecting these two metrics is:
DIH = Number of Days in Period / Inventory Turnover Ratio [14][15].
Low turnover can stretch the Cash Conversion Cycle (CCC), tying up working capital and increasing costs, even in profitable businesses [17][18]. To optimize, calculate DIH at the SKU level to identify slow-moving items, and use COGS instead of sales revenue for more accurate results. Monitoring trends, such as reducing DIH from 60 to 45 days, can signal stronger operational health to stakeholders [15].
While DIH and turnover focus on efficiency, GMROI shifts the lens to profitability.
GMROI evaluates how much gross margin is earned for every dollar invested in inventory [19]. Unlike turnover or DIH, GMROI focuses on profitability rather than just movement. The formula is:
GMROI = Gross Margin / Average Inventory Cost
This metric is crucial because inventory often accounts for 60% to 80% of a retailer's total assets [21]. A GMROI above 1.0 indicates profitable inventory, while top-performing retailers often achieve GMROI values above 4.0 [21]. Benchmarks vary by industry: electronics retailers average 6.21, pet supplies 3.90, beauty and cosmetics 3.00–5.00, clothing 2.56, home goods 2.00–3.00, hardware 1.77, and musical instruments 1.30 [21].
GMROI balances profit margins with turnover [19]. For example, luxury retailers might achieve high GMROI through strong margins despite slower turnover, while discount retailers rely on rapid turnover of low-margin goods to achieve similar results [19][21].
Marc Weiss, Co-founder of Management One, offers a word of caution:
"GMROI does not necessarily reflect cash. Unsold inventory shows as profit and unrecorded markdowns can reflect an inflated margin and a higher GMROI" [20].
To ensure GMROI aligns with actual cash flow, businesses can track Cash Margin Return on Investment (CMROI) alongside GMROI [20].
Improving GMROI involves reducing inventory levels, increasing turnover, or boosting gross margins [21]. Calculating GMROI at the SKU level helps identify high-performing products for promotion and slow-moving items for discontinuation. Retail giants like Walmart use GMROI to decide whether a supplier's product deserves shelf space [21].
| Metric | Formula | What It Reveals |
|---|---|---|
| Days Inventory on Hand (DIH) | (Average Inventory / COGS) × Days in Period | How long cash is tied up in inventory |
| Inventory Turnover Ratio | COGS / Average Inventory | How often inventory is replaced |
| GMROI | Gross Margin / Average Inventory Cost | Profit earned per dollar invested in inventory |
| Cash Conversion Cycle (CCC) | DIH + DSO - DPO | Time from paying for inventory to receiving cash |
These metrics lay the groundwork for smarter inventory strategies that directly enhance cash flow management.
Metrics guide decisions, but dynamic inventory strategies can unlock much-needed cash flow.
Seasonal demand can feel like a financial juggling act. Retailers often have to pay suppliers 30–90 days in advance, which means cash goes out long before it comes back in through sales [5]. The key to managing this is dynamic purchase order management - adjusting inventory orders every 2–4 weeks based on real-time demand data rather than committing months ahead [5][22]. By using scenario planning and a 13-week rolling forecast, businesses can stay flexible and adapt quickly. ABC classification also helps by ensuring capital isn’t tied up in slow-moving items [5][22]. Additionally, factoring in forecasted return rates when projecting revenue can prevent surprises down the line [5].
CFOs should monitor cash flow closely and investigate any discrepancies greater than 5% between expected and actual cash receipts on a weekly basis [5]. As the ZenStatement team puts it:
"A 1% cash insight on Monday is worth more than a 10% variance analysis next quarter." [5]
In addition to adjusting seasonal orders, automating reordering processes can further streamline inventory management and protect cash flow.
Manual inventory tracking can eat up 20–40 hours each month, and 43% of small businesses face regular issues with stockouts or overstocking [11]. The cost of poor forecasting is staggering - globally, $163 billion worth of inventory is discarded every year, much of it due to errors in manual processes [11].
Automating reordering can reduce manual work, minimize mistakes, and align inventory levels with real-time demand. AI-powered demand forecasting, for instance, can predict inventory needs with up to 95% accuracy [11]. Companies that adopt automation have reported a 219% ROI over three years, with payback often achieved in under six months [11].
To make automation work for your business, integrate your inventory software with your e-commerce platform to ensure accurate sales data and real-time stock updates. Set clear reorder parameters, like safety stock levels, supplier lead times, and minimum order quantities, to trigger orders exactly when needed. You can also create detailed supplier profiles for instant order placement, use 12-month demand planning tools to prepare for seasonal peaks, and enable automated low-stock alerts to stay ahead [11].
At its core, inventory management is about managing cash flow effectively. Holding too much inventory ties up valuable working capital, restricting opportunities for growth, while stockouts can harm both revenue and customer trust. Research shows that real-time inventory systems can significantly reduce carrying costs, releasing cash that would otherwise be locked in inventory [23][24]. With better visibility into stock levels, businesses can shorten their cash conversion cycle, turning inventory into revenue more quickly and freeing up funds for marketing, expansion, or reducing debt [1][24][3].
Advanced technologies are transforming inventory strategies. The move from reactive ordering to AI-powered demand forecasting is changing how retailers operate. By aligning inventory with demand, AI helps maintain cash flow, reducing waste and missed sales opportunities [1][23]. For example, Zara leverages AI and RFID technologies for item-level tracking, enabling rapid replenishment of popular items and timely markdowns on slower-moving stock. This approach not only protects profit margins but also accelerates inventory turnover, showcasing how these tools are becoming essential for retailers focused on cash flow and customer satisfaction [1][24].
To realize these benefits, businesses should start by implementing real-time tracking systems across all locations and sales channels. Establishing clear reorder points, safety stock levels, and Just-in-Time parameters based on actual demand data is critical [23][24][2]. Regularly monitoring metrics like Days Inventory on Hand (DIH), inventory turnover, and Gross Margin Return on Investment (GMROI) allows for timely adjustments in purchasing, assortment planning, and markdown strategies [1][24]. For retailers navigating complex challenges like seasonality or multi-channel operations, working with firms like Phoenix Strategy Group - offering fractional CFO, FP&A, and data engineering services - can help design inventory policies and dashboards that quantify the impact of inventory decisions on cash flow and funding needs over the next 12–24 months [1][24][2].
In today’s highly competitive and low-margin retail environment, overlooking the cash flow implications of inventory management adds unnecessary risk and slows growth. Every improvement in forecasting accuracy, turnover rates, and real-time visibility strengthens your cash flow and operational stability. These advancements allow you to focus on what truly matters - whether it's expanding to new locations, investing in technology, or reducing debt. Data-driven inventory management is no longer just a back-office function; it’s a fundamental part of modern retail strategy and long-term financial success [1][24][3].
To shorten your Cash Conversion Cycle (CCC) and boost cash flow, here are some practical strategies:
By focusing on these areas, you can turn inventory into cash more quickly while strategically managing your outgoing payments.
The best place to begin is with Inventory Turnover. This metric shows how frequently you sell and replenish your stock, which directly affects both your cash flow and operational efficiency. Once you have a handle on turnover, you can dive into metrics like Days Inventory Outstanding (DIO) or GMROI to get a clearer picture of how your inventory moves and how it contributes to profitability.
Real-time tracking provides instant updates on your cash flow, minimizing errors and enabling faster, more informed decision-making. This feature is especially useful for stores that require up-to-the-minute insights to effectively manage liquidity.
On the other hand, AI forecasting takes cash flow management a step further by improving prediction accuracy, spotting potential risks early, and aiding in strategic planning. This tool is particularly helpful for businesses dealing with fluctuating sales or seasonal trends.
The benefits you’ll see largely depend on the complexity of your store’s operations and how crucial timely, precise financial data is for your decision-making process.