Published on
August 15, 2025

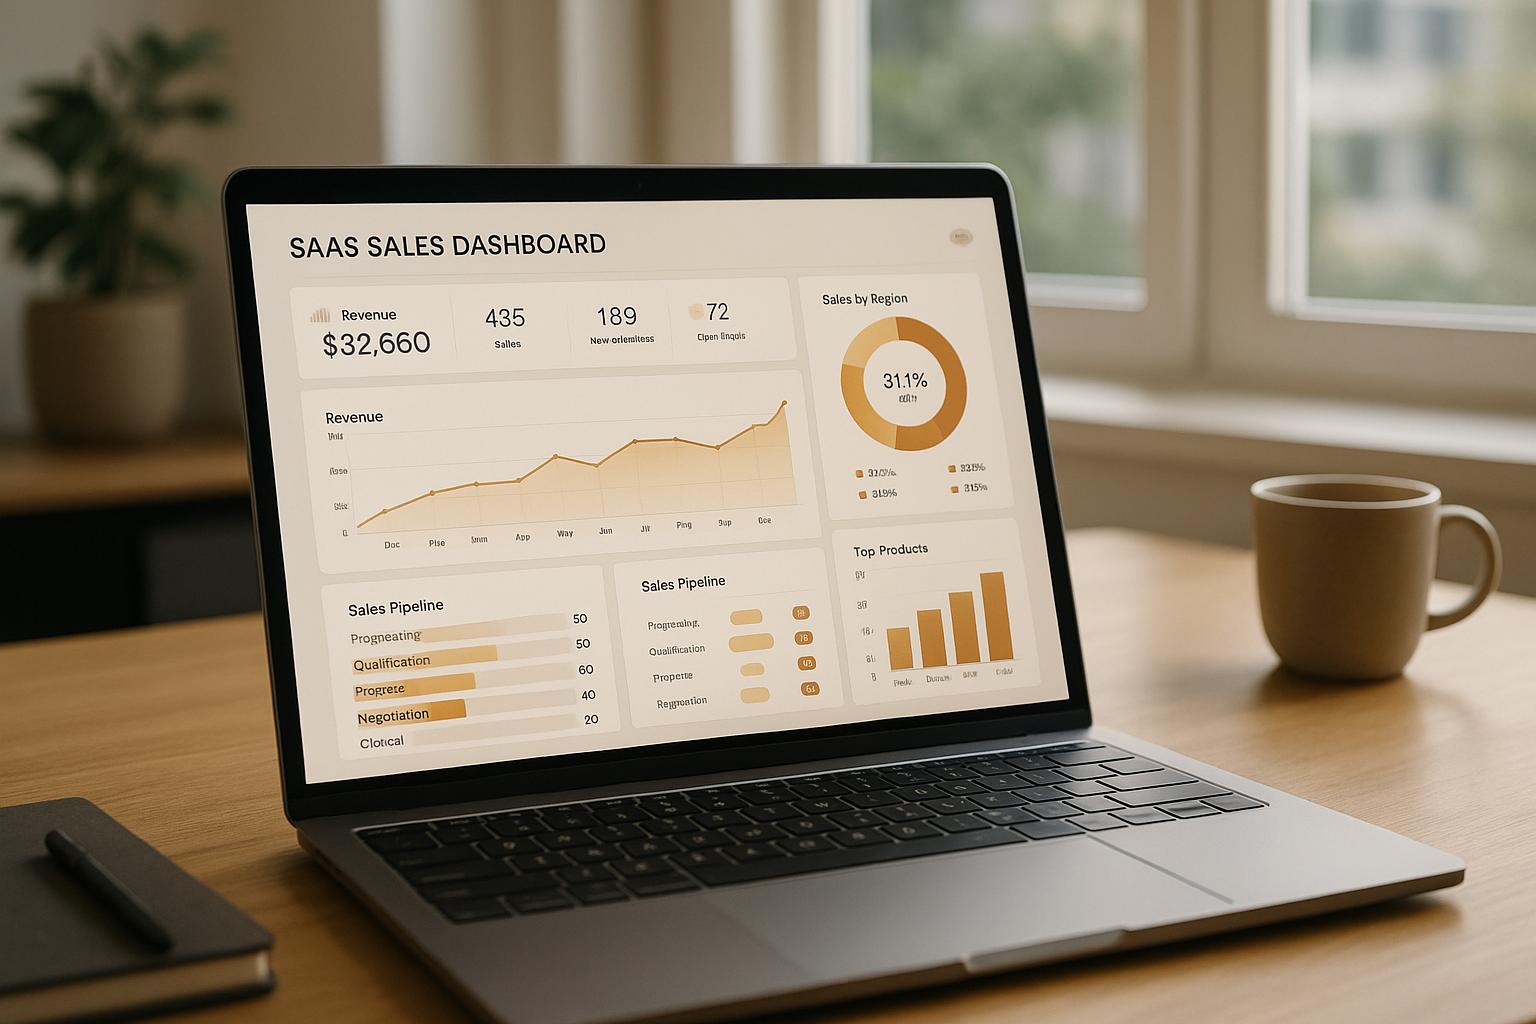
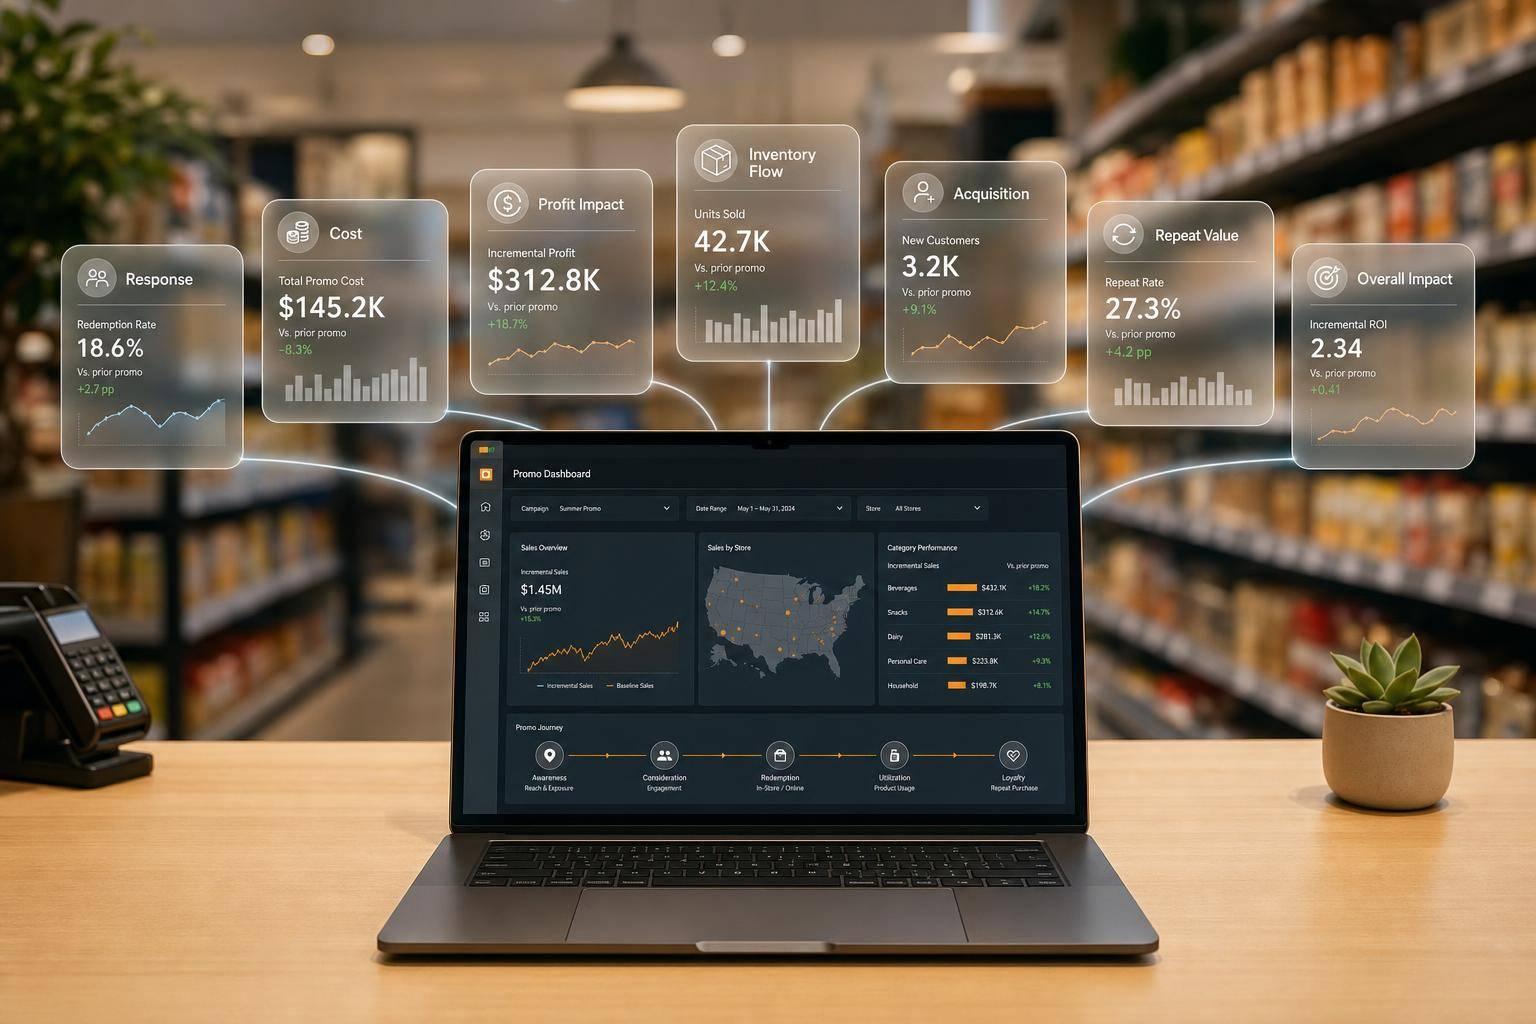
SaaS sales dashboards simplify complex sales data into actionable insights, helping growing businesses manage sales, track revenue, and align teams.
As SaaS companies expand, manual tracking becomes impractical. Dashboards solve this by integrating data from tools like CRMs, financial systems, and marketing platforms into one view. Key metrics such as Monthly Recurring Revenue (MRR), Customer Acquisition Cost (CAC), and churn rates provide clarity on performance and growth opportunities.
Dashboards aren't just about tracking past performance - they help forecast trends, predict churn, and improve decision-making, especially when paired with predictive analytics. Companies like Phoenix Strategy Group specialize in building tailored dashboards, integrating real-time data, and supporting growth strategies for SaaS businesses.
Bottom line: A well-designed sales dashboard is a critical tool for SaaS companies aiming to scale efficiently and make informed decisions.
Metrics are the backbone of any effective SaaS sales dashboard. They transform a simple dashboard into a strategic tool that helps businesses grow. For SaaS companies, where recurring revenue and long-term customer relationships are critical, tracking the right KPIs ensures smarter decisions and better resource allocation.
A successful SaaS sales dashboard should focus on both acquiring new customers and retaining existing ones. Let’s dive into the key metrics that provide actionable insights and drive growth.
MRR and ARR are the financial pulse of a SaaS business. These metrics strip away non-recurring payments to highlight the true, predictable revenue stream.
Tracking MRR and ARR reveals growth patterns, helps with forecasting, and identifies potential issues early. For instance, a drop in MRR growth might signal problems with your sales strategy or product-market fit. Breaking these metrics down by customer segments, pricing tiers, or acquisition channels can uncover which areas are driving growth - or holding it back.
Once you understand your revenue trends, the next step is measuring acquisition efficiency. This is where CAC and LTV come into play.
Churn rate is a critical measure of revenue stability. It shows the percentage of customers canceling their subscriptions each month. But looking at churn in isolation doesn’t tell the whole story. Breaking it down by customer segments, subscription tiers, or tenure provides deeper insights. For example, new customers might churn more frequently within their first 90 days, while enterprise clients often become more loyal after onboarding.
It’s also important to distinguish between customer churn and revenue churn. Losing a few small accounts might not hurt much if you’re retaining high-value customers. Retention metrics, such as cohort analysis, can help you understand how many customers stick around over time and which acquisition channels or onboarding strategies lead to long-term success.
The length of your sales cycle measures how long it takes to close a deal - from the first interaction to signing the contract. This metric reflects the efficiency of your sales process and can influence cash flow planning. A shorter cycle often points to a strong product-market fit, while a longer one may highlight areas needing improvement, like lead qualification or nurturing.
Pipeline coverage, on the other hand, ensures you have enough deals in progress to meet revenue goals. A healthy pipeline accounts for natural deal attrition and keeps your revenue targets within reach.
Conversion rates reveal where prospects drop off in the sales funnel and where you can make meaningful improvements. Your funnel might include stages like:
Each stage offers opportunities for optimization. For instance, enterprise leads might progress more slowly at first but close at higher rates once engaged, while small business leads may move quickly early on but need extra nurturing to seal the deal. Monitoring these rates over time helps you spot patterns, evaluate process changes, and address issues before they impact your revenue.
Creating a sales dashboard that truly drives decisions involves more than just linking data sources and generating charts. The best dashboards are built with clear goals in mind and evolve based on how teams use them. A solid foundation is what separates a useful dashboard from one that gets overlooked.
Before jumping into data visualization tools, it’s crucial to define what success looks like for your dashboard. Different stakeholders need different insights, and trying to cram everything into one view often leads to clutter and confusion.
Start by identifying your primary audience and their needs. For instance, sales managers are likely focused on pipeline health and team performance, while executives care more about revenue trends and growth. Meanwhile, the finance team may need detailed metrics on recurring revenue and cash flow. Knowing who you’re designing for will shape every decision moving forward.
Next, outline specific, measurable goals for your dashboard. For example, you might aim to cut weekly reporting time by 75% or flag accounts at risk within 48 hours. These clear objectives help you decide which metrics to include and how to present them effectively.
As your dashboard grows, consistency becomes key. Define metrics clearly - like what qualifies a lead as "qualified" or how "active" customers are calculated - and document these definitions. This ensures everyone using the dashboard is on the same page.
Also, think about how often the data needs to be updated. Dashboards for daily operations often require real-time data, while those for strategic planning may only need updates weekly or monthly. These timing needs will influence the infrastructure you set up and the insights you prioritize.
Once your goals are locked in, the next step is integrating your CRM, financial, and marketing data.
A successful SaaS sales dashboard brings together data from multiple systems, creating a full view of the customer journey. Most growing businesses have data spread across CRMs, financial tools, marketing platforms, and product analytics. Combining these sources is essential for actionable insights.
CRM integration is the foundation of most sales dashboards. Platforms like Salesforce or HubSpot store critical metrics but often need a cleanup. Before building your dashboard, audit your CRM data to ensure it’s complete and accurate. Missing deal stages, outdated contact info, or inconsistent lead sources can distort your analysis.
Financial system connections add valuable context to your sales data. Accounting tools hold the official record of revenue, while billing platforms like Stripe or Chargebee track subscription details. Linking these systems helps you spot gaps between sales forecasts and actual revenue, improving your ability to predict future performance.
Marketing data integration completes the picture by showing how leads are acquired and nurtured. Platforms like Google Analytics, Facebook Ads, or marketing automation tools reveal which campaigns bring in high-value customers and help calculate acquisition costs.
When integrating these systems, balance real-time updates with technical complexity and budget. Real-time data works well for operational dashboards, while batch updates during off-hours are often sufficient for strategic insights.
Once your data is integrated, the next step is customizing dashboards to fit the needs of various teams. Customization isn’t just about aesthetics - it’s about tailoring the data to different roles.
Each team benefits from features like role-based access and mobile-friendly designs, but their specific needs vary widely:
The best dashboards are never static. Regular feedback from users can reveal which metrics are helpful and which are ignored. Over time, this feedback ensures your dashboards remain relevant and aligned with evolving business needs.
SaaS companies that prioritize growth and alignment often turn to dashboards as a central tool. These dashboards help teams like sales, marketing, and customer success operate from the same data set, making collaboration smoother and growth more achievable.
Dashboards provide a complete view of the customer journey, bridging gaps between departments. By visualizing the entire process - from the first interaction to a closed deal - teams can break down silos and work more cohesively.
Shared visibility starts with tracking metrics that matter to everyone. For example, marketing qualified leads (MQLs) gain new significance when the dashboard shows their progression through the sales funnel and their eventual contribution to customer lifetime value. Sales teams can see which campaigns generate the most promising leads, while marketing learns which sources actually drive revenue.
Customer success data becomes even more impactful when paired with sales insights. For instance, if the dashboard shows that customers from specific channels have higher retention rates or are more likely to expand their contracts, sales teams can focus on those opportunities. Similarly, when customer success identifies behaviors that often lead to churn, marketing can adjust its strategies to attract more engaged prospects.
Unified reporting cycles ensure teams stay on the same page. Reviewing the same dashboard during weekly meetings helps shift the focus from defending individual metrics to tackling shared challenges. Instead of isolated discussions, teams start asking smarter questions: Why are enterprise deals taking longer to close? What changes to onboarding could reduce churn and improve retention?
The design of the dashboard is critical - it should clearly highlight handoff points between teams. For example, tracking the time it takes for a marketing qualified lead to receive its first sales contact can pinpoint bottlenecks. Similarly, monitoring the gap between deal closure and onboarding completion can uncover friction that might affect early retention.
This shared perspective sets the stage for leveraging predictive analytics in the next step.
Once teams are aligned with shared metrics, predictive analytics takes decision-making to the next level. Modern dashboards don’t just report past performance; they predict what’s likely to happen, giving leaders the chance to act before problems arise.
Predictive models combine lead scoring and churn prediction to identify high-priority deals and flag accounts at risk of cancellation. These tools evaluate factors like company size, industry, engagement levels, and behavioral patterns to rank opportunities and predict churn weeks - or even months - in advance.
Pipeline forecasting becomes far more reliable when dashboards incorporate more than just traditional sales stages. Data points like deal velocity, historical win rates, and seasonal trends contribute to more accurate revenue projections. This helps finance teams manage cash flow and gives executives confidence in setting growth targets.
Cohort analysis offers a deeper look at long-term trends that might be missed in monthly snapshots. By tracking customer groups over time, dashboards can reveal whether retention is improving, how expansion revenue grows, and which acquisition channels yield the most valuable customers. These insights can shape decisions around product development, pricing, and market strategies.
Advanced dashboards even factor in market and economic signals to refine predictions. While setting up these features may take extra effort, they offer a significant edge in unpredictable markets.
Accurate forecasting allows leadership to allocate resources more effectively, ensuring investments deliver maximum impact. Growth-stage SaaS companies often face tough choices about where to direct limited resources. Dashboards bring clarity to these decisions by replacing gut instincts with hard data.
Dashboards help guide decisions on key areas like sales territories, marketing channels, product development, hiring, and technology investments. By linking performance data to resource allocation, companies can avoid costly missteps and focus their efforts where they’ll see the greatest return.
The best dashboards make trade-offs easier to understand. For example, instead of guessing whether to hire another salesperson or invest in marketing automation, leadership can model different scenarios and evaluate potential outcomes. This data-driven approach helps companies move forward with confidence.
Creating sales dashboards that truly deliver requires a blend of financial know-how and strategic vision. Phoenix Strategy Group brings together financial advisory expertise, data engineering skills, and growth-focused strategies to help SaaS companies design dashboards that lead to meaningful business results.
Phoenix Strategy Group’s fractional CFO services go beyond basic financial management. They work to develop custom KPIs and financial frameworks tailored to the unique needs of each SaaS business. By identifying the most critical metrics for every stage of growth, they ensure financial systems align seamlessly with sales goals.
For example, they connect revenue metrics like Monthly Recurring Revenue (MRR) and Annual Recurring Revenue (ARR) directly to operational activities. This ensures that the data displayed on dashboards isn’t just numbers - it’s actionable information that drives decisions. The result? KPIs that reflect each company’s unique business model and growth ambitions.
Their strategic support helps companies focus on the right metrics at the right time. Early-stage SaaS companies might zero in on customer acquisition costs and product-market fit, while more established businesses may prioritize pipeline forecasting and unit economics. As David Darmstandler, Co-CEO of DataPath, shared:
"As our fractional CFO, they accomplished more in six months than our last two full-time CFOs combined. If you're looking for unparalleled financial strategy and integration, hiring PSG is one of the best decisions you can make."
This level of financial expertise transforms dashboards into tools that inspire confidence, built on solid financial principles and clear growth strategies.
Phoenix Strategy Group also excels in building the technical backbone of sales dashboards. Their data engineering services include creating ETL pipelines that link financial systems, CRM platforms, and operational databases into unified data warehouses. This ensures that all the key data sources work together seamlessly.
Their expertise in HubSpot implementation ensures that sales and marketing data integrates smoothly into comprehensive reporting systems. With real-time synchronization, leadership teams can access up-to-date pipeline data, cash flow projections, and performance metrics whenever they need them, enabling quick and informed decisions.
By breaking down barriers between finance and revenue teams, they create systems where sales data actively informs financial forecasts and overall strategy. Michael Mancuso, CIO of New Law Business Model, put it simply:
"Hire PSG if you want to make your life easier and have accurate data."
Their technical capabilities also support advanced analytics and predictive modeling, setting the stage for trend analysis and sophisticated forecasting. This integrated approach naturally ties into broader strategic goals, such as fundraising and M&A preparation.
When it comes to funding rounds or acquisitions, having reliable dashboard insights can make all the difference. Phoenix Strategy Group’s M&A advisory services focus on presenting data that highlights growth trends, operational efficiency, and unit economics in a clear and impactful way.
Their dashboard systems simplify the due diligence process by providing consistent, accurate data that underscores a company’s value and growth potential. By working closely with leadership, they identify and showcase the metrics that matter most to investors or buyers.
They also help companies address any weaknesses in their metrics before entering fundraising or M&A activities. This ensures businesses are fully prepared, with data systems that not only support their objectives but also boost their chances of success. With this tailored approach, companies are set up for long-term growth and smarter decision-making.
Sales dashboards have become powerful tools for scaling SaaS businesses. When used effectively, they transform raw numbers into actionable insights that fuel revenue growth, streamline operations, and align teams around common objectives.
At the heart of a successful SaaS sales dashboard are key metrics like MRR (Monthly Recurring Revenue), CAC (Customer Acquisition Cost), LTV (Lifetime Value), and churn rates. These metrics don’t just stand alone - they work together to paint a full picture of your sales performance and growth potential. The real magic happens when these numbers are integrated into a system that unifies data streams and creates a single, easy-to-use tool.
What sets top-tier dashboards apart is customization and integration. By connecting data from CRM platforms, financial tools, and marketing software, businesses can eliminate silos and foster collaboration across teams. This kind of integration ensures everyone is working from the same data, creating a shared understanding of goals and performance.
But dashboards aren’t just about looking back; they’re about looking forward. With predictive analytics, businesses can anticipate sales trends, spot potential churn risks before they escalate, and allocate resources more effectively. This forward-thinking approach turns dashboards into strategic assets, helping companies stay ahead of the curve.
Recognizing that building and integrating these systems can be complex, Phoenix Strategy Group offers specialized services to simplify the process. From CFO-level insights to data engineering and M&A support, they help businesses create dashboards that don’t just track performance - they drive strategic growth.
In today’s competitive SaaS market, the companies that succeed are those that embrace data-driven decision-making. Sales dashboards provide the foundation for this shift, turning intuition into measurable strategies and empowering businesses to scale with confidence.
Your dashboard isn’t just a tool - it’s your roadmap to turning data into meaningful action and driving sustainable growth.
SaaS sales dashboards act as a central hub for real-time data, giving your sales, marketing, and customer success teams a shared view of the numbers that matter. They make it easy to track key metrics, measure progress toward goals, and spot areas that need attention. This kind of visibility helps ensure everyone stays on the same page and works toward common objectives.
By breaking down communication barriers and encouraging collaboration, these dashboards help teams work more effectively together. They reduce inefficiencies, simplify workflows, and enable smarter decision-making. The payoff? A more productive team, better results, and a clearer path to business growth.
To keep a SaaS business on track and moving forward, your sales dashboard should prioritize key performance metrics that shed light on revenue, customer acquisition, and retention. Here are the most crucial ones to monitor:
Focusing on these metrics allows SaaS businesses to make smarter, data-backed decisions, adjust strategies as needed, and stay competitive in an ever-evolving market.
Predictive analytics takes SaaS sales dashboards to the next level by leveraging historical data, customer behavior, and engagement trends to deliver more precise sales forecasts. By incorporating machine learning and AI, it uncovers patterns, anticipates customer needs, and predicts outcomes like deal closures or potential churn.
This approach enables businesses to make smarter, data-driven decisions - whether it’s fine-tuning the timing of re-engagement efforts or customizing marketing strategies. The payoff? Sharper sales predictions, improved resource management, and accelerated growth for SaaS companies looking to scale.