Published on
December 30, 2025

Managing cash flow is one of the biggest challenges for small and medium-sized enterprises (SMEs). Many rely on outdated tools like spreadsheets, which are prone to errors, time-consuming, and lack real-time insights. Custom dashboards solve this by automating data collection, providing real-time visibility into cash inflows, outflows, and key metrics like accounts receivable aging, liquidity ratios, and profit margins.
These dashboards integrate with tools like QuickBooks, Xero, and banking platforms, offering tailored insights specific to your business model - whether you're in retail, SaaS, or e-commerce. Unlike static reports, they are interactive, dynamic, and can alert you to potential issues, such as overdue invoices or low cash reserves, before they escalate.
By implementing dashboards, SMEs can:
For example, companies using dashboards have reduced Days Sales Outstanding (DSO) by up to 40%, improved cash inflows, and avoided financial crunches. Whether you're preparing for growth or navigating challenges, custom dashboards provide the clarity needed to keep your business financially healthy.
Custom Dashboards vs Standard Reporting Tools for SME Cash Flow
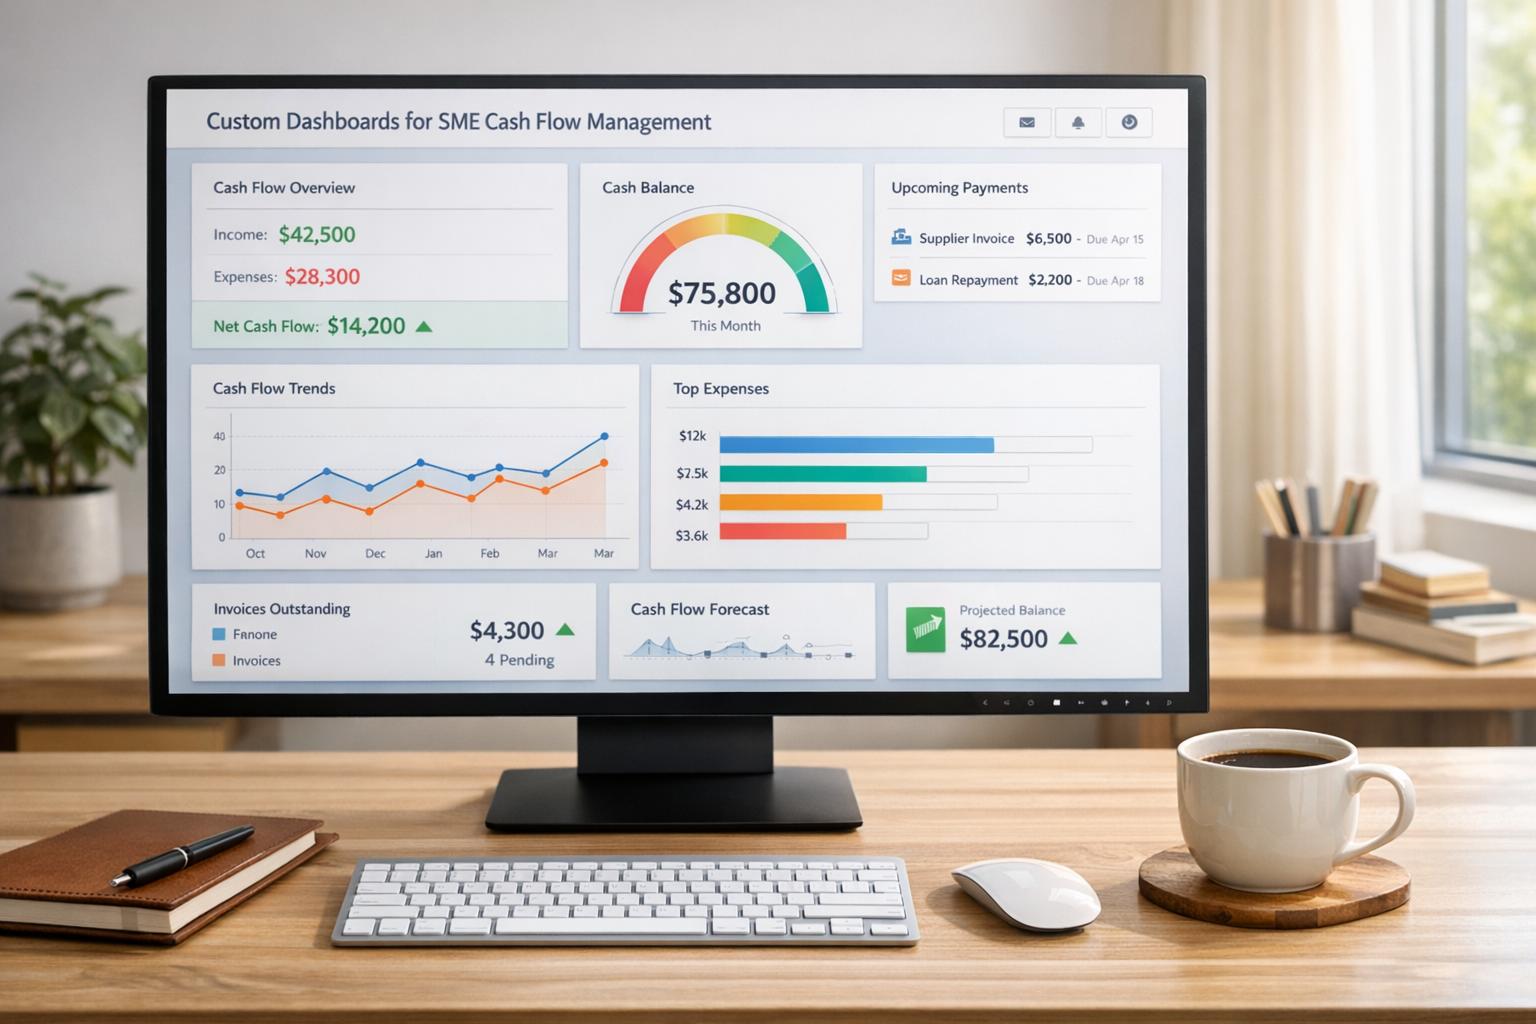
Custom dashboards bring all your financial data - whether from QuickBooks, Xero, bank accounts, or payment processors - into one real-time, easy-to-read view. Instead of juggling spreadsheets or hopping between systems, small and medium-sized businesses (SMEs) get an automated, up-to-the-minute snapshot of their cash flow. These dashboards display key figures like opening balances, cash received, cash spent, and closing balances across different timeframes, all updated in real time. This consolidated view provides a solid starting point for understanding and managing cash flow more effectively.
What’s more, these dashboards align with your specific business model. For instance, a retail business could integrate Shopify sales with bank balances to monitor net cash flow and overdue invoices. Meanwhile, a SaaS company might combine Stripe data with accounting software to track monthly recurring revenue (MRR) churn alongside cash metrics. The beauty of custom dashboards is their ability to spotlight the metrics that matter most to your business.
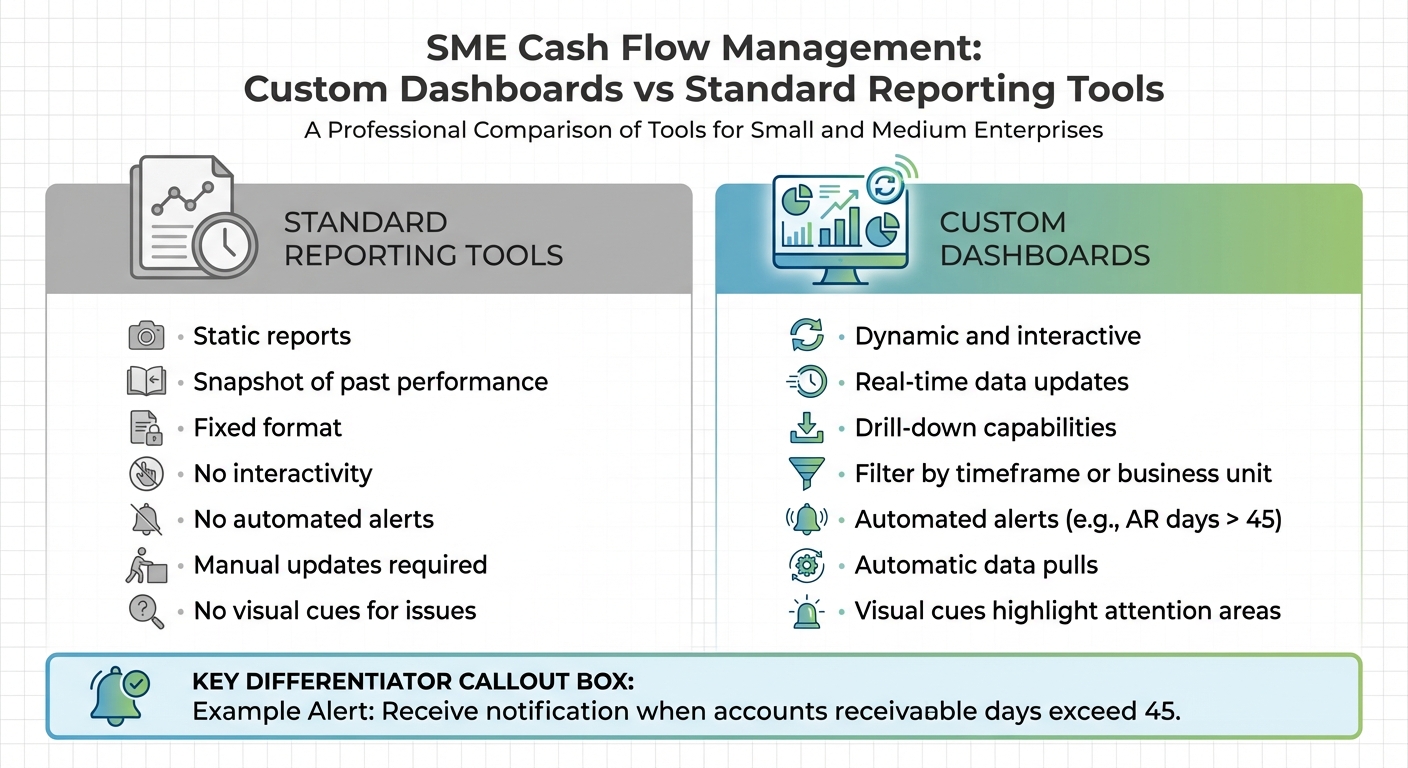
To see why custom dashboards stand out, let’s compare them to standard reporting tools. Traditional reporting tools generate static reports that offer a snapshot of past performance. These reports are fixed, lack interactivity, and don’t provide alerts for anomalies or threshold breaches.
Custom dashboards, on the other hand, are dynamic and interactive. They allow you to drill down into specific metrics, filter data by timeframe or business unit, and even set up automated alerts. For example, you could receive a notification if accounts receivable days exceed 45. Unlike static reports that require manual updates, custom dashboards pull data automatically and use visual cues to highlight areas that need attention.
Tailored dashboards provide real-time insights that help you stay ahead of potential cash flow challenges. Instead of discovering a cash shortfall at the end of the month, you can identify and address issues as they arise. This real-time visibility makes it easier to manage liquidity by flagging delays in receivables, so you can take action quickly.
By narrowing the focus to the metrics that matter most, these dashboards eliminate guesswork. For example, a home services business might track bank balances and job profitability, while an e-commerce company could monitor gross sales, PayPal fees, and net cash flow. This clarity helps resource-constrained teams make smarter decisions without needing to bring in a full-time CFO. Beyond showing the current cash flow situation, tailored dashboards also provide the insights needed to develop proactive financial strategies.
"As a home service business owner, understanding complex financials and Unit Economics always seemed overwhelming - until we started working with Phoenix Strategy Group." - Rob Mulvin, Founder / CEO, All Pro Shade
Tracking the right metrics can turn your dashboard into a powerful decision-making tool. Start with cash inflows, which include payments, revenue, and financing. Pair that with cash outflows, such as supplier payments, payroll, rent, and other operational expenses. The difference between these two gives you your net cash flow, a critical indicator of your financial position.
Accounts receivable (AR) aging is another key metric, breaking down unpaid invoices into time categories - like 0–30 days, 31–60 days, 61–90 days, and over 90 days. This metric highlights how efficiently you’re collecting payments. For instance, if more than 30% of receivables are overdue by 60 days or more, it could spell trouble. Similarly, a days sales outstanding (DSO) over 60 days is problematic, especially when the average for small and medium enterprises (SMEs) hovers between 45–60 days. On the other hand, accounts payable (AP) reflects what you owe to suppliers and when those payments are due. Managing AP wisely can help you time payments effectively without straining vendor relationships.
Liquidity ratios offer a quick health check for your finances. The current ratio (current assets divided by current liabilities) should ideally range between 1.5 and 2.0, meaning you have $1.50–$2.00 in assets for every $1.00 of short-term debt. The quick ratio, which excludes inventory, should stay above 1.0, showing you can cover immediate obligations without selling off stock. Dashboards with color-coded indicators - like green for healthy ratios and red for concerning ones - can provide instant alerts. Don’t overlook profit margins, especially the gross profit margin, which should typically sit between 30–50% for SMEs. This directly impacts the cash available for daily operations.
Considering that 82% of small businesses fail due to cash flow issues [9], keeping these metrics updated in real time is crucial. For example, in 2023, a home service SME working with Phoenix Strategy Group used custom dashboards to monitor AR aging and unit economics. Over six months, they reduced DSO from 75 to 42 days, boosting monthly cash inflows by $150,000 and improving working capital by 25%. This allowed them to renegotiate lending terms during their busiest season [10][11].
Displaying these consolidated metrics on a real-time dashboard can simplify decision-making. From there, you can tailor the metrics to align with the specific cash flow drivers of your business model.
Not all businesses need to focus on the same metrics with the same intensity. For seasonal businesses like retail stores, monitoring cash reserves and forecasting inflows and outflows during slow periods is vital. Inventory turnover is another key metric, as it measures how quickly stock is converted into cash - a critical factor during revenue dips. Keeping a close eye on your working capital cycle can help ensure you’re prepared for off-peak months.
For service companies, the challenges are different. These businesses often bill for time rather than products, making AR aging and billable utilization rates essential metrics. A utilization rate of 75–85% is ideal for maintaining steady cash flow. Since delayed receivables are common, tracking DSO and setting alerts for anything over 45 days can help you stay on top of overdue invoices.
SaaS companies, on the other hand, should prioritize metrics like monthly recurring revenue (MRR), churn rate (aim for less than 5% monthly), and net revenue retention (a figure above 100% indicates growth from existing customers). These metrics directly tie to predictable cash inflows. Meanwhile, e-commerce businesses need to focus on gross sales, average order value, and net cash flow after deducting fees like payment processor charges and shipping costs. Each business model has unique cash flow dynamics, so your dashboard should reflect the specific liquidity drivers relevant to your operations.
A great dashboard directly connects to your accounting software, bank feeds, and payment platforms through automated integrations[2][7]. By automating these processes, you eliminate the need for manual updates, as the system pulls key cash flow metrics and calculates net positions on its own[4]. With real-time data refreshes, your dashboard remains up to date throughout the day, allowing you to spot and address potential cash flow problems before they disrupt operations. For SMEs with small accounting teams, this automation saves valuable time, letting staff focus on strategic analysis rather than repetitive data entry. Once real-time updates are in place, intuitive visuals become essential for making sense of the data.
Dashboards that work well present financial data clearly through charts and KPIs[7]. Features like drag-and-drop interfaces and built-in graphics allow you to adapt visualizations to fit your specific workflows[8]. Comparative views, for instance, can show your end-of-period cash status alongside net cash changes across reporting cycles, making it easier to spot major shifts in your financial position[4].
Simple visual tools, like traffic-light indicators, provide instant feedback - green for stable, yellow for caution, and red for concern. Alerts can also notify you when certain thresholds are crossed, such as accounts receivable days exceeding 45 days[6]. These straightforward visuals reduce the need for lengthy meetings by giving you a quick snapshot of your financial health. Tailored displays like these help SMEs react quickly to changes in cash flow.
Beyond clear visual summaries, interactive filtering features let you dig deeper into your data. You can click on specific dashboard tiles to see detailed information, compare time periods, or review underlying account details[6]. Filters based on department, cost center, time frame, or customer help you analyze cash flow patterns unique to different parts of your business, making cash flow management more precise[2].
For example, a financial dashboard that shows billing aging by customer simplifies the process of following up on overdue invoices[8]. Every interactive element allows you to examine cash flow from various perspectives in real time, cutting out the need for separate reports and speeding up decision-making.
Start by taking stock of all the systems that influence your cash flow. This includes accounting software, CRMs, payment processors, and bank accounts [5][12]. Many modern platforms offer API access or pre-built connectors, so check whether your systems can integrate easily with others [5][12].
Once you have your systems mapped out, prioritize data accuracy. A dashboard is only as useful as the quality of the data feeding into it. If your source data is messy or incomplete, your metrics will be unreliable. Make sure all your data is clean, accurate, and organized before connecting it to any visualization tools [5]. If your financial and revenue data is scattered across different systems, consolidate it. This will help you get a clearer view of how activities like marketing and sales impact cash flow [5]. For businesses with complex operations, you might need an ETL (Extract, Transform, Load) pipeline or a data warehouse to gather and structure the data before it flows into your dashboard [5].
Using your data inventory as a foundation, identify the metrics that are critical for managing cash flow. Start by clarifying your main goal - whether it's optimizing cash flow, improving profitability, or preparing for fundraising - and then define key metrics like revenue, liquidity, and expense management based on that goal [14]. Your industry will also play a role in determining which metrics to focus on. For example, SaaS companies should monitor Monthly Recurring Revenue (MRR) and Churn, while manufacturing businesses should prioritize the Cash Conversion Cycle (CCC) and inventory metrics [1][14].
Incorporate forward-looking data alongside historical figures. Metrics like forecasted cash flow, revenue pipelines, and burn rates are essential for identifying potential issues before they escalate [2][13]. Think about how you want to visualize this data too. For instance, use waterfall charts to track cash movements or heat maps to pinpoint risk areas [1][3]. Make sure to involve stakeholders from finance, operations, and management in this process to ensure the dashboard meets the needs of all departments [1].
With your data sources integrated and key metrics defined, it’s time to build and test the dashboard. Set it up to pull real-time data, which eliminates manual errors and keeps everything up-to-date [5][13]. Configure the system to track the KPIs you’ve established, such as Days Sales Outstanding (DSO), Burn Rate, and Net Cash Flow [13]. A great example of this in action is from 2025, when Sam Kaplan, Chief Accounting Officer at Phoenix Strategy Group, revamped a $10M ARR company’s accounting system. By standardizing data and leveraging dashboard insights, the company recovered $2M in receivables [5].
Test the dashboard by cross-referencing its metrics with your Profit & Loss statements, Balance Sheets, and Cash Flow statements [5]. Automate updates and set up alerts to flag negative trends as they arise [13][5]. To ensure ongoing effectiveness, establish a weekly review schedule where stakeholders can analyze the dashboard and adjust business targets based on its insights [5]. This process helps tie your dashboard’s design to actionable, data-driven decisions, giving small and medium-sized businesses a powerful tool for managing cash flow.
"Hire PSG if you want to make your life easier and have accurate data" - Michael Mancuso, CIO at New Law Business Model [5]
Once implemented, dashboards become powerful tools for turning raw data into smarter financial decisions. A well-crafted dashboard doesn’t just show where your cash is - it helps you predict challenges, optimize timing, and plan ahead. By leveraging real-time data, businesses can shift from reacting to cash flow problems to proactively managing them. This shift transforms insights into actionable strategies for maintaining healthy cash flow.
For companies with seasonal revenue patterns, cash flow swings are predictable, yet many small and medium-sized enterprises (SMEs) still find themselves unprepared. Dashboards provide a clear visualization of historical cash flow data - such as opening balances, cash inflows, outflows, and net changes - over multiple periods, helping businesses identify trends before they become problems. For instance, a retail business might spot a recurring dip in cash reserves during off-peak seasons. Armed with this knowledge, they can secure credit in advance or adjust inventory orders to avoid financial strain.
Dashboards are equally useful for growth planning. They track key performance indicators (KPIs) like net new monthly recurring revenue (MRR), churn rates, and cash flow projections, allowing businesses to model the financial impact of expansion. A SaaS company, for example, could use its dashboard to forecast the cash needed for scaling its team. By regularly reviewing these metrics, the company can set realistic growth targets and avoid overextending itself financially.
Beyond identifying trends, dashboards can fine-tune the timing of financial operations. Maintaining steady cash flow often hinges on balancing vendor payments with customer collections. Dashboards track critical metrics such as Days Payable Outstanding (DPO), Days Sales Outstanding (DSO), overdue invoices, and bank balances, providing the clarity needed to adjust payment schedules effectively. If collection periods are too long, businesses can reassess payment terms or focus on speeding up collections.
Take an e-commerce business as an example. By prioritizing high-value receivables and negotiating extended terms with vendors, they could free up anywhere from $10,000 to $50,000 each month. Norman Rodriguez, Founder and CEO of ElevateHire, described how Phoenix Strategy Group helped his company during a challenging financial period:
"PSG saved my dream. They helped us get our financials in order and renegotiate our lending agreements, pulling us through a tough financial crunch."
One of the most critical benefits of cash flow dashboards is their ability to flag potential problems early. Alerts for declining net cash flow, overdue invoices, negative cash balances, or worsening liquidity ratios act as early warning systems. Automated notifications - like alerts when cash drops below a 30-day operating threshold or when DSO exceeds 45 days - ensure that no red flags go unnoticed.
Proactive monitoring can turn potential crises into manageable challenges. For example, in 2025, Sam Kaplan, Chief Accounting Officer at Phoenix Strategy Group, used dashboard insights to recover $2 million in receivables for a major client. By identifying payment delays and optimizing oversight systems, Kaplan helped the client avoid a cash flow crunch [5]. These examples highlight how dashboards provide SMEs with the tools they need to address issues early and keep operations running smoothly.
Custom dashboards are powerful tools, but their real impact comes from embedding them into your daily financial processes. Simply building one isn’t enough - it’s about making them a part of your team's routine to guide decisions across all levels of the organization.
Consistency is the backbone of effective dashboard use. Start with quick, daily 10-minute check-ins on key metrics like cash balances and overdue receivables. Expand to weekly reviews to identify trends such as net cash flow and Days Sales Outstanding (DSO). Reserve monthly sessions for deeper analysis, focusing on closing balances, net cash changes, and forecasts that shape long-term strategies.
Automated alerts can be game-changers. For instance, set up notifications for when cash balances drop below a 30-day operating buffer or when accounts receivable aging exceeds 45 days. These alerts help ensure no critical issues are overlooked. According to Phoenix Strategy Group, integrating custom FP&A dashboards into regular reviews can clarify unit economics and support vital decisions, such as renegotiating lending agreements during cash shortages [10][11].
Dashboards are most effective when roles are clearly defined. Assign team members specific metrics based on their responsibilities. For example:
Clear accountability is essential. At Phoenix Strategy Group, tasks are divided strategically: data engineers manage ETL pipelines and infrastructure, bookkeepers handle daily reconciliations and AR/AP tracking, controllers ensure GAAP compliance, and fractional CFOs leverage dashboard insights for forecasting and budgeting [5]. This structured approach ensures that data insights lead to actionable outcomes.
Your dashboard needs to evolve alongside your business. Begin with core metrics like end-of-period cash and net changes. As your revenue surpasses $1M, incorporate custom KPIs, integrate additional data sources, and develop role-specific views tailored for executives and finance teams [2][4][8].
Phoenix Strategy Group has helped over 240 portfolio companies optimize their FP&A dashboards, enabling them to raise more than $200 million in funding and complete over 100 M&A transactions in the past year [9][10][11]. This scalability is achieved through quarterly reviews of data requirements, real-time API integrations, and transitioning to advanced tools like Power BI or Tableau when team sizes exceed 50 employees [11]. These enhancements ensure dashboards remain a reliable source of real-time insights and support strategic decision-making as your business grows.
Custom dashboards provide small and medium-sized enterprises (SMEs) with the financial clarity they need to confidently manage cash flow. By moving beyond static spreadsheets and delayed month-end reports, these dashboards offer real-time insights into inflows, outflows, and working capital. This level of visibility helps businesses identify potential issues early and act on opportunities as they arise.
With this real-time clarity, businesses can shift from reactive bookkeeping to a more proactive approach to financial management. This transition can be a game-changer, separating businesses that merely get by from those that excel. For example, a SaaS company used its dashboard to identify a dip in gross margins. Armed with this insight, they paused discounting and renegotiated vendor contracts, recovering two margin points in just one month [6].
As your company grows, your dashboard should evolve too. Start with the basics - core metrics - and expand over time to include custom KPIs, integrate multiple data sources, and create role-specific views. Phoenix Strategy Group has shown how scalable, data-driven financial systems can lead to strategic funding and successful exits for portfolio companies [10][11]. This adaptability not only supports your current operations but also lays the groundwork for future milestones.
"As our fractional CFO, they accomplished more in six months than our last two full‑time CFOs combined." – David Darmstandler, Co‑CEO, DataPath [5]
Custom dashboards offer SMEs a real-time, centralized view of essential cash flow metrics, eliminating the need for scattered spreadsheets and manual tracking. By connecting directly to accounting software, bank accounts, and payment platforms, these dashboards provide constant updates on key figures like current cash balances, projected inflows, upcoming payables, and cash-burn rates. This streamlined approach helps businesses keep a close eye on their cash runway and spot potential liquidity issues before they become serious problems.
Beyond improving visibility, these dashboards also enhance planning and forecasting. With interactive features, SMEs can test "what-if" scenarios, compare projections, and adjust strategies as new data rolls in. Clear visuals of metrics like working capital ratios and cash conversion cycles make it easier to make well-informed decisions about spending, hiring, or securing financing. The result? More precise budgeting, better organizational alignment, and a stronger grip on cash flow - key ingredients for growth and long-term stability.
To keep cash flow in check, small and medium-sized enterprises (SMEs) should prioritize tracking a few essential financial metrics. Start with the current cash position, operating cash flow, and free cash flow - these offer a clear picture of your liquidity and overall financial health. It's also important to keep an eye on the cash burn rate and runway, which reveal how long your business can operate before needing more funding.
Another key area to monitor is the cash conversion cycle, which shows how quickly cash moves through your operations. On top of that, focus on accounts receivable metrics like days sales outstanding (DSO), average days delinquent, and the accounts receivable turnover ratio. These numbers reflect how efficiently you're collecting payments and managing cash flow. Staying on top of these metrics helps SMEs make smarter financial decisions and maintain stability.
Custom dashboards work best when they're designed around the unique needs of your business. Start by pinpointing the key metrics that matter most to your operations. For instance, a subscription-based company might zero in on Monthly Recurring Revenue (MRR) and Customer Acquisition Cost (CAC), while a product-focused business could prioritize metrics like inventory turnover and gross margin. On the other hand, service-based businesses often benefit from tracking billable hours and project profitability.
Once you've identified your key metrics, bring in data from sources like accounting software, bank feeds, or CRM systems. Automating updates ensures your dashboard reflects real-time information. Tailor the visuals to suit each stakeholder's needs, using clear formats like line charts or heat maps. For example, a SaaS company might emphasize MRR trends and churn rate, while a retailer might track sales by category or cash conversion cycles.
To take it a step further, add features like alerts and scenario-planning tools. Dynamic cash flow forecasting, for example, lets you model best- and worst-case scenarios, giving you the ability to anticipate challenges or explore growth opportunities. By aligning the right metrics with real-time data and actionable insights, custom dashboards equip small and medium-sized businesses to make quicker and more informed financial decisions.