Published on
January 7, 2026


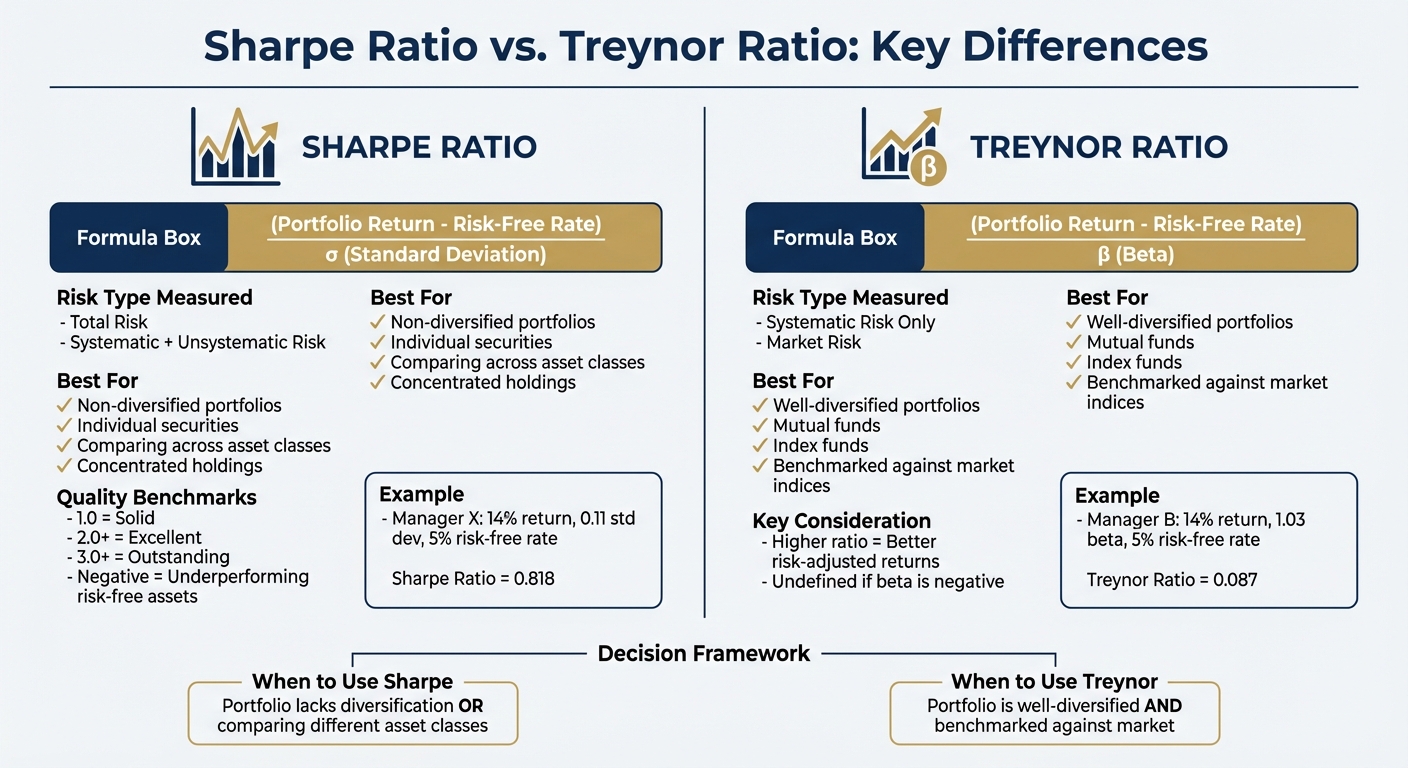
When analyzing investment performance, raw returns alone don't paint the full picture. Risk-adjusted metrics like the Sharpe Ratio and Treynor Ratio help you understand whether returns justify the risks taken. Here's the key difference:
Choosing the right metric depends on your portfolio's structure:
Both metrics provide insights into risk-adjusted returns, helping you make smarter investment decisions.
The Sharpe Ratio evaluates how much extra return an investment generates for the risk you're taking on. It’s calculated by dividing the excess return (portfolio return minus the risk-free rate) by the portfolio’s standard deviation, which represents total risk - this includes both broad market fluctuations and the specific ups and downs of individual holdings. The risk-free rate is often represented by the yield on a 90-day U.S. Treasury bill.
"The Sharpe ratio describes how much excess return you receive for the extra volatility you endure for holding a riskier asset." - Investopedia [5]
Imagine Manager X achieved a 14% annual return over 10 years with a standard deviation of 0.11, while the risk-free rate was 5%. The Sharpe Ratio here would be (14% - 5%) / 0.11 = 0.818. Now compare that to Manager Y, who posted a higher return of 17% but came with a higher standard deviation of 0.20. Manager Y's Sharpe Ratio would be 0.600. Even though Manager Y delivered a higher absolute return, Manager X offered better risk-adjusted performance - more return for each unit of volatility [1].
In general, a Sharpe Ratio of 1.0 is considered solid, 2.0 or higher is excellent, and 3.0 or higher is outstanding [5][6]. A negative ratio? That means you'd have been better off sticking with risk-free assets. For instance, as of January 26, 2024, Tesla had a Sharpe Ratio of 0.88 [5].
This example underscores the Sharpe Ratio’s value in measuring total portfolio risk, making it a powerful tool for comparing investments across different asset classes.
One of the Sharpe Ratio’s biggest advantages is its versatility. It works well when comparing portfolios across various asset classes - stocks, bonds, real estate, or commodities - because it doesn’t depend on a specific market benchmark. By capturing the total risk picture, it’s especially useful for portfolios that aren’t fully diversified. If your portfolio includes individual stocks or is heavily concentrated, the Sharpe Ratio accounts for both market-wide risk and the unique volatility of your holdings [4].
However, the Sharpe Ratio isn’t perfect. It assumes that returns follow a normal distribution, or bell curve. But in reality, many investments - like hedge funds or strategies involving options - produce skewed returns with occasional extreme outcomes. In these cases, standard deviation fails to reflect the true risk [5][3].
For well-diversified portfolios, the Sharpe Ratio can also overestimate risk. This is because it includes volatility that diversification has already smoothed out, making it less effective when you're only concerned with market risk [4].
"Bell curves were adopted for mathematical convenience, not realism." - Benoit Mandelbrot and Nassim Nicholas Taleb [5]
The Treynor Ratio is a tool used to measure the excess return a portfolio generates for each unit of market-related risk it takes on. Unlike the Sharpe Ratio, which considers total risk, the Treynor Ratio zeroes in on systematic risk - the type of risk tied to overall market movements - assuming unsystematic risk has already been diversified away. This distinction makes it particularly useful for evaluating portfolios that are already well-diversified.
The formula is straightforward:
(Portfolio Return - Risk-Free Rate) ÷ Beta
Here, beta represents how sensitive your portfolio is to market fluctuations. For example, a beta of 1.0 means the portfolio tends to move in sync with the market.
"Treynor's objective was to find a performance measure that could apply to all investors regardless of their personal risk preferences." - Jack L. Treynor
Jack Treynor, one of the key figures behind the Capital Asset Pricing Model (CAPM), developed this ratio to help investors determine if their portfolio's performance justifies the market risk it carries.
The Treynor Ratio refines portfolio evaluation by focusing exclusively on market risk. Its calculation is simple:
(Portfolio Return - Risk-Free Rate) ÷ Beta
Let’s break it down with an example:
Imagine a 10-year scenario where the market return is 10% and the risk-free rate is 5%. Manager B delivers a 14% annual return with a beta of 1.03, resulting in a Treynor Ratio of approximately 0.087. Meanwhile, Manager C achieves a 15% return but with a beta of 1.20, yielding a Treynor Ratio of about 0.083. Even though Manager C had a higher absolute return, Manager B's portfolio showed better risk-adjusted performance.
Now, let’s consider a real-world case. Between 2008 and mid-2012, AAII analyst Wayne Thorp compared Pfizer (PFE) and Wynn Resorts (WYNN). Wynn generated higher raw returns but had a beta of 2.36, making it more than twice as volatile as the S&P 500. Pfizer, with a beta of just 0.71, achieved a Treynor Ratio of 9.5%, compared to Wynn's 8.3%. This example illustrates how a portfolio with lower absolute returns can still deliver superior performance when adjusted for risk.
It’s worth noting that a higher Treynor Ratio generally signals better risk-adjusted returns. However, the ratio becomes undefined if beta is negative.
The Treynor Ratio is particularly effective for evaluating well-diversified portfolios, such as mutual funds or index funds, where unsystematic risk is minimized. By isolating market risk, it provides a clearer picture of a portfolio manager’s ability to outperform the market. This makes it especially useful when comparing performance against broad benchmarks like the S&P 500.
"The premise behind this ratio is that investors must be compensated for the risk inherent to the portfolio, because diversification will not remove it." - Investopedia
While the Treynor Ratio is powerful, it’s not without its shortcomings. Its primary limitation is that it ignores unsystematic risk - the risk tied to specific companies or sectors. This means it may not fully account for the risks in portfolios that are not well-diversified.
Another drawback is its reliance on historical data. Since beta and returns can fluctuate over time, the Treynor Ratio’s insights are not guaranteed to predict future performance. Additionally, the choice of benchmark for beta is critical; for example, using the S&P 500 to measure the beta of a small-cap fund might understate the actual risk.
For portfolios with concentrated holdings or heavy exposure to specific sectors, the Sharpe Ratio - which considers total risk - might offer a more complete picture.
Sharpe Ratio vs Treynor Ratio Comparison Chart
When it comes to understanding how risk is measured, the Sharpe and Treynor Ratios take distinctly different approaches. The Sharpe Ratio evaluates total risk by considering standard deviation, which includes both systematic (market) and unsystematic (specific) risks. On the other hand, the Treynor Ratio zeroes in on systematic risk by using beta, which reflects the portfolio's sensitivity to market movements.
Take the S&P 500 as an example. Over a 10-year period, the market delivered a 10% return, with an 18% standard deviation and a 5% risk-free rate. This resulted in a Sharpe Ratio of 0.278. For the Treynor Ratio, the calculation simplifies because the market's beta is always 1.0. Therefore, the Treynor Ratio for the general market equals the market return minus the risk-free rate.
| Feature | Sharpe Ratio | Treynor Ratio |
|---|---|---|
| Risk Type Measured | Total Risk (Systematic + Unsystematic) | Systematic Risk (Market Risk only) |
| Denominator (Risk Metric) | Standard Deviation (σ) | Beta (β) |
| Formula | (Portfolio Return - Risk-Free Rate) / σ | (Portfolio Return - Risk-Free Rate) / β |
| Ideal Application | Best for non-diversified portfolios | Best for diversified portfolios |
| Primary Goal | Measure reward-to-total-volatility | Measure reward-to-market-volatility |
These distinctions are essential for determining which ratio aligns better with your portfolio's structure.
Once you understand how each ratio measures risk, the next step is to consider your portfolio's diversification. The level of diversification directly impacts which metric will give you the most accurate insights. If your portfolio is concentrated or represents your entire wealth, the Sharpe Ratio is the better choice. It accounts for all types of volatility, including unsystematic risk, which diversification could otherwise mitigate.
"For portfolios that are not well-diversified, the Sharpe ratio may be more appropriate since it accounts for total risk, including the portion that can be diversified away." - SmartAsset Team
On the flip side, the Treynor Ratio is tailored for portfolios that are already well-diversified, such as mutual funds or institutional investments. It focuses solely on market risk, making it ideal for comparing these portfolios against benchmarks. However, keep in mind that the Treynor Ratio's accuracy depends on using the right benchmark. For instance, using the S&P 500 to calculate beta for a small-cap fund would likely underestimate the true risk, leading to skewed results.
Choosing the right ratio ensures you're accurately evaluating risk-adjusted returns, which is crucial for making informed investment decisions.
The Sharpe Ratio shines when you're dealing with an undiversified portfolio or individual securities. If your investment represents your entire wealth, it gives you a complete picture by factoring in total volatility - capturing both market-wide fluctuations and risks specific to the asset. It’s also a go-to tool for comparing investments across different asset classes like stocks, bonds, or real estate [4].
For instance, if your portfolio lacks diversification, specific risks are still in play. A Sharpe Ratio of 4 would mean the investment generated an excess return four times higher than the total risk it introduced [7]. However, when your assets are diversified, a different metric might be more appropriate.
The Treynor Ratio, on the other hand, is ideal for well-diversified portfolios or when assessing professional fund managers. Once you’ve spread your investments across various securities and sectors, unsystematic risk fades into the background. What then matters is the extra return you’re earning for the market risk you’re still exposed to [1][4].
This ratio is particularly useful when portfolio-specific risks are no longer a concern, making it a strong choice for evaluating mutual funds or institutional portfolios relative to market benchmarks. Just make sure beta is calculated using a relevant benchmark to ensure an accurate reflection of risk.
The choice between these two ratios depends on how diversified your portfolio is. For undiversified portfolios or when comparing investments across asset classes, the Sharpe Ratio is your best bet. For diversified portfolios benchmarked against the market, the Treynor Ratio is more appropriate [4].
"The Sharpe ratio is ideal for comparing investments across different asset classes or individual securities, while the Treynor ratio is best suited for evaluating the performance of portfolios, particularly those benchmarked against market indices." – SmartAsset Team [4]
Using both ratios alongside other performance measures can give you a more rounded view of risk-adjusted returns, helping you make smarter investment decisions [1][2].
When deciding between the Sharpe and Treynor Ratios, consider the nature of your portfolio. The Sharpe Ratio is best suited for concentrated portfolios or individual securities, as it measures total risk using standard deviation. On the other hand, the Treynor Ratio focuses exclusively on systematic risk through beta, making it ideal for diversified portfolios where unsystematic risk has already been minimized.
Evaluating returns alone doesn’t tell the full story. Risk-adjusted performance metrics provide a clearer picture of whether your investments are delivering value relative to the risks involved. By analyzing both ratios alongside other performance measures, you gain a more nuanced understanding of your portfolio’s effectiveness.
The choice of ratio depends on your specific investment scenario. If you’re evaluating a single stock or a sector-specific fund, the Sharpe Ratio captures the total volatility you face. Meanwhile, for mutual funds or portfolios benchmarked against indices like the S&P 500, the Treynor Ratio highlights how effectively market risk is being managed.
For growth-stage companies, using data-driven tools like the Sharpe and Treynor Ratios is essential. Organizations such as Phoenix Strategy Group integrate these metrics into their FP&A systems to align investment performance with strategic goals and diversification efforts. Incorporating these insights ensures a more robust approach to evaluating investments.
Ultimately, the right metric depends on your portfolio composition, investment objectives, and the specific questions you aim to answer about risk and return. Remember, no single figure tells the whole story - context and benchmark comparisons are key to making informed decisions.
To get the most out of the Treynor Ratio, it’s important to maintain a well-diversified portfolio. Diversification helps reduce unsystematic risk - those risks specific to individual securities - by spreading investments across various sectors. This ensures that the portfolio's risk is primarily tied to beta, which reflects the market-related (systematic) risk. If your portfolio lacks diversification, the Treynor Ratio might not give you reliable insights.
The Sharpe Ratio can still offer valuable insights even when your investment returns deviate from a normal distribution. However, it’s essential to approach its interpretation carefully. This is because the Sharpe Ratio is built on the assumption that returns follow a normal distribution, and factors like skewness or heavy tails can affect its reliability.
If your portfolio shows significant non-normality, it’s a good idea to pair the Sharpe Ratio with additional metrics, such as the Treynor Ratio, to get a broader understanding of your investment performance.
Beta zeroes in on systematic risk, which is tied to overall market fluctuations, while leaving out unsystematic risk, the kind that's specific to individual investments. This narrow focus can give an incomplete picture of a portfolio's total risk. On top of that, beta depends on historical data and assumes its relationship with the market remains steady. For assets with limited trading history or erratic price patterns, this assumption can fall apart, making the Treynor Ratio less dependable when assessing certain portfolios or investments.