Published on
December 9, 2025


Unit economics is the backbone of understanding your business's profitability per customer, product, or subscription. It’s about balancing revenue and costs at the unit level, and pricing is a key lever for improving metrics like contribution margin, LTV (lifetime value), and CAC (customer acquisition cost).
Here’s the takeaway:
To improve unit economics:
Accurate data and regular analysis are essential for optimizing pricing strategies and achieving sustainable growth.
Getting a handle on these fundamental metrics can refine pricing strategies, directly tying unit economics to profitability.
There are six key metrics to monitor closely. First, Customer Acquisition Cost (CAC), which reflects the total expense of acquiring a single customer. This includes marketing costs, sales salaries, commissions, and tools. Next is Customer Lifetime Value (LTV), an estimate of the total gross profit a customer generates during their time with your business. The LTV:CAC ratio shows whether your pricing and cost structure deliver enough value compared to the expense of acquiring customers, with a typical benchmark being 3:1.
The CAC payback period measures how many months it takes for a customer's gross profit to cover their acquisition cost. For many SaaS companies, this falls between 12–18 months. Contribution margin highlights how much is left after subtracting variable costs from revenue per unit, showing how each sale contributes to covering fixed costs and profit. Lastly, gross margin demonstrates overall pricing effectiveness by dividing gross profit by revenue. In SaaS, margins of 70–80% or more are often the goal.
To calculate CAC, divide total sales and marketing expenses by the number of new customers acquired. For instance, if you spend $120,000 in a quarter and gain 300 customers, your CAC is $120,000 ÷ 300 = $400 per customer.
Determining LTV involves multiplying your average revenue per user (ARPU) per month by your gross margin percentage, then by the average customer lifetime in months. With an ARPU of $100/month, a gross margin of 70%, and a 36-month customer lifetime, LTV equals $100 × 0.70 × 36 = $2,520. The LTV:CAC ratio is then calculated as $2,520 ÷ $400 = 6.3:1.
To find the CAC payback period, divide CAC by the monthly gross profit per customer. Using the same example, $400 ÷ ($100 × 0.70) = 5.7 months. The contribution margin is calculated as (Revenue per unit – Variable cost per unit) ÷ Revenue per unit, while gross margin is found using (Revenue – Cost of goods sold) ÷ Revenue.
For example, if a SaaS company charges $50/month with a 60% gross margin over 24 months, the LTV comes to $720. Raising the price to $75/month boosts LTV to $1,080, improves the LTV:CAC ratio from 3:1 to 4.5:1, and shortens the CAC payback period to about 5.3 months. This illustrates how price adjustments can dramatically improve unit economics and shape competitive pricing strategies for U.S.-based growth-stage companies.
Accurate calculations rely on precise data management. This includes clean bookkeeping with clearly defined revenue and expense accounts in U.S. dollars, along with separating cost of goods sold from operating expenses to correctly compute gross and contribution margins. A robust CRM and billing system is essential for tracking customer start dates, plan changes, churn dates, and invoicing, which are critical for calculating ARPU, churn rates, and customer lifetime accurately. Additionally, detailed marketing and sales data by channel is necessary for an accurate CAC calculation.
Phoenix Strategy Group specializes in helping growth-stage companies align their bookkeeping, data engineering, and CFO services to ensure accurate metrics. By integrating finance and revenue operations, they transform raw data into actionable insights.
Rob Mulvin, Founder and CEO of All Pro Shade, shared: "As a home service business owner, understanding complex financials and Unit Economics always seemed overwhelming - until we started working with Phoenix Strategy Group."
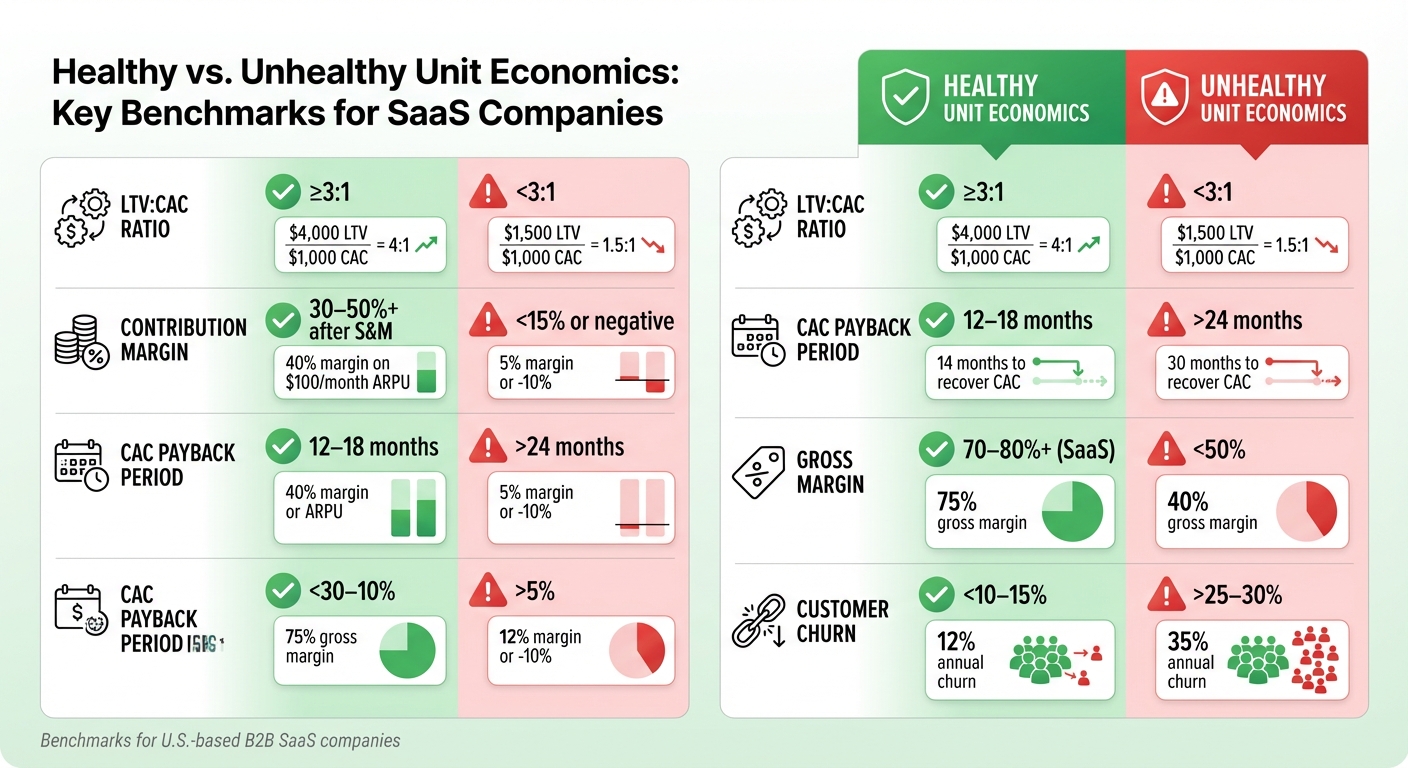
Healthy vs Unhealthy Unit Economics Benchmarks for SaaS Companies
To identify pricing issues, it's essential to evaluate core metrics and compare them against expected benchmarks. Some warning signs to watch for include a negative or very low contribution margin, which suggests revenue barely covers variable costs. An LTV:CAC ratio below 3:1 is another red flag - anything below 1:1 is unsustainable and points to significant pricing challenges. Similarly, CAC payback periods longer than 18–24 months can drain cash reserves, making it tough for businesses, especially SaaS companies, to grow. Ideally, SaaS businesses aim for a 12–18 month payback period.
Other indicators of pricing problems include declining or stagnant ARPU even after product improvements, which might result from excessive discounting or undervalued features. Rising CAC without a corresponding increase in LTV eats into profitability over time, while high churn rates in specific plans or price points often highlight a mismatch between perceived value and pricing.
To dig deeper, breaking these metrics down by segment can uncover areas where pricing strategies need adjustment.
Examining unit economics at the segment level - whether by customer type, product line, or acquisition channel - can reveal where pricing strategies are underperforming. By isolating key metrics like CAC, LTV, LTV:CAC, contribution margin, and payback period for each segment (e.g., enterprise versus SMB customers, product tiers, or acquisition channels like paid search or outbound sales), businesses can identify underperforming areas. Often, these segments struggle due to high support costs, low retention, or reliance on heavy discounts.
For instance, research shows that B2B companies using segment-based pricing achieve 30–50% higher LTV compared to those sticking to a one-size-fits-all approach. Some segments can even deliver 5–7x higher LTV, making a strong case for creating specialized enterprise plans with higher pricing and advanced features. Phoenix Strategy Group, for example, helps growth-focused companies implement detailed segment analysis by integrating financial data with CRM and billing systems, allowing them to uncover actionable insights.
This type of analysis helps clarify which metrics are falling short and which are exceeding expectations.
| Metric | Healthy Benchmark | Unhealthy Red Flag | Example (Healthy) | Example (Unhealthy) |
|---|---|---|---|---|
| LTV:CAC Ratio | ≥3:1 | <3:1 | $4,000 LTV / $1,000 CAC = 4:1 | $1,500 LTV / $1,000 CAC = 1.5:1 |
| Contribution Margin | 30–50%+ after S&M | <15% or negative | 40% margin on $100/month ARPU | 5% margin or -10% |
| CAC Payback Period | 12–18 months | >24 months | 14 months to recover CAC | 30 months to recover CAC |
| Gross Margin | 70–80%+ (SaaS) | <50% | 75% gross margin | 40% gross margin |
| Customer Churn | <10–15% | >25–30% | 12% annual churn | 35% annual churn |
Sometimes, metrics can present a mixed picture. For instance, a strong LTV:CAC ratio might coexist with an extended CAC payback period. In such cases, businesses can explore trade-offs, like switching to annual prepayment models to improve cash flow or refining acquisition channels to reduce CAC. The ultimate goal is to achieve sustainable growth - where pricing not only covers acquisition and service costs but also supports a healthy cash flow for the long term.
If your unit economics show weak margins or an unbalanced LTV:CAC ratio, it might be time to rethink your pricing strategy. Options include raising list prices, refining pricing tiers, or even switching to a different pricing model. For example, increasing list prices directly boosts average revenue per user (ARPU) and improves margins. On the other hand, refining or introducing tiered pricing can cater to customers with varying needs and budgets. Companies with strong tiered pricing structures often see growth rates increase by 25% and experience 20–30% lower customer acquisition costs (CAC) for tier upgrades compared to acquiring entirely new customers [1].
Another option is to adopt usage-based or hybrid pricing models, which link revenue to actual consumption - like API calls, data usage, or active users. This approach can significantly increase ARPU for heavy users while safeguarding gross margins. To make this shift work, you’ll need detailed usage data for each customer, accurate per-unit cost metrics (like cloud expenses per gigabyte), and a solid understanding of how price changes might impact churn. The key is to keep monthly bills within a reasonable range (e.g., $80–$150/month for U.S. customers) while improving contribution margins and the LTV:CAC ratio.
Before implementing pricing changes, scenario modeling can help you predict their impact. Start by building a cohort sheet that includes customer counts, ARPU, churn rates, and upgrade probabilities for each segment. Link this to a pricing assumptions sheet with details like list prices, discount rates, and usage tiers. Together, these tools can forecast monthly and annual recurring revenue, as well as potential expansion revenue under different scenarios.
Don’t forget to include a churn module that accounts for price sensitivity. Use historical data to fine-tune how churn might change with a price adjustment. For example, if you’re considering raising prices from $49 to $59 per month, model scenarios where churn stays the same, increases by 3%, or rises by 8%. The focus should be on net revenue impact, not just churn. A slight increase in churn might be acceptable if ARPU and margins grow enough to offset it.
It’s also smart to set guardrails to protect your business. For instance, you might aim to keep annual logo churn below 8–10% for enterprise customers. Tools like Phoenix Strategy Group’s integrated models can further enhance your projections by syncing CRM and billing data, giving you a clearer picture of potential outcomes.
Once you’ve modeled different scenarios, compare their results to ensure your pricing strategy aligns with both your unit economics and market conditions.
The pricing model you choose can have a big impact on your unit economics. For instance, value-based pricing often delivers the strongest results, with LTV:CAC ratios exceeding 5:1 and gross margins between 80% and 90%. However, it typically requires a more hands-on sales process and a product with a clearly measurable business impact.
Usage-based models, on the other hand, offer high lifetime value potential and gross margins of 75–85%, making them ideal for products where revenue scales with customer usage. Meanwhile, tiered pricing strikes a balance, with gross margins of 70–80% and payback periods between 9–15 months. This approach works well for products with diverse user needs and feature differentiation.
Here’s a quick comparison of common pricing models:
| Pricing Model | Typical Payback Period | Gross Margin | Best Use Case |
|---|---|---|---|
| Flat-Rate | 12–18 months | 70–75% | Simple products with a similar user base |
| Tiered | 9–15 months | 70–80% | Feature-rich products for diverse customer needs |
| Usage-Based | 12+ months (initially) | 75–85% | Products with clear usage metrics tied to value |
| Value-Based | 6–12 months | 80–90% | Solutions with measurable business impact |
The right pricing model depends on your product and market. If your product’s value grows with usage, incorporating usage-based pricing could be a smart move. If your customer base has a wide range of budgets and needs, a tiered approach might be the better fit.
To create a solid benchmark dataset, start by combining internal metrics like LTV (lifetime value), CAC (customer acquisition cost), LTV:CAC ratio, gross margin, CAC payback period, ARPU (average revenue per user), and churn rate. Break these down by product line, customer type (like SMBs vs. enterprise), and acquisition channel. Then, layer in external market standards for comparison.
For external benchmarks, dig into industry reports, public SaaS investor presentations, and financial guides. Look for businesses that align with your model, customer segments, annual contract values, and U.S. market focus. For example, if you’re a B2B SaaS company targeting mid-market customers with annual contract values between $30,000 and $80,000, ensure your comparisons reflect that range - not enterprise or SMB-focused data.
Standardize your data by using U.S. dollars, consistent time frames, and clear metric definitions, such as CAC. Always record benchmarks as ranges instead of single figures. For example, an LTV:CAC ratio might fall between 3–5:1, a CAC payback period could range from 12–18 months, and gross margins might hover between 70–85%. This approach gives you a realistic target zone rather than a rigid number.
These benchmarks serve as a foundation for setting accurate pricing targets.
Once you’ve established benchmark ranges, translate them into actionable pricing targets. For instance, if the market standard for LTV:CAC is 3:1 and your CAC is $1,000, you’ll need about $111 in monthly gross profit per customer. This means your minimum list price should be roughly $148 before discounts.
Set clear guardrails to guide your sales and finance teams. For example:
You might also set specific rules, like avoiding deals with a contribution margin below 60% or limiting enterprise discounts to 25% unless the LTV is at least twice the segment average.
Regularly review your benchmarks - quarterly is a good cadence - and use them to test different scenarios. For example, if you’re considering a 10% price hike for your Pro tier, model how this would impact your payback period and LTV:CAC compared to market norms. This keeps your pricing strategy grounded in both internal performance and external market trends.
Here’s an example of how a U.S.-based B2B SaaS company might compare its metrics against targets and market ranges:
| Metric | Current | Target | Market Range |
|---|---|---|---|
| LTV:CAC Ratio | 2.1:1 | 3.5:1 | 3–5:1 |
| CAC Payback Period | 16 months | 12 months | 12–18 months |
| Gross Margin | 68% | 75% | 70–85% |
| Monthly Churn Rate | 3.2% | 2.0% | 1.5–3.0% |
| ARPU (Monthly) | $142 | $175 | $150–$200 |
This table highlights areas needing attention. For instance, a low LTV:CAC ratio or a long CAC payback period might signal the need to tweak pricing or tighten discounts. On the flip side, an 8:1 LTV:CAC ratio paired with low churn could indicate underpricing, suggesting room to increase prices.
If you’re looking for deeper insights into aligning unit economics with pricing strategies, Phoenix Strategy Group offers expert guidance. They specialize in detailed internal and external benchmark analyses to help businesses refine their pricing models and drive sustainable growth. Their strategic and financial expertise ensures your pricing aligns with both your market and your long-term goals.
Pricing isn't a one-and-done task; it's an ongoing process that thrives on precision and adaptability. By continuously tracking key metrics and making timely adjustments, pricing evolves from a guessing game into a data-driven strategy that fuels growth.
Investors in the U.S. now prioritize companies with efficient, data-supported pricing models. Metrics like an LTV:CAC ratio above 3:1, payback periods under 12–18 months, and gross margins in the 70–80% range have become benchmarks for success in SaaS and growth-stage businesses. Companies that hit these targets through disciplined pricing strategies, thoughtful packaging, and controlled discounting not only boost their valuations but also position themselves for successful exits. These fundamentals inspire investor trust and drive sustainable growth.
To stay competitive, refine your pricing strategy today. Start by defining your unit, calculating segment-specific economics, identifying weak areas, and testing targeted pricing changes. This hands-on, iterative process ensures your pricing aligns with your growth goals and strengthens your financial foundation.
If you need expert guidance with building dashboards, modeling scenarios, or fine-tuning benchmarks, Phoenix Strategy Group offers tailored support. Their financial and strategic expertise helps growth-stage companies transform unit economics into a powerful competitive edge, ensuring your pricing strategy supports both immediate results and long-term scalability.
Improving your LTV:CAC ratio - the relationship between customer lifetime value (LTV) and customer acquisition cost (CAC) - is all about finding the right balance between driving more value from customers and keeping acquisition costs in check.
Here’s how you can work on it:
Keep a close eye on your unit economics and compare your performance to industry standards to spot opportunities for growth. For deeper insights and tailored strategies, consider collaborating with experts like Phoenix Strategy Group, who specialize in helping businesses optimize these critical metrics.
If your pricing strategy isn't lining up with your unit economics, there are a few warning signs you should keep an eye on:
Spotting any of these issues is a cue to revisit your pricing approach. Aligning it with your unit economics is crucial for long-term growth and profitability.
Understanding your unit economics is the first step in selecting the right pricing model for your SaaS business. This means diving into the revenue and costs tied to serving just one customer. Pay close attention to metrics like Customer Acquisition Cost (CAC), Customer Lifetime Value (CLV), and gross margins. These numbers will help ensure your pricing strategy supports long-term profitability.
Looking at what competitors are charging can also offer helpful context. But don’t fall into the trap of simply copying their prices - your pricing should reflect the distinct value your product brings to the table. As your business grows, regularly reassessing and tweaking your pricing model will help you stay competitive and drive continued growth.