Published on
January 7, 2026


WACC (Weighted Average Cost of Capital) is a crucial metric for assessing a company’s financial health and valuation. It represents the average return required by investors - both equity and debt holders. For growth companies, calculating WACC can be tricky due to evolving capital structures and limited historical data. This guide simplifies the process and highlights key considerations for accurate WACC estimation.
By following a structured approach and testing assumptions with sensitivity analysis, you can ensure your WACC calculation is reliable and reflective of your business's financial reality.
The formula for Weighted Average Cost of Capital (WACC) is:
WACC = (E/V × Re) + [(D/V × Rd) × (1 - T)] + (P/V × Rp) [8][2][1].
Here’s what each component represents:
The Cost of Equity (Re) is determined using the Capital Asset Pricing Model (CAPM):
Re = Risk-free Rate + Beta × Market Risk Premium [8][2].
The Cost of Debt (Rd) reflects the interest rate on loans or the yield to maturity on bonds [8][2]. The Corporate Tax Rate (T) provides a "tax shield", as interest payments are tax-deductible, reducing the effective cost of debt [8][4]. If your company has Preferred Stock (P), include its dividend yield (Rp) in the calculation [8][1].
For growth companies, it’s common to use net debt (total debt minus cash) instead of total debt [7][5]. For instance, in 2020, Apple Inc. reported $112.436 billion in total debt and $38.016 billion in cash, resulting in a net debt of $74.420 billion. This adjustment significantly impacted the debt portion of Apple’s WACC calculation [5][7].
WACC and Cost of Equity are applied differently in valuation.
It’s important to align cash flows with the correct rate: use nominal WACC for nominal cash flows and real WACC for real cash flows [8][1].
Growth companies often experience rapid shifts in their capital structure. For example, they may start equity-heavy after a funding round but later add venture debt to extend their runway. To account for these changes, it’s best to use a target capital structure, reflecting the expected long-term financing mix, rather than relying on the current snapshot [1][9].
The tax shield adjustment is another key consideration. Early-stage companies that haven’t yet turned profitable should skip the (1 - T) adjustment in the cost of debt calculation. Since they lack taxable income, the interest deductions don’t apply, meaning the factor defaults to 1.0 [2].
For companies without a long trading history, beta can be estimated using the industry median unlevered beta, which is then adjusted (re-levered) to match the target capital structure [10][1]. Financial managers typically use a market risk premium between 5% and 8% [7][5].
For example, in April 2021, IBM’s beta was reported as 0.97 by MarketWatch and 1.25 by Yahoo! Finance. Using a 3% risk-free rate and an 8% market risk premium, IBM’s cost of equity ranged from 10.76% to 13.0%, depending on the beta used [7][5].
Next, we’ll walk through the steps to calculate WACC with these components.
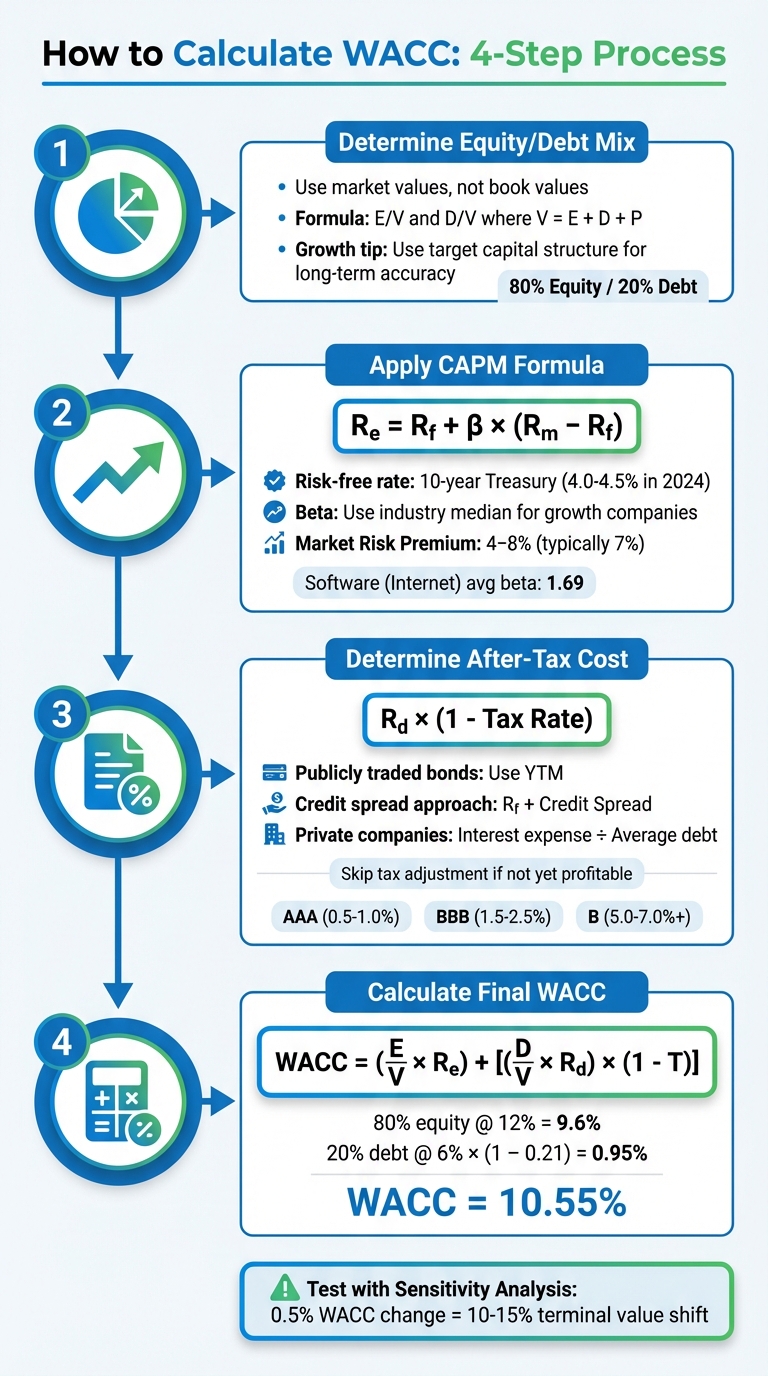
4-Step WACC Calculation Process for Growth Companies
Your capital structure is essentially the mix of debt and equity funding your business operations [6][11]. The first step is figuring out what percentage of your total capital comes from each source.
To get accurate results, use market values instead of book values, as the latter might undervalue equity and overstate debt [12][13]. For public companies, this is straightforward - just use the market capitalization for equity. For private companies, you can rely on the post-money valuation from your most recent funding round.
Next, divide each component (equity, debt, and any preferred stock) by the total capital (V = E + D + P). For example, if your equity is worth $80 million and your debt totals $20 million, your structure is 80% equity and 20% debt.
Growth companies face a unique challenge here. Your current capital structure might not reflect your long-term plans. For instance, if you've just raised a Series B, your structure may be equity-heavy. But if you’re planning to add venture debt, this will shift. That’s why it’s crucial to define a target capital structure [12][13].
"If the current capital structure may not reflect the capital structure that is expected to prevail over the life of the business... best market practice is to define a target capital structure." – Laurens Tijdhof, Zanders [13]
To set your target structure, consider your current market-value structure, compare it to similar public companies, and align it with your long-term financing strategy [13]. Once you’ve established your target, keep it consistent throughout your forecasts to avoid unnecessary recalibration [12].
| Approach | Pros | Cons |
|---|---|---|
| Current Capital Structure | Reflects actual, immediate costs; simple for public companies [12] | Might be temporary or less ideal; creates circularity issues for private firms [13] |
| Target Capital Structure | Better reflects long-term stability; useful for rapidly changing companies [12][13] | Involves subjective judgment about future financing [13] |
Once your target structure is ready, you can move on to calculating your cost of equity using the CAPM model.
The Capital Asset Pricing Model (CAPM) is commonly used to estimate the cost of equity [10]. The formula is:
Re = Rf + β × (Rm – Rf)
Risk-Free Rate:
Use the 10-year U.S. Treasury yield as your risk-free rate, as it aligns with long-term cash flows. In late 2024, this rate hovered between 4.0% and 4.5% [10]. Make sure the maturity of the rate matches your forecast period.
Beta (β):
Beta measures how sensitive your company is to market movements. For growth companies with limited trading history, use the median unlevered beta of comparable public companies, then adjust (or "re-lever") it to match your target capital structure [10]. Adjusted betas account for mean reversion, which can provide more accurate results.
For context, as of January 2025, Software (Internet) companies had an average beta of 1.69, while Software (System & Application) companies averaged 1.24 [14]. Beta values can vary depending on the source. For instance, in April 2021, IBM's beta ranged from 0.97 (MarketWatch) to 1.25 (Yahoo! Finance), resulting in a cost of equity between 10.76% and 13.0%, assuming a 3% risk-free rate and an 8% market risk premium [5].
Equity Risk Premium (ERP):
ERP represents the extra return investors demand over risk-free investments. This typically ranges from 4% to 8%, with historical averages around 7% [10]. If your company operates in emerging markets, you should add a country-specific risk premium to account for additional geopolitical or economic risks [10].
After calculating your cost of equity, the next step is determining your cost of debt.
Calculating the cost of debt is generally more straightforward than equity, but it can be tricky for growth companies with limited credit history or no publicly traded bonds.
Three methods to estimate cost of debt:
If you lack a formal credit rating, you can create a "synthetic" rating by comparing your financial ratios (like interest coverage) to those of rated peers [6]. Here’s a reference for credit spreads:
| Credit Rating | Spread Over Risk-Free Rate | Risk Profile |
|---|---|---|
| AAA | 0.5% – 1.0% | Extremely Low Risk |
| BBB | 1.5% – 2.5% | Moderate Risk |
| BB | 3.0% – 5.0% | Non-Investment Grade |
| B | 5.0% – 7.0%+ | High Risk / Speculative |
Tax Shield Adjustment:
Since interest payments are tax-deductible, you need to adjust for taxes:
After-Tax Rd = Rd × (1 – Tax Rate) [8][10].
However, if your company isn’t profitable yet, you can skip this step since you won’t benefit from tax deductions.
As of January 2025, the average pre-tax cost of debt for Software (Internet) companies was 5.78%, while Drugs (Biotechnology) companies averaged 7.58% [14]. For instruments like convertible notes or SAFEs, break them into their debt and equity components to reflect your actual financing mix [13].
With your capital structure weights, cost of equity, and after-tax cost of debt in hand, you’re ready to calculate the Weighted Average Cost of Capital (WACC). The formula is:
WACC = (E/V × Re) + [(D/V × Rd) × (1 - T)]
Here’s what each term represents:
For example, let’s say you’re working with an 80/20 equity-to-debt split, a 12% cost of equity, a 6% pre-tax cost of debt, and a 21% tax rate. Plugging these values into the formula gives you a WACC of about 10.55%.
One critical detail: make sure your WACC matches your cash flow type - nominal or real. A mismatch here could throw off your entire valuation [8].
Once you’ve calculated your base WACC, it’s important to test its reliability. Even small changes in inputs can cause large shifts in valuation. For instance, a 0.5% change in WACC can alter terminal value by 10% to 15%. Considering that terminal value often accounts for 60% to 80% of the total value in a discounted cash flow (DCF) model, these shifts are no small matter [10].
To test your WACC, analyze how key variables - like beta, equity risk premium, or your debt-to-equity ratio - affect valuation. Take this example: in a 2024 analysis of Nvidia, reducing the expected market return from 10% to 9% lowered the WACC from 13.44% to 12.75%, which significantly impacted the enterprise value [3].
For growth companies, beta tends to be especially volatile. In April 2021, IBM’s beta ranged from 0.97 (MarketWatch) to 1.25 (Yahoo! Finance). Depending on the source, this translated to a cost of equity between 7.85% and 13.0% [5]. This kind of variability highlights why it’s better to work with a WACC range instead of a single number. For mature companies, a range of 2% to 3% (e.g., 8% to 11%) is typically sufficient. Anything wider than 5% becomes too broad to guide meaningful decisions [16].
Even with precise calculations, certain errors can skew your WACC and throw off your valuation.
First, avoid using book values for equity. Book values reflect historical costs and often undervalue a company’s market capitalization. For instance, when the Price/Book ratio exceeds 4.5x, relying on book values inflates the weight of debt in your calculation, artificially lowering the WACC [17][4].
Another common pitfall is overlooking the tax shield on debt. Always adjust your cost of debt to account for tax savings by using the formula: Rd × (1 - Tax Rate) [6][12].
Be cautious about outdated valuations when determining your capital structure weights. If your company raised a Series B six months ago but has grown significantly since then, relying on that old post-money valuation will distort your equity weight. Instead, update market values regularly or use a target capital structure based on comparable companies and your long-term financing plans [13].
Lastly, make sure the duration of the risk-free rate aligns with your cash flow projection period. If you’re forecasting cash flows over a 10-year horizon, use the 10-year Treasury yield - not the 30-year rate [10].
WACC (Weighted Average Cost of Capital) isn’t just a number on a spreadsheet - it’s a critical tool for making informed capital allocation decisions. To calculate WACC accurately, you need to use current market values for capital structure weights, factor in tax-shield adjustments, and validate your assumptions through sensitivity analysis[4]. Instead of focusing on a single WACC figure, it’s more practical to work with a range of estimates to better account for uncertainties.
"The WACC is recognized as one of the most critical parameters in strategic decision-making. It is relevant for business valuation, capital budgeting, feasibility studies and corporate finance decisions"[13].
For growth-focused companies, WACC does more than act as a discount rate - it becomes a benchmark for evaluating investments. Projects with returns below the WACC risk reducing shareholder value. For instance, as of March 2024, the average WACC in the information technology sector was 11.3%, notably higher than the 7.9% average in the consumer staples sector[18]. Knowing where your company fits within this range can help guide smarter, more strategic capital investments.

Applying WACC principles effectively can be complex, especially for growth-stage companies with limited resources. That’s where expert support makes a difference. Phoenix Strategy Group offers fractional CFO services and FP&A systems designed to integrate WACC monitoring into your overall financial strategy. Instead of treating WACC as a one-time calculation for a pitch deck, their approach ensures it becomes a dynamic tool for capital planning.
Phoenix Strategy Group specializes in financial modeling and valuation tailored to the unique needs of growing businesses. Their services include calculating beta using industry benchmarks, addressing risk premiums, and factoring in illiquidity discounts for private firms[15]. They also provide data engineering solutions to normalize financial statements and keep market value estimates up to date. Whether you’re preparing for fundraising, evaluating M&A opportunities, or making capital budgeting decisions, their expertise ensures WACC is applied effectively across your strategic goals.
Estimating beta for growth-stage companies without historical price data might seem tricky, but it's definitely doable. A widely used approach is relying on industry beta averages. By analyzing publicly traded companies operating in the same industry or with comparable business models, you can calculate an average beta. From there, you can tweak it to better align with your company's unique risk factors.
Another option is to work with expert financial advisors or use specialized valuation tools designed for growth-stage businesses. These resources can help provide a more customized and precise beta estimation, especially when you're gearing up for funding rounds or making strategic decisions. If necessary, you can also refine the beta to reflect differences in your capital structure or the specific operational risks your company faces.
Market values offer a snapshot of a company's current economic standing, reflecting the real-time structure of its capital. This makes them a more reliable indicator when calculating the cost of capital. On the other hand, book values rely on historical data, which often fails to account for shifts in market conditions, leading to less precise WACC estimates.
By using market values, the weights assigned to debt and equity in the WACC formula better represent their actual economic importance. This approach helps businesses, particularly those in growth phases, make smarter financial decisions by providing a clearer picture of their capital costs.
A target capital structure is a strategic tool for growth-stage companies, helping them strike the right balance between debt and equity as they expand. By adhering to a planned mix, businesses can keep their weighted-average cost of capital (WACC) steady - a critical factor when assessing new investments and showcasing solid returns to potential investors.
This strategy also carefully weighs the tax advantages of debt against the dangers of over-leveraging, minimizing swings in valuation and improving the accuracy of enterprise value assessments. On top of that, it serves as a roadmap for planning future funding rounds, securing better terms in negotiations, and signaling strong financial discipline. These elements are essential for boosting growth prospects and increasing overall company value.