Published on
May 9, 2026

In 2026, hotels face rising costs in labor, insurance, and energy, making benchmarking a critical tool for maintaining profitability. By comparing key performance metrics like RevPAR, ADR, and GOPPAR against industry standards or competitors, hotels can identify performance gaps, adjust strategies, and protect margins. For example, hotels using benchmarking effectively report 15–22% higher profitability annually.
Key metrics include:
Benchmarking also aids in financial planning, real-time decision-making, and adapting to market shifts. Tools like AI-driven dashboards improve pricing accuracy and forecasting, while sustainability metrics are increasingly influencing guest loyalty and investment decisions. Hotels leveraging advanced benchmarking methods and AI see up to 22% gains in RevPAR and improved operational efficiency.
To thrive, hotels must integrate benchmarking into daily operations, select accurate data sources, and align metrics with financial goals. This approach ensures smarter decisions and stronger margins in a competitive market.
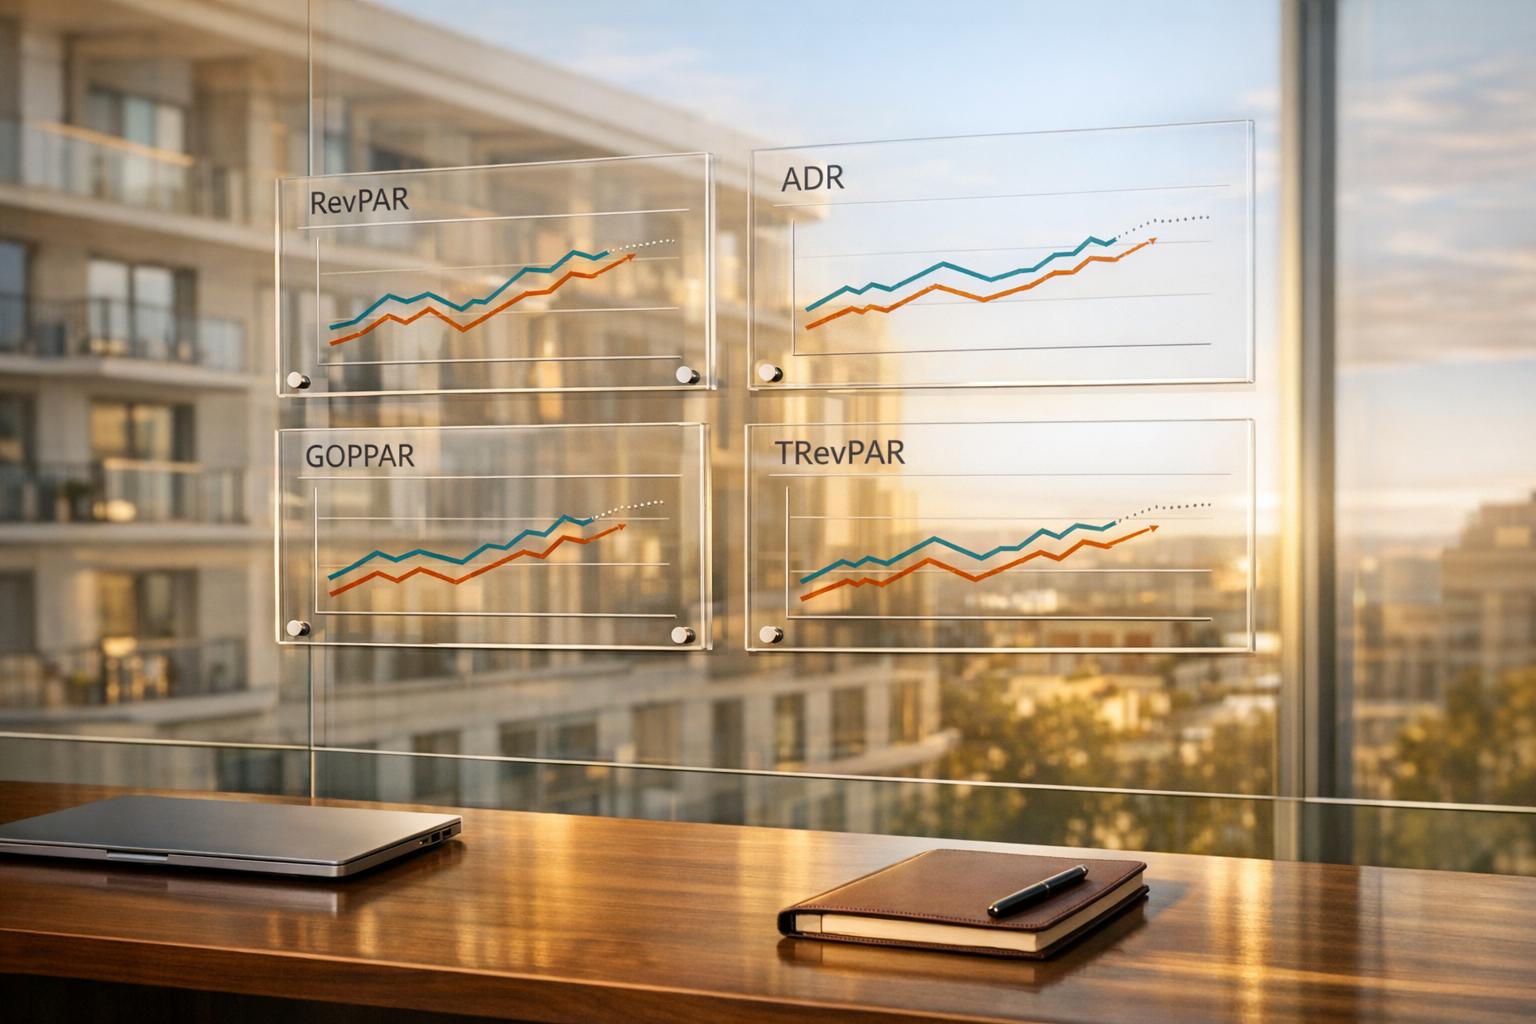
Hotel Performance Metrics Comparison: Key KPIs and Industry Benchmarks 2026
Understanding how to calculate and interpret essential metrics can turn raw data into actionable insights, guiding hotels toward better profitability.
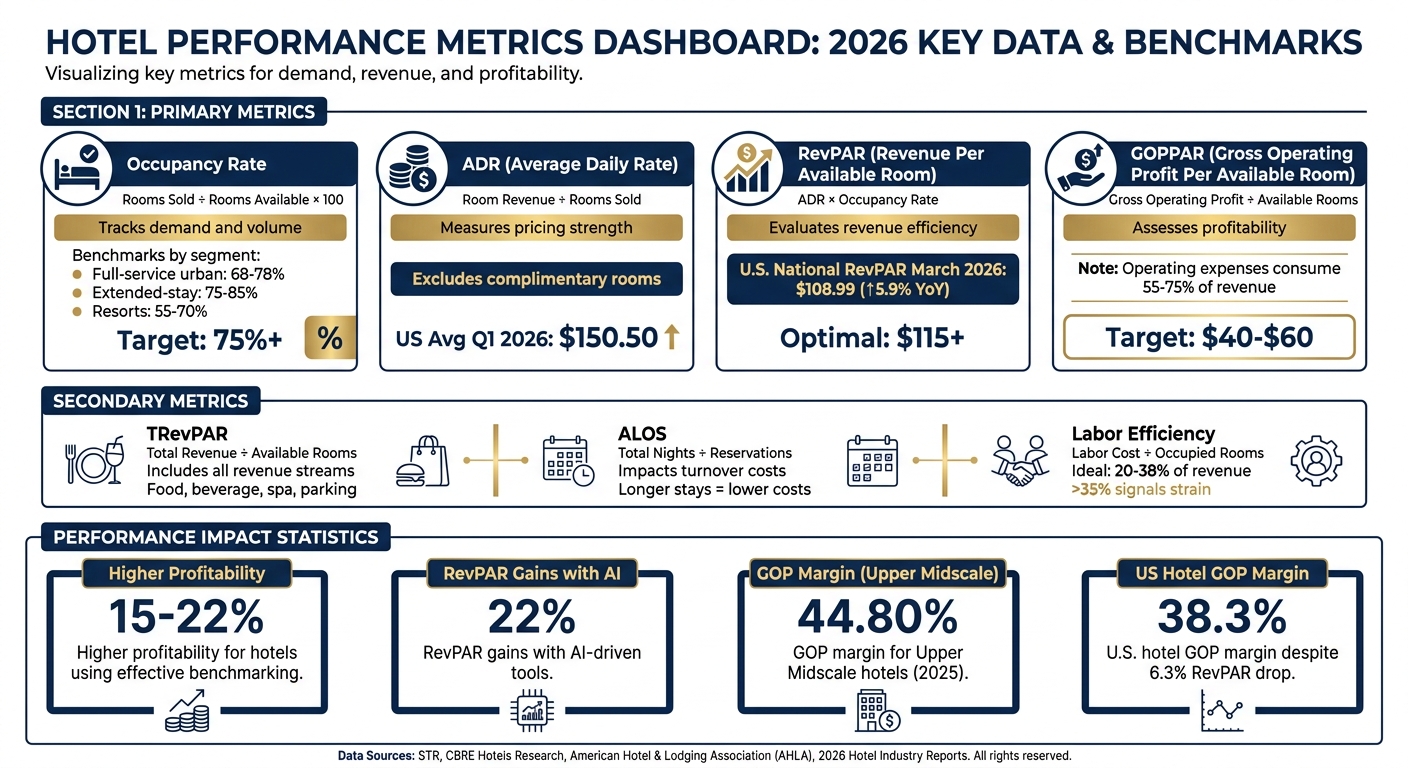
Four key performance indicators serve as the backbone of hotel benchmarking: Occupancy Rate, Average Daily Rate (ADR), Revenue Per Available Room (RevPAR), and Gross Operating Profit Per Available Room (GOPPAR)[8].
Occupancy Rate gauges how much demand a property is capturing. It’s calculated by dividing the number of rooms sold by the total rooms available, then multiplying by 100. Rooms that are out of order should be excluded from the available count to avoid skewing results[8]. Typical benchmarks vary: full-service urban hotels aim for 68%–78%, extended-stay properties target 75%–85%, and resorts often settle between 55% and 70% due to seasonal fluctuations[9].
Average Daily Rate (ADR) reflects a hotel’s pricing power. To find it, divide total room revenue by the number of rooms sold, excluding complimentary and staff accommodations from the calculation[8]. ADR benchmarks can differ widely depending on the market and segment.
RevPAR combines occupancy and pricing into a single metric that measures efficiency. You can verify RevPAR by multiplying ADR by Occupancy Rate or dividing total room revenue by the total number of available rooms[8]. For example, in March 2026, the U.S. national RevPAR was $108.99, marking a 5.9% increase compared to the previous year[3]. RevPAR is especially useful for understanding the balance between rates and occupancy; for instance, raising ADR by 15% while losing 20% in occupancy could lead to an overall revenue decline[9].
GOPPAR goes beyond revenue to measure profitability per available room after accounting for operating expenses. While RevPAR focuses on revenue generation, GOPPAR highlights how much of that revenue translates into profit. With operating expenses often consuming 55%–75% of revenue, focusing on rate-driven RevPAR rather than occupancy-driven growth can help improve GOPPAR[8][9].
| Metric | Formula | Purpose |
|---|---|---|
| Occupancy Rate | Rooms Sold ÷ Rooms Available | Tracks demand and volume |
| ADR | Room Revenue ÷ Rooms Sold | Measures pricing strength |
| RevPAR | ADR × Occupancy Rate | Evaluates revenue efficiency |
| GOPPAR | Gross Operating Profit ÷ Available Rooms | Assesses profitability |
Primary metrics focus on revenue and profit, but secondary metrics dig into operational performance and guest behavior - factors that influence both costs and repeat business.
Total Revenue Per Available Room (TRevPAR) broadens the scope by including all revenue streams, such as food and beverage, spa services, and parking. It’s calculated by dividing total revenue by the total number of available rooms[10]. A steady RevPAR alongside a declining TRevPAR could indicate underperformance in ancillary services[11].
Average Length of Stay (ALOS) directly impacts operational costs. It’s determined by dividing total nights booked by the number of reservations[10]. Longer stays reduce room turnover, which can lower housekeeping and administrative expenses. Offering stay-based discounts can encourage guests to extend their visits[10].
Labor Efficiency per Occupied Room is a key measure of operational health. This metric tracks total labor costs relative to the number of occupied rooms, ensuring personnel expenses are well-managed. Ideally, labor should account for 20%–38% of total revenue, with ratios above 35% potentially signaling financial strain[1]. For instance, Upper Midscale hotels achieved a GOP margin of 44.80% in 2025, outperforming luxury properties due to leaner operations[6].
Channel Conversion Rates and Distribution Mix are also critical. While online travel agencies (OTAs) may deliver similar ADRs as direct bookings, their commission fees can significantly impact net revenue. Tracking which channels generate the highest net revenue after accounting for distribution costs helps hotels optimize their marketing investments[10].
Together, these metrics help identify whether challenges stem from external market forces or internal inefficiencies. For example, even with a 6.3% drop in RevPAR, U.S. hotels in 2025 improved their GOP margins by 1.1 percentage points to 38.3%, thanks to disciplined cost management[12][5].
When it comes to benchmarking, choosing the right competitive set and reliable data sources is essential. These decisions shape the quality of insights you can gain and directly influence strategic outcomes.
The competitive set you select can make or break your benchmarking efforts. The aim is to reflect the way travelers shop for accommodations, rather than simply grouping nearby properties.
Start with location, but don't stop there. Consider factors like star ratings, amenities, and pricing. For example, a budget motel and a high-end boutique hotel on the same street aren't true competitors[14]. If you're in a specific price tier, compare yourself to properties within that same range. Similarly, market segments are key - a hotel catering to business travelers should benchmark against others targeting the corporate market, not leisure-focused properties[13][14].
Keep your compset manageable - five to ten properties is ideal. This ensures anonymized data and accurate comparisons[17]. Make it a habit to review and adjust your competitive set at least twice a year. Market dynamics like new openings, renovations, or brand changes can shift the competitive landscape, so staying updated is crucial[14].
"Too many hoteliers mistake benchmarking for strategy. It's a mirror, not a map. If you're only measuring what everyone else measures, you're running a race to the middle." - Industry Analyst, STR[15]
This quote emphasizes the importance of selecting your compset strategically. Avoid adding weaker competitors just to make your metrics look better. Hotels that excel in benchmarking discipline saw a 14% year-over-year growth in gross operating profit in 2024, compared to only 2% growth for those with less rigorous methods[15].
Once you've nailed down your compset, the next step is ensuring your data sources are reliable and up-to-date.
Accurate benchmarking starts with dependable data. CoStar/STR is a leader in this space, offering insights from a vast sample of 94,000 hotels and 12 million rooms worldwide. Their STAR reports provide weekly and monthly performance metrics, with just a one-week lag for weekly data[16][17].
HotStats, now part of Actabl, specializes in tracking profitability and operational metrics like GOPPAR and labor efficiency, going beyond just revenue numbers[5]. For smaller markets or independent hotels, Benchmarking Alliance offers regional data that can fill gaps where global providers might lack coverage[13][16].
Today, over 90% of global hotel chains utilize advanced benchmarking tools for daily performance tracking[15]. However, the quality of your insights depends on the quality of your data. Always opt for providers that source data directly, rather than relying on estimates or projections.
"There's no other source to get a full holistic view of the entire market as opposed to just learning about hotels but being able to see other facets of various industries that are also affecting market dynamics." - Brandon Burtis, VP, Revenue Strategy, Pacifica Hotels[18]
This insight highlights the value of comprehensive data. It’s not just about understanding your property - it’s about grasping the broader market dynamics. Hotels leveraging AI-based benchmarking tools have seen a 17% improvement in pricing accuracy and a 12% boost in conversion rates[15]. By combining a well-chosen competitive set with high-quality data, you lay the groundwork for smarter, more effective decision-making.
The hotel industry in 2026 is being reshaped by advancements in technology and shifting guest preferences. To stay competitive, it’s essential for hotel operators to grasp these trends and adapt their strategies. By combining well-established metrics with emerging insights, the focus now includes the growing influence of AI and eco-conscious practices on revenue management.
Projections for 2026 place global hotel revenue at a staggering $950 billion, a 6.8% jump from the previous year[19]. However, this growth isn’t spread evenly. Luxury and upper-upscale hotels are thriving, with RevPAR surging by 9.2%, while budget and midscale properties face challenges due to rising costs impacting lower-income travelers[19][7].
The industry is increasingly adopting Total Revenue Management (TRM), a strategy that optimizes all income streams, not just room revenue. For instance, food and beverage now account for 20% of total revenue, events contribute 7%, and wellness services add 5%[19]. By focusing on these areas alongside room rates, hotels can maximize the value of each guest’s stay.
Direct bookings have grown to 28% of total reservations, thanks in part to AI chatbots handling over 60% of guest inquiries. This shift reduces reliance on OTA commissions and streamlines operations. Meanwhile, the line between business and leisure travel continues to blur, with 60% of business trips now including leisure extensions, presenting opportunities for upselling and longer stays[19].
"Only 34% of hotels use AI revenue management, yet it delivers the highest ROI of any technology investment. This means 66% of hotels are leaving 15-22% RevPAR on the table." - OtelCiro Industry Analysis[19]
AI is proving transformative in demand forecasting, achieving accuracy rates of 90-94% for 30-day outlooks, compared to 70-75% for manual methods[20]. Hotels leveraging AI-driven dynamic pricing report RevPAR improvements of 15-22%[19]. Despite these benefits, only 34% of hotels have adopted AI revenue management, giving early adopters a significant edge.
Major events also play a role in revenue trends. For example, the 2026 FIFA World Cup is expected to boost RevPAR by 40-80% in host cities during match weeks[19]. In San Francisco, a tech-sector resurgence led to a 31% RevPAR increase in Q1 2026[7]. Hotels using real-time demand intelligence to adjust pricing strategies are outperforming those relying on static methods.
Sustainability has become a key focus for the industry. The Cornell Hotel Sustainability Benchmarking (CHSB) Index 2026 reviewed data from approximately 31,000 hotels worldwide, tracking metrics like carbon emissions, energy use, water consumption, and waste management[21]. Now in its twelfth year, this report highlights how environmental performance has become a standard part of hotel operations, influencing both investment decisions and guest loyalty.
Environmental, Social, and Governance (ESG) metrics are increasingly integrated into broader operational indices, alongside AI and business intelligence tools[22]. Sustainability is no longer treated as a separate initiative - it’s now a core performance measure.
Technology plays a crucial role in meeting sustainability benchmarks. For instance, IoT and smart room systems have been shown to cut energy use by an average of 12%[19]. However, adoption is low, with only 15% of hotels implementing these systems, leaving plenty of room for differentiation. By investing in IoT, hotels can achieve measurable efficiency gains while aligning with stricter environmental standards.
One of the biggest hurdles is data accuracy. Only 15% of hoteliers feel confident in the accuracy of their operational data, citing fragmented systems as a major challenge[22]. For sustainability metrics to be reliable and comparable, hotels need to unify their data systems.
AI is revolutionizing benchmarking by shifting from historical analysis to real-time decision-making. Modern AI platforms analyze over 50 demand signals - such as competitor pricing, local events, weather, and market trends - for each pricing decision[19]. This allows hotels to respond quickly to demand changes and fine-tune pricing strategies for different guest segments, something manual methods simply can’t match.
"The next evolution in hotel revenue management isn't a faster dashboard or a smarter pricing algorithm – it's an AI copilot." - Harikrishna Patel, Co-Founder, Hotel Switchboard[20]
AI copilots are already handling 60-70% of routine tasks, saving managers 15-20 hours a week and enabling them to oversee 22 or more properties[20]. In one case study, the RevEVOLVE RM Copilot delivered a +13.7% RevPAR increase and near-sellout occupancy in just 10 days[20].
Natural language interfaces are also making it easier to access benchmarking data. Revenue managers can now query performance metrics conversationally, eliminating the need to sift through spreadsheets. This reduces decision-making time from hours to minutes, which is critical during high-demand periods with short booking windows[19].
Despite these advancements, only 25% of hoteliers feel prepared to adopt AI, while 40% say they are not ready at all[22]. The main barrier is data fragmentation - 27% of hotels use more than seven platforms, making AI integration difficult[22]. To unlock AI’s full potential, hotels must first consolidate their data systems. Once this is achieved, predictive demand modeling and cross-department collaboration emerge as the most valuable AI applications for 2026[22].
Start by setting clear goals to determine which metrics you should focus on. Are you aiming to boost market share, fine-tune pricing strategies, or streamline operations? Your objectives will shape the data you prioritize [30,16]. Once your goals are clear, identify 5–10 comparable properties within your market segment to benchmark against [30,18].
Tracking too many metrics can overwhelm your team. While over 90% of global hotel chains now rely on advanced benchmarking tools daily, it's critical to stay focused [15]. Stick to essential KPIs like RevPAR (Revenue Per Available Room), ADR (Average Daily Rate), and Occupancy. You might also include TRevPAR (Total Revenue Per Available Room) to account for revenue from non-room services like dining, spa treatments, or events [13,18]. To illustrate the impact of disciplined tracking, hotels in the top benchmarking quartile increased their gross operating profit by 14% year-over-year in 2024, compared to just 2% for those with weaker tracking routines [15].
Instead of reacting to daily fluctuations, use rolling averages to monitor metrics on a monthly or quarterly basis [30,16]. This method helps you identify long-term trends. For example, if you notice a consistent dip in Thursday occupancy over several months, it might be time to adjust your pricing or marketing efforts targeting midweek business travelers [11].
Once you've nailed down your metrics, incorporating real-time data can take your benchmarking to the next level.
Real-time dashboards offer a centralized view by syncing directly with your Property Management System (PMS) [23]. This ensures that your revenue management, front desk, and finance teams all work from the same up-to-date data every day.
In today’s fast-paced market, moving from monthly reviews to daily monitoring is no longer optional [18,31]. AI-powered dashboards, for instance, have been shown to improve pricing accuracy by 17% and increase conversion rates by 12% [15]. These tools allow you to compare your performance against competitors in real time, enabling quick adjustments like reducing reliance on OTAs during high-demand periods or fine-tuning rates for specific guest segments [13,16].
"With AI, benchmarking stops being about yesterday's news. It's about spotting the signal before anyone else sees it." – Senior Product Manager, futurestays.ai [15]
Pick dashboards that are intuitive for your entire team. The aim is to eliminate manual data entry so your staff can focus on executing strategies [23]. Look for platforms that refresh data daily and stick to tracking your most critical KPIs to avoid unnecessary complexity [15].
Armed with real-time insights, you can seamlessly integrate benchmarking data into your financial planning.
Benchmarking becomes even more impactful when it’s directly tied to cash flow forecasting and FP&A systems. For instance, if data suggests a drop in Thursday business travel, you can adjust financial projections and labor schedules ahead of time [11]. Combining historical data with current trends - like occupancy rates and booking pace - can guide decisions on staffing and pricing [32,18].
Establish a review schedule that aligns with your financial planning cycle. Daily reviews might focus on metrics like occupancy and ADR, while weekly meetings could cover booking trends and guest feedback. Monthly sessions might dive into revenue performance and costs, and quarterly reviews can address broader goals like technology investments or strategic initiatives [24]. Using tools like the Market Penetration Index (MPI) and Revenue Generation Index (RGI) can help you determine whether changes in performance are due to internal strategies or external market factors [13].
For hotels in growth stages or preparing for investor presentations, linking benchmarking insights to financial planning is essential. A company like Phoenix Strategy Group (https://phoenixstrategy.group) provides fractional CFO services and FP&A support to help hotels translate performance data into actionable financial strategies.
Finally, balance occupancy with profitability by keeping an eye on GOPPAR (Gross Operating Profit Per Available Room) alongside RevPAR. Chasing full occupancy through aggressive discounting often leads to lower profit margins. Hotels that focus solely on occupancy typically see margins around 17%, while those balancing RevPAR and guest satisfaction achieve closer to 29% [15]. The ultimate goal is ensuring that increased volume translates to actual profit after accounting for operational expenses [32,33].
Benchmarking has shifted from being a "nice-to-have" tool to an essential strategy for hotels navigating today’s challenging market. In January 2026, U.S. RevPAR saw a modest 0.4% year-over-year growth - the first increase since March 2025 [4]. This marks the end of the "rate power" era and the beginning of what industry experts call the "operational truth" era [6]. Hotels can no longer depend on rising ADR to cover inefficiencies. Instead, success now hinges on leveraging benchmarking to safeguard margins, align labor costs with demand, and create forecasts grounded in real market data. This new phase requires integrating real-time insights into financial strategies.
The move from static annual budgets to adaptive, ongoing forecasts is now critical. Rigid annual budgets resulted in an 11.9% revenue shortfall by Q3 2025 [6]. Only dynamic planning and real-time data can help hotels address structural cost challenges - like outdated labor models or brand requirements that fail to deliver ROI - before profitability suffers [2].
To capitalize on these insights, specialized advisory services can help transform raw data into actionable strategies. For growth-stage hotels or properties preparing for investors, turning performance data into practical plans is key. Phoenix Strategy Group (https://phoenixstrategy.group) offers services such as fractional CFO support, FP&A assistance, and cash flow forecasting to help hotels convert benchmarking insights into decisions that enhance profitability. Their approach combines real-time data integration with strategic advice, ensuring metrics like RevPAR and GOPPAR directly shape decisions on staffing, pricing, and capital allocation. This seamless connection between operational metrics and financial strategy completes the benchmarking cycle, enabling smarter decision-making across the organization.
Benchmarking is more than just understanding your position against competitors. It’s about using that knowledge to make quicker, smarter choices. Whether it’s adjusting labor schedules for a 2% occupancy change, focusing pricing strategies on contribution margins instead of volume, or redefining competitive sets to reflect shifting market dynamics, consistent benchmarking is what separates thriving hotels from those that merely stay afloat.
Deciding whether to focus on RevPAR (Revenue per Available Room) or GOPPAR (Gross Operating Profit per Available Room) comes down to your strategic goals.
RevPAR measures how effectively a hotel generates revenue by combining occupancy rates and Average Daily Rate (ADR). It's a great metric if your focus is on boosting revenue and improving market position.
On the other hand, GOPPAR zeroes in on profitability by factoring in operating costs. This makes it especially useful when managing tight margins or during periods of slow revenue growth.
Your choice should align with what you're aiming to achieve - whether it's driving revenue or optimizing profitability.
To select the right compset for your hotel, focus on comparing your property to others with similar characteristics. Key factors to consider include your target audience, location, and services offered. A thoughtfully chosen compset allows for more accurate comparisons and helps you analyze essential metrics like occupancy, ADR (Average Daily Rate), and RevPAR (Revenue Per Available Room). This process delivers insights that can help you better understand your market position and make well-informed strategic decisions.
To make the most of AI dashboards in hospitality, it's crucial to have access to real-time, detailed data from various sources like booking systems, guest databases, financial tools, property management systems (PMS), and online travel agencies (OTAs). Important metrics to focus on include occupancy rates, average daily rate (ADR), revenue per available room (RevPAR), guest satisfaction scores, and operational performance data. When this data is well-integrated and reliable, it allows for more precise forecasting, tailored guest experiences, and streamlined operations - empowering you to make smarter decisions and boost overall hotel performance.