Published on
May 10, 2026

Customer segmentation isn't just about grouping customers - it’s about identifying which groups bring in the most profit while costing the least to serve. When done effectively, segmentation can reduce Customer Acquisition Costs (CAC) by 25–40%, shorten sales cycles by 30–50%, and improve win rates by up to 40%.
To measure the success of your segmentation efforts, focus on these key metrics:
Advanced metrics like Incremental Revenue per Recipient (IRPR), engagement rates (e.g., email open and click-through rates), and Contribution Margin per Customer (CMC) can provide deeper insights into profitability and performance.
Start small with 3–7 key segments, track baseline metrics, and use dashboards for real-time monitoring. Treat each segment like a profit center to allocate resources where they’ll deliver the best results.
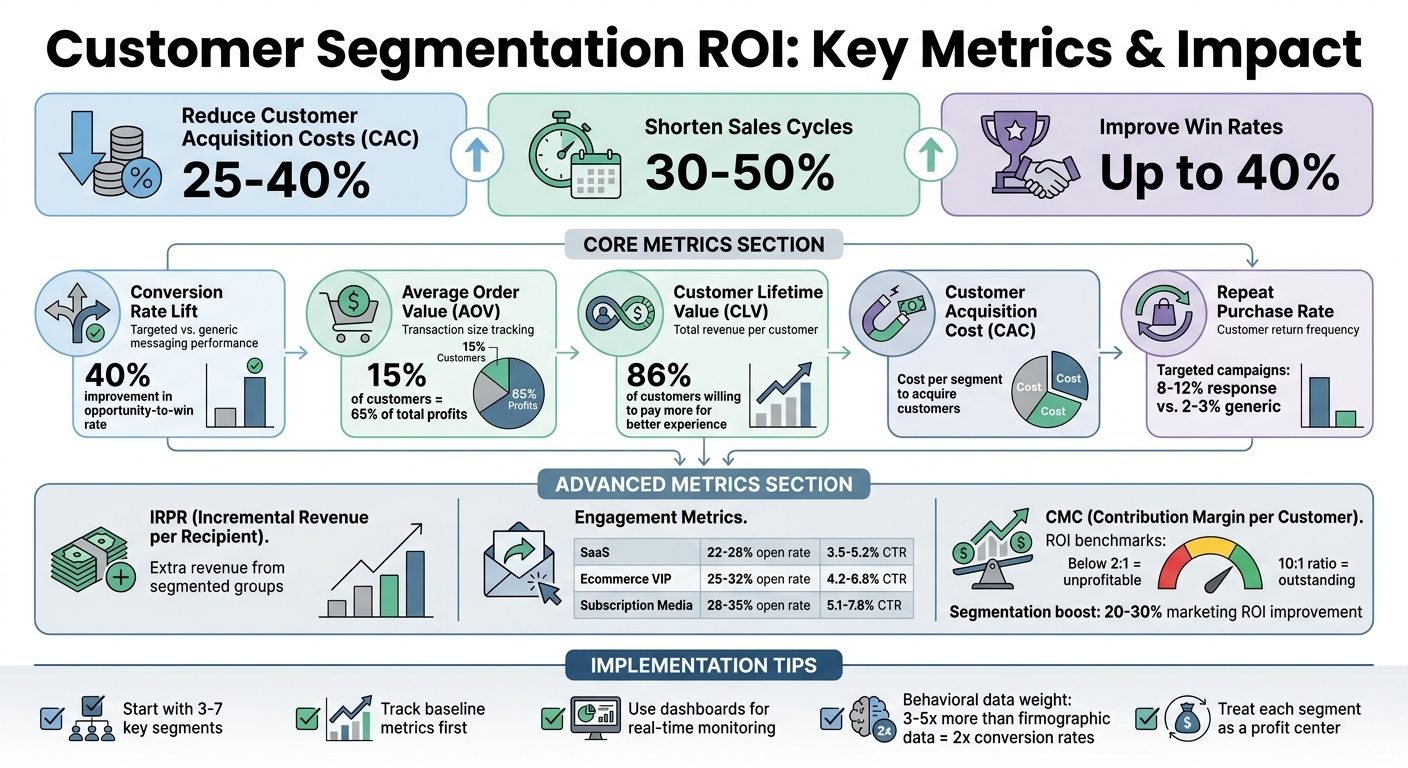
Customer Segmentation ROI: Key Metrics and Performance Benchmarks
Tracking the right metrics can show whether your segmentation efforts are truly driving results or just adding extra work. These metrics highlight various aspects of financial performance, from conversion rates to long-term customer value.
This metric measures how much better targeted messaging performs compared to generic communication. If conversion rates across segments are nearly the same, your segmentation model might not be detailed enough to make a difference [3].
"Segmentation effectiveness is the degree to which your segments change outcomes." - The Pedowitz Group [3]
Analyze conversion rates at different stages of the funnel - like moving from Marketing Qualified Lead (MQL) to Sales Qualified Lead (SQL), or from demo to closed deal. For example, one B2B tech company streamlined its segments into four needs-based groups, boosting their opportunity-to-win rate by 40% [3]. That’s the kind of improvement you want to aim for.
To measure accurately, establish baseline metrics and tag segments in your CRM for real-time tracking [3]. Use control groups to rule out external factors, like seasonal trends, and focus on leading indicators like meeting quality and stage progression in longer sales cycles [3].
Once you've nailed conversion rates, the next step is to see how segmentation influences transaction sizes through Average Order Value.
AOV helps determine if segmentation is encouraging higher spending per transaction. When you match offers to the right groups - like targeting "luxury-seeking trendsetters" with premium products - you should see larger transaction sizes [4][5].
This metric is particularly useful for assessing cross-sell and upsell strategies. For instance, if a segment engages with your messaging but shows low AOV, it could mean your offer or pricing strategy needs tweaking [3]. Combine AOV data with metrics like interaction velocity and win rate to identify your most lucrative segments [6][3].
In e-commerce, 15% of customers often account for 65% of total profits [5]. Automating tracking in your CRM allows you to monitor which segments are driving higher spending in real time [3].
While AOV focuses on immediate spending, Customer Lifetime Value paints a bigger picture of profitability.
CLV helps distinguish your most valuable customers from those at risk of churning. It measures the total revenue a customer generates over their entire relationship with your business.
When customers feel understood through personalized communication, they stick around longer, spend more, and refer others at higher rates than paid channels [7]. In fact, 86% of customers are willing to pay more for a better experience, proving that personalization drives retention and profitability [7].
To calculate CLV, use RFM scoring (Recency, Frequency, Monetary value). Rank customers on a 1–5 scale for each factor, based on at least six months of transaction data [7]. For example, a "Champion" customer might score 5-5-5, while an "At-Risk" customer could show low recency despite previously high frequency. Refresh these scores monthly and incorporate data from support interactions for a more comprehensive view [7].
While CLV measures long-term value, managing acquisition costs ensures you're investing wisely from the start.
Segmentation can lower CAC by concentrating your marketing spend on high-potential groups instead of spreading it thin. By focusing on segments that convert well, you can significantly reduce the cost of acquiring new customers.
Track CAC for each segment by dividing total marketing and sales expenses by the number of new customers acquired from that group. Compare these numbers to your baseline to gauge improvement. If certain segments consistently show lower CAC, consider reallocating budget from less effective groups to maximize impact [3].
This metric reveals how well your segmentation encourages customers to come back for more. Tailored offers based on segment characteristics should naturally boost repeat purchases.
Monitor repeat purchase rates over time for each segment. If a loyal group starts showing declining rates, it could signal that your messaging or product offerings are no longer hitting the mark [7]. Set up automated CRM workflows to adjust your strategy when these shifts occur, such as triggering an "at-risk" sequence if recency drops [7].
Targeted campaigns often achieve response rates of 8–12%, compared to just 2–3% for generic outreach [7]. This higher engagement translates into more repeat purchases and better retention among your most valuable customers.
Once you've nailed down the basics like conversion rates, order value, and retention, it's time to dig deeper. Advanced metrics help you pinpoint which customer segments truly drive profit, giving you a sharper view of your segmentation ROI.
IRPR is a powerful metric for measuring the extra revenue each person in a segmented group generates compared to a control group that receives generic messaging. This approach lets you isolate the real impact of your segmentation strategy, eliminating noise from factors like seasonal trends or general promotions. To calculate IRPR, use the formula: (Treatment Revenue per Recipient) - (Control Revenue per Recipient).
"Stakeholders do not fund tools to increase a vanity metric; they fund tools that increase pipeline, revenue, and efficiency."
Start by defining a measurement window - commonly 7 to 30 days for ecommerce - and make sure your UTMs, conversion events, and attribution rules are consistent. Using holdout groups is key here, as it allows you to compare segmented messaging against generic campaigns. Breaking IRPR down by customer cohorts can also highlight underperforming segments, giving you a roadmap for improvement [9].
Once you've got a handle on revenue impact with the help of fractional CFO services, turn your attention to engagement metrics to see how well your segmentation strategy connects with your audience.
IRPR shows the dollars, but engagement metrics - like email open rates, click-through rates (CTR), and meeting rates - tell you how well your messaging resonates. For example, high-value SaaS customers often see open rates of 22–28% and CTRs of 3.5–5.2%. In ecommerce, VIP segments can reach open rates of 25–32% and CTRs of 4.2–6.8%. Subscription media audiences, like active subscribers, tend to hit open rates of 28–35% and CTRs of 5.1–7.8% [10].
Keep an eye on unsubscribe rates and spam complaints to ensure you're not overloading your audience. Use your CRM to tag campaigns with segment attributes, making it easier to compare segment-level engagement against overall performance. For accurate insights, aim for at least 100–200 data points per segment. Refresh segment criteria every 6–12 months, and set up automated rules to adjust segment assignments in real time as customer behavior shifts [10][3].
Once you've evaluated engagement, it's time to look at profitability with CMC.
CMC goes beyond revenue and engagement to reveal which segments are genuinely profitable. It’s calculated by subtracting the cost of goods or services from the total revenue generated by each customer or segment [8]. This metric shines a light on your most valuable segments - those who shop frequently, spend the most, and have been active recently [7].
Knowing your CMC helps you allocate resources effectively. For instance, you might assign senior sales reps to high-value accounts or prioritize enterprise clients with enhanced support [4][7].
As a benchmark, a 5:1 ratio is considered solid marketing ROI, while 10:1 is outstanding. On the flip side, anything below 2:1 usually isn’t profitable due to production and distribution costs [8]. Targeted campaigns based on segmentation can boost marketing ROI by 20–30% compared to generic outreach [7]. To stay ahead, set up automated CRM triggers that reclassify customers based on behavior changes, such as a drop in purchase frequency. This allows you to quickly launch retention or upsell strategies. Regularly updating customer scores - ideally monthly - ensures your segmentation reflects current buying habits [7].
Measuring segmentation ROI goes beyond just tracking metrics - it’s about creating a framework that highlights what’s working and where resources are being allocated. By combining baseline data with visual tools, you can make smarter, data-driven decisions.
Before making any changes, it’s essential to document the current performance of each segment. Track metrics like reach, engagement, MQL-to-SQL conversion rates, win rates, average contract value (ACV), sales cycle length, and churn [3]. This initial snapshot serves as your benchmark to evaluate the impact of segmentation efforts.
Start by defining 3–7 key segments with clear descriptions and tailored programs. Develop hypotheses for each segment - for example, "Enterprise healthcare accounts generate 20% higher ACV." Ensure your CRM and marketing automation tools have fields for segment tracking. Setting up control groups is also crucial to isolate the actual lift caused by segmentation [3].
"When you measure segmentation effectiveness this way, segments stop being labels and become operating levers - showing you where to focus, what to say, and how to invest." - The Pedowitz Group [3]
Treat each segment like a profit and loss center. This approach ensures accountability for revenue outcomes rather than just marketing activities [2]. In lengthy B2B sales cycles, where revenue data takes time to materialize, use leading indicators like engagement rates, meeting quality, and funnel progression to gain early insights [3].
Once baselines are set, the next step is turning raw data into actionable visuals.
With baseline data in place, visualization tools can help translate metrics into insights that drive action. Build standard dashboards in your CRM or marketing automation platform that break down metrics like engagement, funnel performance, pipeline progression, and revenue by segment. Include key indicators such as conversion rate lift and average order value (AOV) [3]. These dashboards should offer both absolute performance data and trends over time, with filters for campaigns and cohorts to allow deeper analysis.
Create scorecards to compare segment performance against control groups or the overall population. For example, a B2B tech company used such a dashboard and achieved a 40% improvement in opportunity-to-win rates while cutting customer acquisition costs by 25% [3].
Automate segment assignments using first-party data and behavioral triggers. This ensures consistent reporting across systems without manual intervention [3]. Use these dashboards during quarterly reviews and planning sessions to align leadership on budget priorities. For instance, when executives see that high-margin repeat customers deliver a 4x return compared to discount-driven buyers with less than a 1x return, reallocating resources becomes an easy decision [1].
To stay agile, set up automated alerts that notify you when segment metrics deviate from expectations [6]. This allows for quick adjustments before revenue takes a hit. The ultimate goal is to move from static reporting to a dynamic system that continuously highlights the value of segmentation.
| Capability | Before | After | Primary KPI |
|---|---|---|---|
| Reporting & Analytics | Limited or no segment-specific reports; reliance on spreadsheets. | Standard dashboards showing segment-level engagement, funnel, and revenue metrics. | Usage of Segment Dashboards; Time to Insight [3] |
| Data & Tagging | Manual tagging and ad hoc spreadsheets. | Automated workflows assigning segments based on first-party data. | Segment Data Completeness; Tagging Accuracy [3] |
| Governance | Sporadic segmentation updates; minimal training. | Regular governance with cross-functional input; segment data used in QBRs. | Segment Adoption in Plans; Revenue from Priority Segments [3] |
Segmenting effectively can turn marketing efforts into real profit drivers. By tracking segmentation ROI through key metrics like conversion rate lift, Customer Lifetime Value (CLV), IRPR, and contribution margin, you gain a clear understanding of which customer groups generate revenue and which ones drain resources.
Think of each segment as its own profit and loss center. This mindset helps you allocate resources wisely and can lead to impressive results, such as reducing Customer Acquisition Costs (CAC) by 25–40%, shortening sales cycles by 30–50%, and increasing win rates by 15–25% [2].
Start with 3–7 core segments and set clear benchmarks before making adjustments. Automate segment tagging within your CRM and marketing automation tools, and create dashboards that track both absolute performance and trends over time. Reviewing these metrics quarterly will help you decide which segments deserve more investment and which may need to be retired or combined.
Here’s a valuable perspective to keep in mind:
"Effective segments are stable enough to target, different enough to treat uniquely, and profitable enough to warrant that extra effort." - The Pedowitz Group [3]
The best-performing teams don’t just rely on static segmentation - they build a dynamic system that integrates seamlessly with their revenue operations. When behavioral data is given 3–5 times more weight than firmographic data, conversion rates from leads to opportunities often double [2]. If you’re working with limited resources, focus on mastering 1–2 high-potential segments first, then expand as you refine your strategy based on evolving customer behaviors.
To show that segmentation led to the improvement, compare how individual segments performed against clear benchmarks like engagement rates, pipeline growth, revenue figures, or cost metrics. Focus on highlighting noticeable differences in outcomes that clearly indicate segments are delivering measurable results compared to either a control group or the overall audience.
To make the most of your efforts, focus on audience segments that show clear and measurable differences in key metrics like engagement, conversion rates, revenue, or lifetime value. The ideal segments are ones that are stable, distinct, and profitable, while also aligning closely with your business goals.
Start by defining your criteria - this could include demographics, purchase behaviors, or other relevant factors. Compare the performance of these segments against your baseline metrics to identify areas of strength. Keep an eye on segments that show consistent improvement over time, as they often signal opportunities for growth.
On the flip side, don’t hesitate to refine or phase out segments that consistently underperform. By doing so, you’ll ensure your tracking efforts remain focused on segments that deliver the best return on investment.
Customer Lifetime Value (CLV) is a key metric that reveals the total revenue a customer contributes throughout their entire relationship with your business. It’s essential for determining whether the value a customer brings in exceeds the costs of acquiring and serving them. Metrics like Customer Acquisition Cost (CAC) and margin are equally important. CAC measures how cost-efficient your acquisition efforts are, while margin highlights your profitability. When combined, these metrics offer a well-rounded view of your ROI performance.