Published on
May 23, 2026


Real-time financial reporting systems transform how finance teams operate by providing up-to-date insights into metrics like cash flow, burn rate, and revenue. Traditional reporting methods - relying on manual processes and delayed data - often result in outdated reports that limit decision-making. A modern, automated system eliminates these inefficiencies, allowing businesses to access accurate, actionable financial data instantly.
By following these steps, businesses can reduce manual workload, improve decision-making speed, and scale their financial operations efficiently.
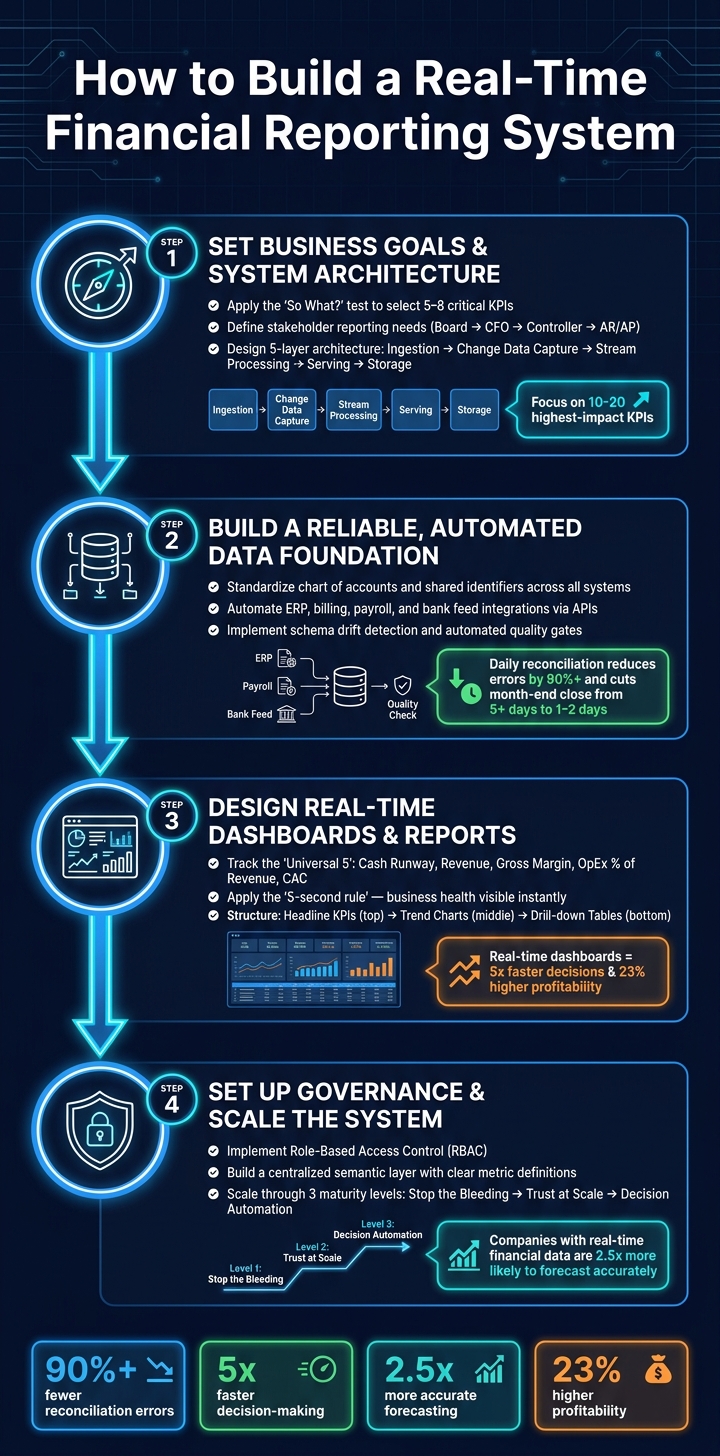
How to Build a Real-Time Financial Reporting System: 4-Step Process
Before diving into coding or connecting data, ask yourself: What decisions need to be made faster? The answer to this question will guide everything else - what metrics you track, how they're presented, and who gets access to them.
Use the "So What?" test when deciding which metrics to include. If a metric's change doesn’t prompt immediate action, leave it out. This approach keeps dashboards focused on the 5–8 critical KPIs that drive decision-making, such as net burn rate, cash runway, gross margin, and days sales outstanding (DSO) [3].
Next, define the roles and reporting needs of your stakeholders. For instance, a board member might only need high-level trends on a quarterly basis, while a controller requires detailed, daily transaction-level data. A one-size-fits-all dashboard won’t work - it’ll end up serving no one effectively. Here’s a breakdown of audience-specific needs:
| Audience | Purpose | Refresh Frequency | Detail Level |
|---|---|---|---|
| Board of Directors | Strategic oversight | Monthly/Quarterly | High-level trends |
| CFO / VP Finance | Performance management | Daily/Weekly | Summary with drill-down |
| Controller | Close management | Daily | Transaction-level detail |
| AR/AP Managers | Collections/Payments | Real-time/Daily | Customer/Vendor detail |
"A financial dashboard is not a technology project - it is a decision-making tool. The best dashboards are not the prettiest; they are the ones that tell you exactly what is happening and what to do about it." - ECOSIRE Team [3]
Don’t start with the dashboard - start with the foundation. Build a clean, connected data system first [4].
A modern real-time reporting stack consists of five key layers that work together seamlessly:
Each layer has a specific role, and skipping even one can lead to issues like reconciliation errors or outdated numbers [2].
For growing companies, scalability is key. Focus on decoupling compute from storage - this ensures your system can handle increasing data without ballooning costs or requiring more staff [2]. Start small, focusing on one high-value area like weekly cash flow or AR aging. This allows you to validate the system architecture early on and address any structural issues while they’re still manageable.
"If your current process has manual workarounds for bad data, automating it just makes bad outputs faster." - Alexander Nemeth [4]
After mapping out your architecture, the next step is ensuring the data flowing through it is dependable. Messy or inconsistent data can derail decision-making, so it's crucial to focus on standardizing and automating data processes to maintain integrity.
One of the main reasons financial automation fails isn’t the tools - it’s the data structure behind them. Before integrating any pipelines, make sure your chart of accounts is consistent across all entities. Shared identifiers, like department codes or customer IDs, should have the same meaning across every system you’re using [4].
To avoid confusion, create definition cards for every KPI. These cards should document details like grain, inclusions, exclusions, and the underlying business logic [6]. This step ensures everyone calculates metrics the same way. Without it, teams can end up debating whose numbers are correct instead of focusing on what the data reveals.
"The real frontier isn't AI or the cloud. It's data truth. Scraping systems don't fail because the code is bad - they fail because requirements and controls are vague." - Alex Yudin, Head of Data Engineering, GroupBWT [6]
Once you've standardized your data, the next move is automating connections between your source systems. Directly link your ERP (like NetSuite or SAP), billing platforms (such as Stripe), payroll systems, and bank feeds via APIs or automated connectors. This eliminates manual tasks like exporting CSVs and avoids the copy-paste errors that come with them [1].
Routine transactions that align cleanly can be automated, leaving only exceptions for manual review [4]. Within your pipeline, set up automated quality checks to block problematic data - like null values, duplicates, or broken references - before it reaches a dashboard [6]. Consider implementing schema drift detection as well. If a source system changes a column name in your ERP, your pipeline should catch it immediately to prevent downstream issues [6].
Even with automated processes, maintaining data quality requires ongoing reconciliation. Instead of reconciling monthly, move to daily or even real-time reconciliation at the transaction level. This approach can reduce reconciliation errors by over 90% and cut your month-end close process from more than five days to just one or two [4]. Relying solely on summary-level matching can mask discrepancies that only become apparent when you examine individual records.
Set up automated alerts to notify you immediately of reconciliation breaks. These alerts should include a predefined playbook and assign the issue to a specific owner for resolution [6]. Additionally, ensure every pipeline run is tagged with a unique Run ID. This allows you to trace any KPI back to its exact data source. As Alex Yudin notes, "If a metric cannot be reproduced from a logged pipeline run, it is not decision-grade." [6] This level of traceability is especially critical when dealing with investors or auditors.
Skipping this step can be costly. The manual effort required to prove data accuracy - often referred to as the "Reconciliation Tax" - can cost a mid-market company over $9,000 per month when factoring in analyst and leadership hours [6]. Automating reconciliation not only saves time but also cuts down on unnecessary overhead expenses.
Once your data is clean and automated, the next step is to transform it into insights that drive decisions. But here's the catch: a cluttered dashboard can be just as ineffective as having no dashboard at all. The goal is to create focused, actionable dashboards tailored to specific needs.
Start by identifying the metrics that matter most for your audience. Different stakeholders need different types of information. For instance, a board member might only need a high-level snapshot of the company’s strategic progress, while a controller will need detailed, transaction-level data to handle financial close processes and strategic management. Trying to cram all this into one dashboard? That’s a recipe for confusion.
No matter your industry, certain metrics are universally important for growth-stage companies. These are often called the "Universal 5" and include:
Beyond these, include metrics that align with your business model. For example, SaaS businesses should monitor Net Revenue Retention (NRR), aiming for targets between 110%–130%. Meanwhile, e-commerce companies might focus on metrics like Inventory Turnover or Cart Abandonment Rate [7].
One essential rule: provide context for every metric. Numbers alone don’t tell the full story. Include comparisons - like performance versus budget or the same period last year - along with trendlines covering 6–12 months and clear status indicators. As the ECOSIRE Research and Development Team aptly puts it, "A number without context is meaningless." [3] For example, a gross margin of 62% might seem fine at first glance, but if your target is 68% and the trend has been declining over three months, it’s a clear signal that action is required.
The layout of your dashboard is just as important as the data it displays. Follow the "5-second rule": within five seconds of opening the dashboard, a user should understand the overall health of the business [3]. Here’s a simple structure:
Drill-down functionality is non-negotiable. Users need to be able to click on summary numbers - like "Revenue" - and see the breakdown by customer, product, or region. Without this, teams can’t dig into discrepancies, which can lead to frustration and distrust. As ECOSIRE explains, "Summary numbers that cannot be explored are frustrating and breed distrust." [3] Also, standardize time periods (e.g., month-to-date compared to a pro-rated same period last month) to avoid misleading interpretations from incomplete data.
Finally, apply the "So What?" test to every metric on your dashboard [3]. If a 10% change in a metric wouldn’t trigger a discussion or decision, it doesn’t belong there. Aim to feature only 5–8 KPIs per view. The payoff? Companies using real-time financial dashboards make decisions 5x faster and see 23% higher profitability compared to those relying on traditional reporting methods [3].
Once you've established reliable data and actionable dashboards, the next step is to secure and expand your reporting system. Even the most polished dashboard loses its value if sensitive data ends up in the wrong hands or if reported figures can't be traced back to their source. Strong governance is the backbone of trust in every number you report.
Forget manual checks and informal processes - they're recipes for confusion and errors. As Anton Melander aptly states:
"Governance cannot be enforced through prompt instructions to an AI model. It must be enforced architecturally: row-level security, role-based access, full audit trails." [1]
To implement this, use role-based access control (RBAC). For example:
Set permissions at the system level, avoiding shared passwords or patchwork methods. Beyond access control, create a centralized semantic layer where metrics like "Revenue" are uniformly defined. Assign ownership to each key metric: one person ensures the metric's definition remains clear, while another oversees the data pipeline [6]. After setting up governance rules and access controls, verify their reliability through thorough testing.
Before fully transitioning to the new system, run it alongside your current reporting process for at least one full cycle. Compare results line by line to identify any discrepancies. If differences arise, they could point to flaws in either the legacy process or the new system.
To maintain data quality:
After each reporting cycle, conduct a post-mortem to address issues and refine the system [5]. A helpful metric here is the "reconciliation tax", which measures the time analysts and leaders spend debating which dashboard is correct. Multiply those hours by their hourly rate and 4.3 weeks per month to quantify the cost [6].
Once validation is complete, you're ready to scale the system to meet your business's growing needs.
Scaling doesn’t mean starting over - it’s about building a system that evolves in stages. By designing with maturity levels in mind, you can ensure your reporting remains reliable as data volumes and stakeholder demands increase:
| Maturity Level | Focus | What It Prevents |
|---|---|---|
| Level 1: Stop the Bleeding | Source inventory, KPI definition cards | Conflicting numbers, duplicate counts |
| Level 2: Trust at Scale | Drift alerts, data lineage, backfill windows | Silent logic changes, untraceable data |
| Level 3: Decision Automation | Semantic layer, governance workflows | Metric sprawl, compliance risk |
Start with Level 1: define your 10–20 highest-impact KPIs. Use "definition cards" to document each metric’s details, such as granularity, inclusion/exclusion rules, and currency conversion methods. Store these cards in a code repository for easy version control [6].
As your business grows, revisit your KPI set at least quarterly. Metrics that were essential at $2M ARR might become less relevant at $20M. A well-designed system grows with your business, avoiding the need for proportional increases in analyst hours. Unlike manual workflows, an automated system can handle more users and data seamlessly [1].
Creating a real-time financial reporting system is a step-by-step process. It begins with defining what "real time" means for your business and pinpointing the 10–20 key metrics that drive decisions, such as cash runway and MRR growth. From there, you’ll need to design a centralized data architecture that seamlessly integrates your core systems, like accounting, billing, CRM, and payroll.
Once the foundational architecture is in place, the focus shifts to maintaining operational accuracy. Features like automated data ingestion, validation rules, and reconciliation routines ensure your numbers remain reliable. Without proper data hygiene, errors can quickly multiply. According to a 2022 Workday Adaptive Planning report, companies with real-time or near-real-time financial data were 2.5 times more likely to forecast accurately and 1.7 times more likely to achieve revenue growth above 10%. But these benefits only materialize when the underlying data is clean and accurate.
With a solid data foundation, persona-based dashboards turn raw numbers into actionable insights. For example, a CFO needs visibility into burn rate and runway, while a sales leader focuses on pipeline conversion and CAC payback. The goal isn’t to overwhelm with data - it’s to deliver relevant data to the right person at the right time.
As your system evolves, robust governance becomes critical. This ensures data accuracy and system reliability as you scale. Role-based access controls, audit trails, clear metric definitions through a semantic layer, and a structured scalability plan help your system grow alongside your business, avoiding breakdowns under increasing demands.
For growth-stage companies that lack deep in-house FP&A and data engineering expertise, partnering with external professionals can fast-track success. Firms like Phoenix Strategy Group provide a comprehensive solution, combining bookkeeping, fractional CFO services, FP&A, and data engineering. This approach helps businesses build the financial infrastructure they need to scale, secure funding, and prepare for future milestones like exits or acquisitions.
"Real time" in financial reporting means gathering, processing, and sharing data almost instantly - usually within milliseconds or seconds. This approach ensures access to the latest financial metrics as they happen, giving businesses the ability to make quicker, well-informed decisions. With reduced delays, companies can act on accurate, up-to-date information to seize opportunities or tackle challenges as they arise.
To ensure your dashboard reflects accurate data, it's crucial to regularly validate and reconcile information. Start by mapping your data sources and setting up validation rules to catch any errors during data transfers. Automating reconciliation processes can help you frequently compare transactions and balances, reducing manual effort.
Consider using alerts to flag anomalies or discrepancies in real time. Additionally, performing regular spot checks adds another layer of accuracy to your data verification process. Strong data governance practices are key to maintaining consistent and reliable dashboard outputs, so make this a priority in your workflow.
When building your first real-time finance dashboard, aim to include 5–8 essential metrics that provide a clear picture of your company’s financial health. Here are some key ones to consider:
By focusing on these metrics, your dashboard will remain straightforward and deliver actionable insights.