Published on
February 15, 2026

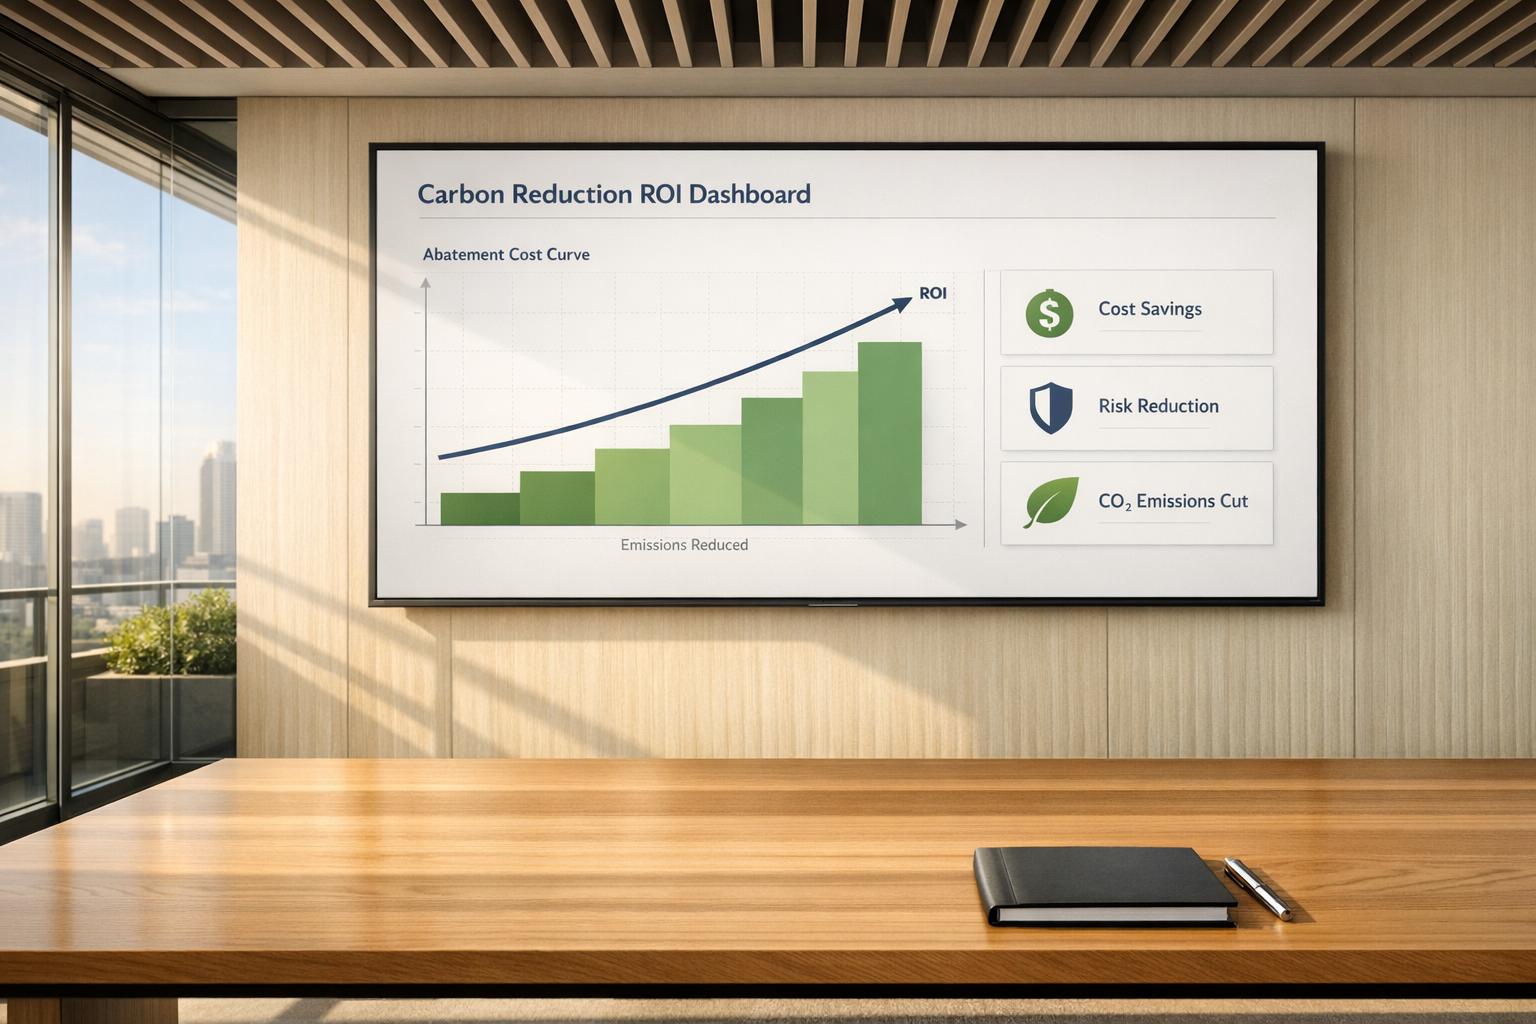
Cutting carbon emissions isn't just about compliance; it's about financial growth. CFOs who calculate the ROI of carbon reduction can lower costs, mitigate risks, and unlock new revenue streams. Here's why it matters:
To prioritize projects, CFOs should focus on baseline emissions, use tools like Marginal Abatement Cost Curves, and integrate carbon metrics into financial planning. By treating carbon like a financial metric, businesses can reduce costs, meet investor expectations, and position for growth in a low-carbon economy.

Carbon Reduction ROI: Key Financial Benefits and Metrics for CFOs
Figuring out the ROI for carbon reduction projects requires the same rigorous approach you'd apply to any major capital investment. The focus lies on three key value streams: direct cost savings, risk mitigation, and revenue growth. Essentially, you compare your low-carbon solution to the most likely conventional alternative at the time of replacement. This comparison highlights differences in capital needs, operating costs, and emissions impacts [2].
To get a clear picture of ROI without inflating the "green premium", break down project spending into three categories:
"Decarbonization succeeds or fails in the finance function. Ambition becomes real only when it is translated into investment appraisals, capital budgets, operating plans, and portfolio choices." - Umbrex Decarbonization Playbook [2]
Cost Savings
Start by modeling energy and fuel reductions using actual tariff rates. This ensures you account for demand charges and time-of-use pricing. For example, 38% of European CFOs cite cost savings as their primary motivation for climate action [5]. Beyond energy, identifying inefficiencies - like outdated equipment or unnecessary logistics routes - can significantly cut operational costs.
Risk Mitigation
This component focuses on avoiding future costs, such as carbon taxes (expected to hit $100–$122 per ton in the EU by 2030), compliance penalties, or retrofitting older systems to meet stricter standards. It also includes resilience benefits, like reduced exposure to volatile energy markets. Using internal carbon pricing - a shadow price for emissions - can help test how future regulatory costs might impact your investments [2][6].
Revenue Growth
Carbon reduction efforts can unlock revenue opportunities. These include meeting supply chain requirements, retaining customers who prefer low-carbon suppliers, and charging premium prices for greener products. In manufacturing, 33% of executives see greener product lines and sustainable suppliers as crucial for boosting ROI [7]. Plus, every $1 spent on climate initiatives can yield up to $5 in combined savings and avoided losses [9].
Tracking the success of your carbon reduction projects means focusing on four main categories of KPIs:
| Metric Category | Key KPIs | Purpose for CFOs |
|---|---|---|
| Emissions | Total CO₂e (Scope 1, 2, 3); Carbon Intensity (tCO₂e per $M Revenue) | Tracks abatement progress and efficiency relative to business growth [2][8] |
| Operational | Energy Use Reduction; Fuel/Logistics Cost Savings | Measures direct OpEx reductions from efficiency upgrades [5][10] |
| Financial | NPV, IRR, Payback Period, Avoided Carbon Tax Exposure | Evaluates long-term value and quantifies regulatory risk mitigation [1][6][8] |
| Strategic | Green Revenue Share; Bid Eligibility | Monitors growth from low-carbon products and supply chain access [2] |
To ensure your business cases are robust, test them against at least three scenarios: high energy price volatility, elevated carbon costs under stricter standards, and delays in infrastructure like grid interconnections or permitting. This type of scenario testing helps identify projects that can deliver strong returns even under uncertain conditions [2].
Next, dive into how to assess and rank these projects using clear baselines and marginal abatement cost curves.
After understanding the financial mechanics of carbon ROI, the next step is to create a prioritized list of projects. This involves two key steps: measuring your baseline carbon footprint to pinpoint where emissions are concentrated and using marginal abatement cost curves to rank projects by cost-effectiveness. These tools help ensure your capital is directed toward initiatives that provide the greatest emissions reductions for the money spent.
The first step is defining your boundaries using the Operational Control approach, which focuses on entities where your company has authority to implement policies. This method simplifies data collection [12][13]. Next, choose a recent 12-month period with complete, verified data as your baseline year - this will serve as the foundation for tracking progress.
Emissions are categorized into three scopes using standardized conversion factors:
For most organizations, Scope 3 emissions dominate, often accounting for 70% to 90% of the total [12]. This makes it the largest area of opportunity for reductions.
When reporting Scope 2 emissions, use both the location-based method (regional grid averages) and the market-based method (supplier-specific contracts or renewable energy certificates). This dual approach provides a more detailed view of your energy choices [12][11]. For accuracy, rely on direct supplier data and consider automating data collection with carbon accounting software [12].
"Developing a full [greenhouse gas] emissions inventory – incorporating Scope 1, Scope 2 and Scope 3 emissions – enables companies to understand their full value chain emissions and focus their efforts on the greatest reduction opportunities." - Greenhouse Gas Protocol [15]
Once you aggregate the results, identify emission hotspots - these are often in Scope 3 categories like purchased goods or logistics. Since Scope 3 is typically the largest component, request primary emissions data from major vendors instead of relying on industry averages for better accuracy [12][14]. With a clear baseline established, you can move on to prioritizing projects using Marginal Abatement Cost Curves.
A Marginal Abatement Cost Curve (MACC) is a visual tool that ranks carbon reduction projects based on cost-effectiveness. Each bar in the chart represents a project:
Bars are arranged from left to right by increasing cost, making it easy to identify "low-hanging fruit" projects that offer significant reductions at minimal cost [18][17].
Bars below the horizontal axis represent projects with net economic benefits, often referred to as "no-regret" investments. Examples include LED lighting upgrades, waste heat recovery, and energy efficiency improvements. Research suggests that approximately 50% of emissions reductions in core sectors can be achieved at zero or negative net cost [16]. The area of each bar shows the total cost of the project, helping you estimate the cumulative investment needed to hit your reduction targets [18][19].
To build your MACC, calculate the marginal cost by dividing the total cost difference (CapEx and OpEx) by the project’s lifetime emissions reduction [16][17]. Always compare the low-carbon investment to a "do-nothing" or conventional alternative to calculate the internal rate of return (IRR) accurately [2]. Incorporating an Internal Carbon Price (ICP) can further refine your prioritization. Projects with costs below the ICP are considered financially viable, while those above may require additional justification [16][2].
Start with negative-cost projects to generate savings that can fund higher-cost initiatives. Align project implementation with asset cycles for efficiency [18][19]. Revisit your MACC every 2–5 years to account for changes in market conditions, regulations, and advances in greenhouse gas inventories [19]. Modern MACCs are evolving into dynamic tools that factor in technology improvements, fuel price fluctuations, and policy changes. For instance, the cost of solar photovoltaic systems has dropped by over 80% since 2010, making these projects more financially attractive [16].
| Project Archetype | Strategic Action | Financial Focus |
|---|---|---|
| Core Transform | Invest in deep decarbonization | Long-term NPV and asset resilience |
| Manage & Harvest | Operational efficiency/methane reduction | Near-term cash flow; minimize new CapEx |
| Exit or Divest | Structural exit | Avoid stranded asset risk |
| Grow & Invest | Scale low-carbon products | Market share and price premiums |
Keep in mind that MACCs treat each measure as independent, but real-world interdependencies can influence outcomes [18][16]. Involve your finance team early in the process to align carbon reduction strategies with your company’s financial goals, such as IRR and NPV [19][1].
Once you've calculated ROI and ranked your decarbonization projects, it's time to act. The most effective initiatives typically fall into two main areas: energy efficiency upgrades combined with renewable energy and supply chain decarbonization paired with circular economy models. Both approaches cut emissions while delivering strong financial returns, though they differ in terms of investment strategy and timelines.
Some of the easiest projects to tackle often deliver the quickest financial returns. For instance, upgrading to LED lighting, installing building automation systems, and optimizing HVAC systems can lead to immediate cost savings with relatively short payback periods. Here's an eye-opening stat: 25% of HVAC and mechanical assets across industries are past their useful life, and half are over 15 years old - making them perfect candidates for upgrades that align with decarbonization goals [20].
"If you wait for a critical unit to fail, you're forced into emergency mode: scrambling for the fastest-available replacement, paying a premium, and risking service interruptions." - Richard Prinz, Mantis Innovation [20]
Take this example: In July 2025, a manufacturing company upgraded its aging rooftop HVAC units and building controls. By coordinating with their utility provider early, they secured incentives that covered a significant portion of the costs. The result? A 2.8-year payback period, stabilized energy expenses, and improved operational margins [20]. Utility rebates covering 30%–40% of project costs further sweeten the deal, even before factoring in carbon reductions [20].
On the renewable energy side, commercial solar installations are a proven way to slash electricity costs by 60–80% [22]. After incentives, energy costs drop to about 4–6 cents per kWh, compared to traditional electricity rates of 10–14 cents per kWh [22]. With payback periods typically between 5–7 years, companies can boost ROI by taking advantage of the 30% Federal Investment Tax Credit (ITC) and MACRS depreciation benefits [22]. Maintenance costs are minimal, ranging from $15 to $25 per kilowatt annually [22], and the fixed energy costs provide a buffer against rising utility rates.
A phased approach works best: start by reducing energy demand with efficiency upgrades, then recover wasted heat, and finally replace fossil fuel equipment with electric alternatives [21]. Timing these investments with planned capital cycles helps avoid emergency replacements, which often come with higher costs [21]. These foundational steps not only stabilize energy expenses but also set the stage for tackling more complex emissions challenges, such as those in your supply chain.
For many companies, Scope 3 emissions - those generated by suppliers and other indirect sources - represent the largest opportunity for impact. And the stakes are high: failing to address these emissions could result in $500 billion in annual transition liabilities by 2030 [25].
Supply chain decarbonization offers a clear path to both emissions reduction and financial returns. Companies that actively engage with their suppliers are nine times more likely to meet their decarbonization goals [25]. Meanwhile, circular economy strategies - like designing products for reuse and recycling - could unlock $4.5 trillion in economic opportunities between 2015 and 2030 [24]. These strategies can also cut emissions by 56% compared to traditional models [24].
"The procurement function has the knowledge and expertise in navigating supplier relationships and is best positioned to influence a company's suppliers to adopt sustainable practices." - Ian Sullivan, Managing Director, Deloitte Consulting LLP [26]
Supplier engagement programs can include preferential payment terms, increased spending commitments, or access to affordable green financing [23] [26]. Circular procurement updates RFP criteria to favor suppliers offering take-back programs, remanufactured products, or bio-based materials [24]. Modular design, which allows for part upgrades instead of full replacements, not only reduces emissions but also lowers material costs over the long term [24].
The key to success is transitioning from rough, spend-based emissions estimates to supplier-specific data. Between 2021 and 2023, the priority of "Enhancing ESG/CSR" jumped from 7th to 2nd place among Chief Procurement Officers [26]. Companies that decarbonize their supply chains early will gain a structural edge over competitors still dependent on high-carbon inputs, turning carbon reduction into a competitive advantage.
Carbon is no longer just an environmental concern - it's now a core part of financial decision-making. Forward-thinking CFOs are treating carbon with the same precision they apply to cash flow: integrating it into forecasts, budgets, and scenario planning rather than relying on after-the-fact reporting [1]. This means embedding carbon intensity metrics right alongside revenue and EBITDA in enterprise planning systems [1].
By weaving carbon reduction into financial planning and analysis (FP&A), companies aren't just meeting compliance requirements - they're speaking the same language as their investors and boards. This approach paves the way for adopting frameworks like ROSI, which connect carbon investments to business growth.
The Return on Sustainability Investment (ROSI) framework offers CFOs a structured way to assess carbon reduction projects with the same financial discipline applied to other investments. Instead of viewing these projects purely as costs, ROSI helps quantify both tangible and intangible benefits - often revealing that the intangibles outweigh direct cost savings by 4 to 10 times [28].
ROSI operates through five steps: identifying material risks and opportunities, crafting strategies, calculating expected benefits, quantifying outcomes, and monetizing those results [28]. A standout feature is its "Offense vs. Defense" approach. Offensive goals focus on generating new revenue streams - like launching eco-friendly products that command higher prices or unlock new markets. Defensive goals aim to protect value by avoiding regulatory penalties, minimizing supply chain disruptions, or lowering capital costs [28]. This method complements existing KPIs, offering a comprehensive view of how carbon impacts financial performance.
"To properly embed sustainability and make it a source of competitive advantage, companies need to incorporate sustainability into their strategy and, ultimately, target the material issues." - Tensie Whelan, Founding Director, NYU Stern Center for Sustainable Business [28]
Many companies have seen measurable success with ROSI. For example, Capital Power Corporation estimated a $30 million boost to company value by accelerating its clean energy initiatives. REI found that its sustainability program delivered $24 million in net benefits, roughly 5% of total payroll costs, through reduced turnover and higher productivity. Natra, a chocolate maker, forecasted a present value of €2.4 million by achieving complete supply chain traceability for its cocoa, shifting it from a commodity to a specialty product [27][28].
A crucial step in this process is setting an internal carbon price. This pricing allows finance teams to evaluate decarbonization projects on equal footing with other investments during capital allocation [3]. It also enables scenario modeling - testing how high energy volatility or stricter carbon regulations could affect the business case - before committing resources [1].
The ROSI framework is just the starting point. To make informed decisions, companies need robust financial models that project long-term returns. These models should go beyond simple payback periods, focusing instead on comparing low-carbon options to conventional alternatives at their point of replacement. This approach highlights the incremental capital and operating costs tied to carbon reduction without overstating the expense as "decarbonization capex" [2].
Effective models incorporate value drivers like energy savings, avoided costs, revenue impacts, and resilience benefits [2]. By applying standard financial metrics like Net Present Value (NPV) and Internal Rate of Return (IRR), companies can present a compelling case to their boards [28].
For instance, Gundersen Health System used detailed financial models to evaluate energy retrofits and net-zero building designs. Their analysis revealed annual benefits of $1 per square foot for retrofits and $2 per square foot for net-zero designs, factoring in both direct savings and operational improvements [29].
"Decarbonization succeeds or fails in the finance function. Ambition becomes real only when it is translated into investment appraisals, capital budgets, operating plans, and portfolio choices." - Umbrex Decarbonization Playbook [2]
Scenario testing is another vital step. Models should account for variables like fluctuating energy prices, rising carbon costs, or infrastructure delays [2]. This testing helps identify which projects remain financially viable under changing conditions. To streamline this process, embed standard questions into every capital request above a set threshold. Questions could include: What’s the CO2e reduction by scope? What’s the counterfactual? How do alternative energy prices affect the case? What data will verify savings post-implementation? [2]
Owens Corning applied this disciplined approach when evaluating its "Zero Waste to Landfill" initiative. By treating investments in data platforms, metering systems, and workforce training as strategic enablers rather than discretionary expenses, they unlocked significant savings in processing and procurement while cutting emissions [28]. These "enabling spends" proved critical for scaling future carbon reduction efforts [2].
To make the most of carbon reduction efforts, growth-stage companies need more than just enthusiasm - they need financial expertise. However, hiring a full-time CFO with a background in sustainability isn’t always feasible. That’s where fractional CFO services come into play. These professionals help translate carbon reduction goals into actionable financial strategies, such as investment evaluations, capital budgets, and operational plans, all without the cost of a full-time executive [2].
The momentum for change is evident. 38% of CFOs are driven to address climate change as a cost-saving measure [5], and 90% of large publicly traded companies are sticking to or speeding up their decarbonization goals, even in uncertain economic times [3]. Yet, only 17% of financial executives currently see decarbonization spending as profitable [7]. This disconnect highlights the need for better financial modeling and communication around these projects. Fractional CFOs fill this gap by applying the same rigorous analysis to carbon reduction initiatives as they do to traditional capital investments.
Phoenix Strategy Group specializes in fractional CFO services, financial planning and analysis (FP&A) systems, and data engineering, all tailored to the needs of growth-stage companies. Their approach integrates carbon reduction into core financial processes - such as cash flow forecasting, capital allocation, and M&A planning - rather than treating it as a separate compliance task.
One key tool they offer is internal carbon pricing, which assigns a cost per ton of CO2e to investment decisions. This allows finance teams to evaluate decarbonization projects on the same financial terms as other capital requests [2][3]. For example, when deciding between electric and fossil-fuel-based process heating, internal carbon pricing can make the lower-emission option more attractive by factoring in future regulatory costs.
Phoenix Strategy Group also helps businesses identify and secure tax credits and grants, such as those available through the Inflation Reduction Act, to improve the financial returns of green projects [3]. By involving tax teams early in the process, companies can turn what might seem like extra expenses into opportunities for value creation. This is especially important for businesses preparing for fundraising or exits, as a credible decarbonization strategy can boost valuations and attract ESG-focused investors. This seamless integration of financial and sustainability planning lays the groundwork for leveraging advanced data tools to scale carbon reduction programs.
Accurate and reliable data is the backbone of effective carbon reduction strategies. Automating utility data collection - often up to 80% faster than manual methods - frees finance teams to focus on strategic decision-making [8].
Phoenix Strategy Group’s data engineering services streamline the extraction of carbon-related data from ERP systems, procurement platforms, and energy providers. This automation ensures that emissions data is as organized and auditable as financial data, which is crucial given that 94% of investors believe corporate sustainability reports often lack credible support [3]. By implementing "carbon closes" alongside traditional financial closes, companies can monitor metrics like CO2e per dollar of revenue in real time [6].
These tools also enable scenario testing. Financial models can evaluate carbon projects under various conditions, such as fluctuating energy prices, rising carbon costs, or potential infrastructure delays [2]. This helps businesses identify which projects will remain financially and environmentally viable under different scenarios, ensuring resources are directed toward initiatives with the best combined returns. For growth-stage companies, this level of financial precision transforms carbon reduction from a regulatory obligation into a competitive edge.
Treating carbon as a core financial metric is becoming essential for growth-stage companies looking to thrive in today’s evolving market. Companies that manage carbon with the same rigor as cash are not just protecting their margins - they’re also gaining market share and reducing their cost of capital. With 94% of institutional investors now factoring ESG data into their investment decisions, the message is clear: sustainability is no longer optional - it’s a business imperative [1].
To leverage carbon as a business advantage, the time to act is now. Start by creating a reliable emissions baseline that aligns with your cost centers and business units. Implement internal carbon pricing to evaluate capital projects, factoring in the potential impact of future regulations - especially as EU carbon prices already hover around €90–€100 per ton [2]. Tools like Marginal Abatement Cost Curves can help prioritize initiatives based on cost-effectiveness while also highlighting operational benefits. By embedding carbon reduction into financial planning, companies position themselves to outperform competitors.
"Carbon is no longer just an environmental metric. It's a financial one." – Workiva [1]
For growth-stage companies, this is an opportunity to build decarbonization into the foundation of their operations. Without the burden of legacy systems, you can design low-carbon strategies from the ground up. Start by mapping emissions to cost centers, as previously discussed, and use that data to guide decisions. Whether it’s negotiating renewable energy deals, streamlining logistics to reduce fuel costs, or designing products with circularity in mind, every initiative can boost both sustainability and profitability. By 2030, one-third of company revenues are expected to be linked to the climate transition [4], and early movers will capture the largest share of that market.
The financial methods outlined here provide the tools to turn carbon reduction into measurable ROI. The question isn’t whether to act - it’s how quickly you can integrate these practices into your financial strategy.
"Climate ambition, backed by action, is now a competitive advantage." – PwC [4]
Start measuring, planning, and building growth through carbon reduction today.
When setting an internal carbon price, it’s important to ensure it aligns with your company’s strategic goals and broader global climate targets. Many businesses adopt pricing that mirrors the external costs of carbon. Why? It drives decarbonization efforts and helps manage climate-related risks more effectively. This strategy not only weaves sustainability into everyday decision-making but also supports the company’s long-term growth ambitions.
Even without full supplier data, companies can still estimate Scope 3 emissions using well-established methods. A common approach involves blending primary data (directly from suppliers) with secondary data like industry averages or spend-based calculations.
When supplier-specific information isn't available, businesses can rely on proxy data, conservative estimates, or third-party averages to fill in the gaps. To make the process more manageable, start by prioritizing high-impact suppliers or categories, as these are likely to contribute the most to overall emissions. Over time, as more accurate data becomes available, companies can refine their estimates and enhance transparency.
To confirm energy savings and CO2e reductions after implementation, organizations rely on reporting, measurement, and independent verification. This process often involves preparing a comprehensive greenhouse gas (GHG) emissions report, gathering activity data, applying appropriate emission factors, and maintaining both accuracy and transparency. Frameworks such as the GHG Protocol offer guidelines for precise measurement. Independent third-party verification ensures that the reductions are genuine, measurable, and meet regulatory or stakeholder requirements.