Published on
December 14, 2025

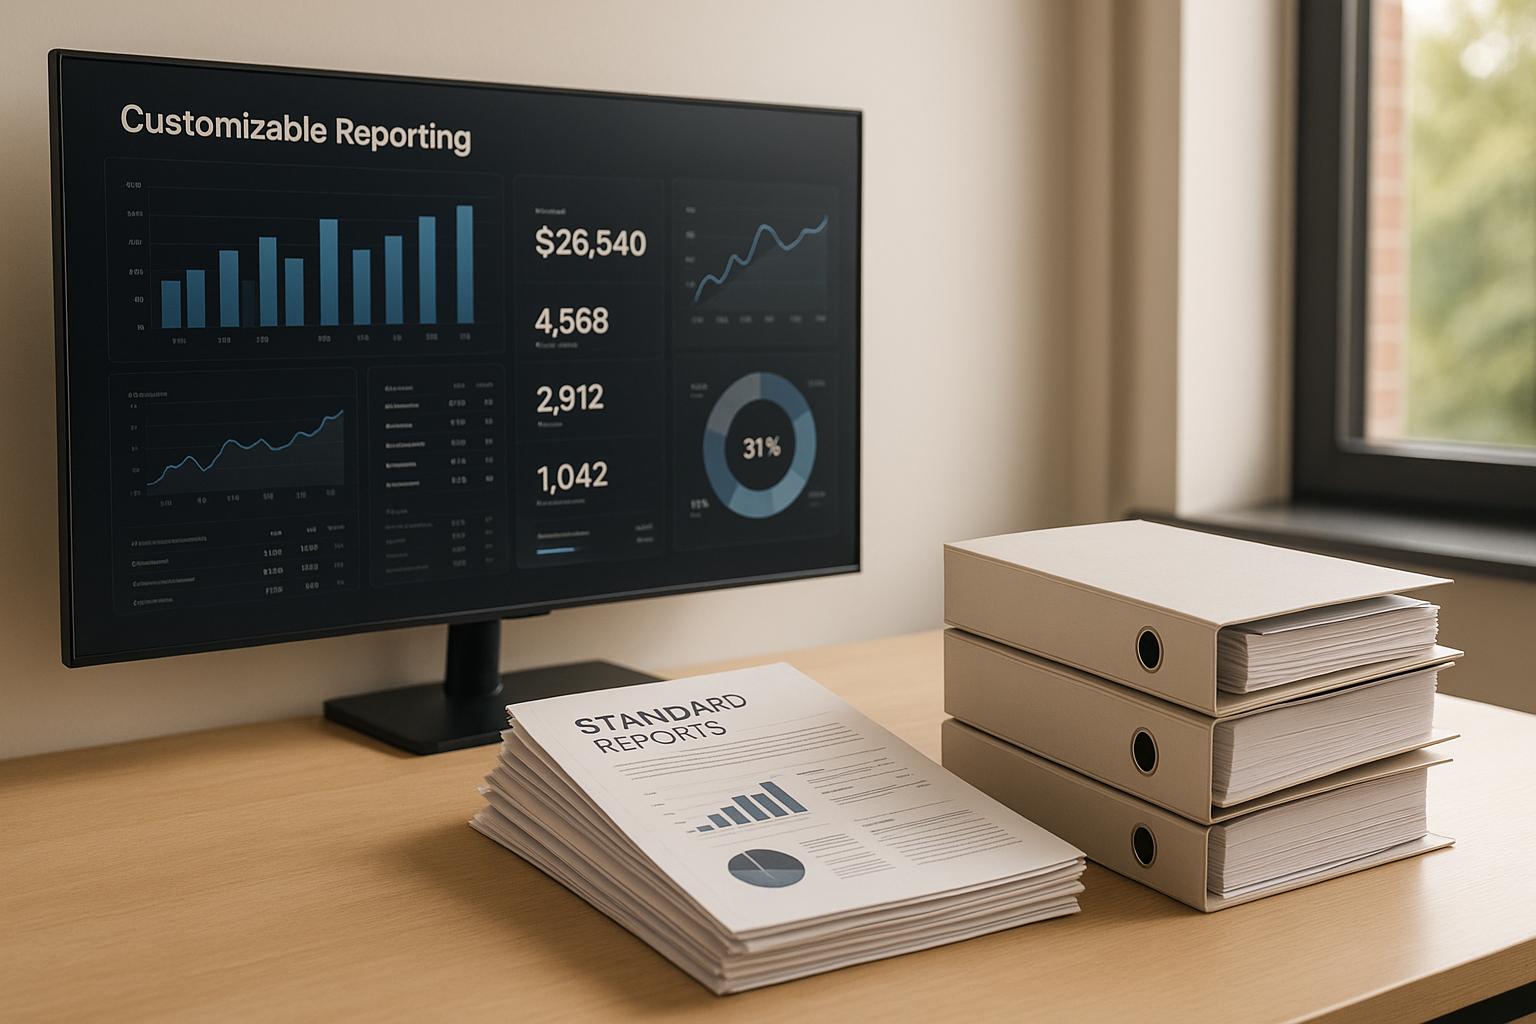
Customizable and standard reports serve different purposes in financial reporting. Standard reports are pre-built templates like income statements and balance sheets, designed for compliance, audits, and external use. They’re easy to set up, consistent, and fit simpler business needs. Customizable reports, however, offer tailored metrics, real-time updates, and interactive dashboards for deeper insights, helping businesses analyze performance and plan strategically.
| Feature | Standard Reports | Customizable Reports |
|---|---|---|
| Flexibility | Fixed templates, limited filters | Custom metrics, dynamic groupings |
| Update Frequency | Period-end (e.g., monthly) | Real-time or near real-time |
| Setup Time | Minimal | Requires more time and effort |
| Cost | Low (basic ERP plans) | Higher (advanced tools or licenses) |
| Best Use Case | Compliance, audits, simple KPIs | In-depth analysis, scenario planning |
For most businesses, a hybrid approach works best: use standard reports for compliance and customizable tools for deeper insights.
Standard vs Customizable Reports: Feature Comparison for Mid-Market Businesses
Standard reports come with predefined structures that make financial analysis more straightforward. These reports are built to resemble familiar financial statements, such as income statements and balance sheets. For example, income statements consistently outline revenue, cost of goods sold, operating expenses, and net income, while balance sheets display assets, liabilities, and equity in their standard order. Formatting is consistent across the board, with features like thousands separators (e.g., $1,234,567.89), negative numbers shown in parentheses, and standard date ranges like month-end or quarter-end. This uniformity ensures your finance team can interpret data quickly without needing to reformat reports every period. The result? Faster analysis and fewer layout errors, making it easier to identify trends or anomalies when comparing performance over time.
Standard reports align closely with U.S. GAAP presentation requirements, simplifying tasks like tax filings, bank reporting, and audits. These templates are designed with standardized line items, subtotal arrangements, and period comparisons that meet the expectations of auditors and tax professionals. Many financial tools even allow you to schedule or automatically generate these reports at the end of each period, ensuring consistent formatting and logic every time. This consistency not only reduces the time auditors spend reviewing reports - they instantly recognize the familiar layouts - but also streamlines variance analysis across months and quarters. For businesses preparing loan covenant reports or updates for their board, these GAAP-compliant formats offer the reliable and conventional structures that external stakeholders depend on. This dependable approach also makes setup quick and hassle-free.
Running standard reports is usually as simple as selecting a report name from a menu, choosing the desired period, entity, and currency, and exporting the results. Because the process is so straightforward and familiar, there’s no need to design layouts, define custom metrics, or create complex queries. This simplicity means new finance team members or non-finance stakeholders can quickly learn to generate and interpret these reports with minimal training. For instance, Phoenix Strategy Group’s Basic plan includes essential reporting tools designed for growing businesses. For companies in the U.S. with annual revenues between $20–$50 million, straightforward product lines, and a single legal entity, these standard reports often meet 80–90% of recurring financial reporting needs without requiring advanced customization.
Customizable reports allow businesses to create metrics tailored to their unique needs, moving beyond standard financial data. You can define specific calculations like EBITDA, adjusted EBITDA, gross margin percentage, customer acquisition cost (CAC), lifetime value (LTV), monthly recurring revenue (MRR), or revenue per employee. These formulas pull data directly from your chart of accounts and operational systems, ensuring consistency across departments and reporting periods.
Dynamic grouping adds even more flexibility by letting you analyze the same data from multiple perspectives without creating new reports. For instance, you can group revenue and gross profit by customer segment (enterprise vs. SMB), sales channel (direct vs. partner), or region (Northeast vs. West Coast). A retailer might evaluate performance based on store format - such as mall locations, outlet centers, or online sales - while a manufacturer might focus on product families or production plants to track cost variances. This approach helps finance teams quickly pinpoint underperforming products, regions, or customer segments. Naturally, these tailored metrics pave the way for real-time insights.
Once you’ve set up custom metrics, having real-time data becomes critical for timely decision-making. Customizable reporting platforms integrate directly with ERP, CRM, payroll, and data warehouse systems via APIs. These integrations ensure data is refreshed automatically - whether it’s hourly, daily, or near real-time - so you’re not stuck waiting until the end of the month for performance insights. This also reduces the need for manual data entry and reconciliation.
Interactive dashboards make this live data actionable by presenting it in visual, drillable formats. You can use time-series charts to track revenue trends, waterfall charts for bridge analyses, heat maps for regional or product performance, and variance charts to compare actuals against budgets. Want to dig deeper into a sudden spike in operating expenses? Simply click on the relevant chart segment to explore details by department, cost center, or even individual transactions - all within the same dashboard. This self-service capability minimizes ad-hoc report requests and empowers teams in operations, sales, and finance to uncover the root causes behind the numbers.
Advanced filters let you refine data views across departments, regions, customer types, cost centers, and account categories. Finance teams can predefine commonly used filters - like "Go-to-Market Operating Expenses" or "Corporate Overhead" - so stakeholders can easily toggle between views without resorting to custom spreadsheets. Combining filters (e.g., "U.S.-only, SaaS customers, new logo revenue, Sales & Marketing expenses") enables a more focused analysis of specific initiatives or customer groups, adding depth to your reporting.
For businesses managing multiple legal entities, subsidiaries, or business lines, multi-entity reporting is a game-changer. These tools consolidate financials across separate LLCs, U.S. and foreign subsidiaries, or franchise operations, while also allowing you to assess each entity’s performance individually. The platform handles currency conversions and intercompany eliminations automatically, giving CFOs a clear view of both detailed and consolidated results. For example, Phoenix Strategy Group uses these features in its FP&A and fractional CFO services, helping mid-market companies create investor-grade dashboards powered by live data systems.
The primary distinction between customizable and standard reports boils down to the trade-off between flexibility and simplicity. Standard reports focus on delivering essential financial statements - like income statements, balance sheets, cash flow reports, and AR aging - using pre-designed templates that adhere to GAAP or IFRS guidelines. These are straightforward, quick to implement, and require minimal training, making them ideal for compliance and routine reporting. On the other hand, customizable reports let you tailor metrics, KPIs, layouts, filters, and visualizations to align with your specific business strategy and operational needs.
Update frequency is a key differentiator: Standard reports typically refresh at the end of a month or quarter. In contrast, customizable reporting platforms often integrate directly with your systems, enabling real-time updates through interactive dashboards. This continuous data flow allows for quicker decision-making and reduces the delay between business events and their reflection in your reports.
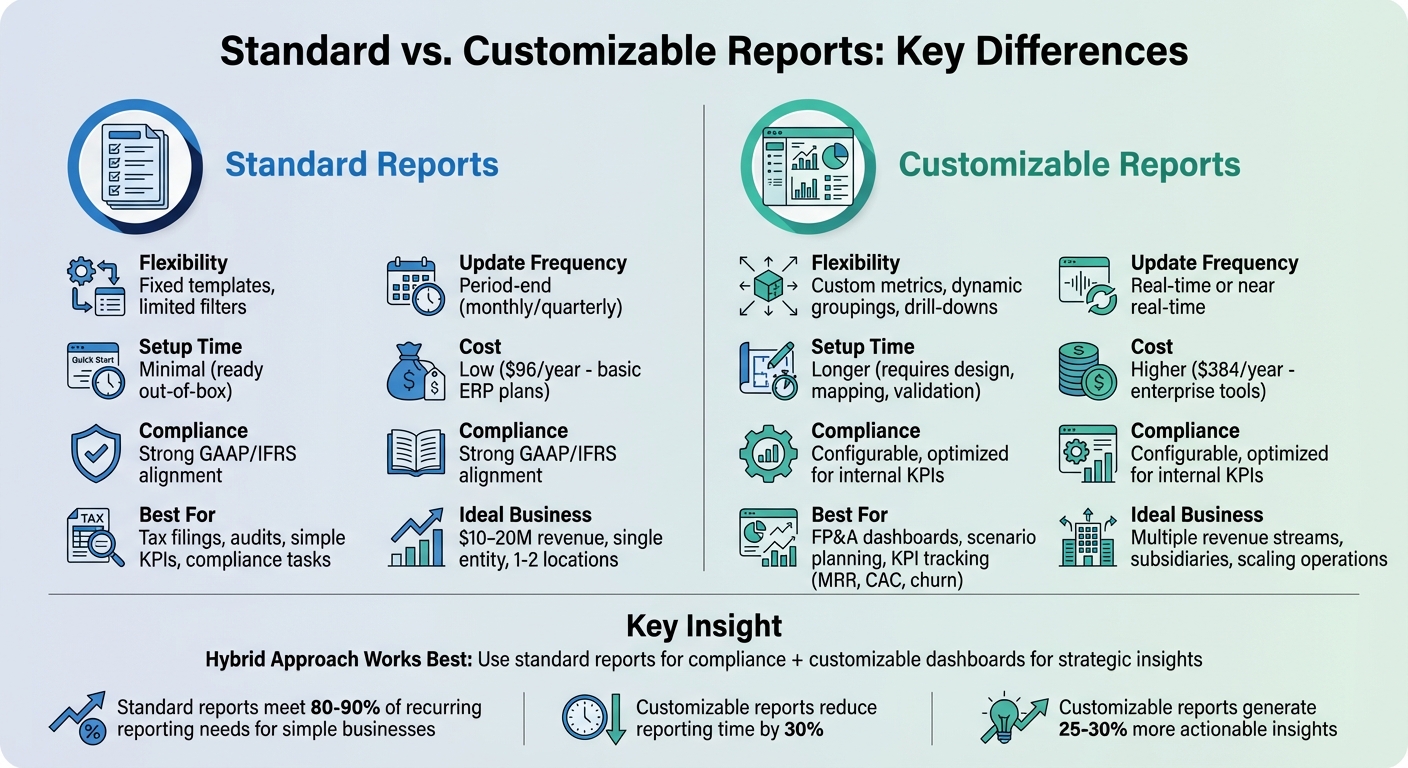
Cost and time investment also vary significantly: Standard reports are usually included in the base subscription of most accounting software, keeping costs low. Customizable reports, however, often require more advanced licensing, BI tools, or consulting services to set up and validate custom structures. While the upfront investment is higher, these systems can save time in the long run - reducing reporting time by up to 30% and generating 25–30% more actionable insights compared to static standard reports.
| Dimension | Standard Reports | Customizable Reports |
|---|---|---|
| Flexibility | Low: fixed layouts with limited personalization; basic date and segment filters | High: custom fields, dynamic groupings, interactive drill-downs |
| Update Frequency | Period-end (e.g., month-end or quarter-end); may refresh daily | Real-time or near real-time via API integrations and automated data pipelines |
| Setup Time | Short: ready out of the box with minimal configuration and training | Longer: requires design, data mapping, validation, and user training |
| Compliance | Strong alignment with GAAP/IFRS for audits, tax prep, and lender packages | Configurable for compliance but optimized for internal KPIs and decision-making |
| Cost | Included in basic ERP subscription (e.g., $96/year) | Requires higher-tier licenses or BI tools (e.g., $384/year for enterprise plans) |
| Primary Use Cases | Monthly close, tax prep, audits, basic budget vs. actuals | FP&A dashboards, department scorecards, KPI tracking (MRR, churn, CAC), scenario analysis |
These differences highlight when each approach is most effective. Many mid-market U.S. companies use both: standard reports for routine compliance and customizable reports for deeper strategic insights. Finance teams often start by perfecting standard monthly close reports to meet the needs of lenders, auditors, and tax preparers. Once these are stable, they expand to department-specific customizable dashboards - such as for Sales, Marketing, or Operations - to ensure accountability and support larger goals like fundraising or preparing for an acquisition.
Standard reports offer immediate convenience because they come prebuilt and automated. Instead of spending hours designing layouts from scratch, finance teams can generate essential documents like income statements, balance sheets, cash flow reports, and A/R aging summaries with just a few clicks. This efficiency is particularly critical during busy periods, such as month-end closings, when financials are needed quickly for lenders, auditors, or board members.
Many accounting platforms also allow users to schedule standard reports to run automatically. For instance, you can set up a weekly cash summary to be emailed every Monday at 8:00 AM ET. This automation not only saves time but also ensures stakeholders receive consistent updates without the need for repeated requests to the finance team.
For routine tasks - like weekly KPI tracking, month-end reconciliations, and external audits - standard reports deliver exactly what’s required. Auditors and banks often request familiar formats, such as GL detail, fixed asset listings, and aged receivables. Standard reports are designed to meet these expectations without the need for customization. For example, a services firm with $15 million in revenue can rely on standard profit-and-loss statements, utilization summaries, and A/R aging reports (in USD) to manage staffing and collections. This approach covers over 90% of their reporting needs without requiring additional tools, making it an ideal solution for companies in their early growth stages.
For early mid-market companies, the speed and simplicity of standard reports are invaluable. These prebuilt solutions provide quick insights, which are especially useful for businesses focused on establishing core financial processes.
Companies in this phase, typically earning $10–$50 million in revenue, often work with straightforward models, fewer entities, and simpler revenue streams. At this stage, leadership primarily needs visibility into key metrics like cash runway, monthly burn rate, revenue growth, gross margin, and high-level expense trends. Standard KPI packs and financial statements usually cover these needs without requiring custom dashboards or advanced data engineering.
For lean finance teams, the ability to avoid the time and cost of designing, testing, and maintaining complex custom reports is a major advantage. Standard reports provide "good enough" insights quickly, enabling teams to focus on stabilizing essential processes like bookkeeping, GAAP compliance, and tax preparation. For example, a SaaS company in Series A or B can monitor MRR (Monthly Recurring Revenue), churn, and cash runway using basic KPI packs alongside standard P&L and cash flow reports. As operations grow more complex and investor demands increase, firms like Phoenix Strategy Group can help determine when it’s time to layer in more advanced, customizable reporting tools.
Customizable reports elevate finance from a back-office function to a strategic powerhouse. Instead of relying on generic profit-and-loss line items, mid-market companies can zero in on tailored KPIs like monthly recurring revenue (MRR), customer lifetime value (CLV), churn rates, and inventory turnover. This level of precision allows leadership teams to focus on metrics that directly influence growth and profitability, enabling faster and more accurate insights across departments.
Customizable dashboards also enhance department-level performance analysis. For example, sales leaders can track revenue per representative or evaluate pipeline performance by territory. Marketing teams gain real-time visibility into customer acquisition costs (CAC) and return on ad spend (ROAS). Meanwhile, operations managers can dig into unit costs and delivery metrics. Because these reports are integrated with systems like ERP and CRM platforms, managers can seamlessly drill down from high-level trends to individual transactions - like identifying a sudden overtime increase at a specific warehouse - without exporting data to spreadsheets. This level of transparency is invaluable for quarterly reviews, incentive planning, and maintaining budget accountability.
Customizable reports also make scenario planning and "what-if" analysis more accessible and actionable. Finance teams can layer driver-based assumptions - such as changes in volume, pricing, or staffing - onto historical data to instantly see how these factors impact revenue, EBITDA, and cash flow. For instance, you can create a base forecast, simulate a 10% price hike or a product launch, and compare best-case, base-case, and downside scenarios side by side. These models, enriched by real-time data from sales pipelines, staffing plans, and capital expenditure schedules, provide realistic projections for cash flow and debt covenants - something standard reports simply can’t achieve.
Beyond improving day-to-day decisions, advanced reporting plays a pivotal role in scaling businesses and preparing for mergers or acquisitions. When mid-market companies gear up for fundraising or M&A activities, investors and acquirers demand highly detailed analyses that go far beyond standard financial statements. Due diligence often requires insights like revenue by segment, cohort retention trends, unit economics, customer concentration, and adjusted EBITDA bridges - none of which are included in a typical balance sheet or income statement. Customizable reporting enables companies to generate these granular views (broken down by contract type, geography, or product line), while still reconciling them back to audited financials. This builds trust and credibility throughout the process.
Phoenix Strategy Group showcases the power of customizable reporting by helping growth-stage and mid-market clients create investor-ready dashboards and M&A support packages. By using standardized yet flexible data models, companies can maintain "always-on" reporting that meets investor-grade standards. These reports, updated monthly or quarterly, ensure consistent definitions for KPIs, revenue recognition, and adjustments, making multi-year trend analyses easy to produce. When the time comes for a Series C funding round or a sell-side mandate, the company already has clean, drillable data sets ready to go - eliminating the last-minute scramble and keeping deal timelines intact. This streamlined approach not only saves time but also improves outcomes for fundraising and exits.
Standard reporting is ideal for businesses with straightforward operations - think a single legal entity, a basic chart of accounts, and one or two locations, typically generating $10–$20 million or less in annual revenue. These pre-designed templates provide reliable monthly financials in USD, simple departmental summaries, and basic cash-flow overviews. They’re perfect for tax preparation, meeting bank compliance requirements, and basic investor updates, all without requiring heavy investment or extensive training.
One of the biggest advantages of standard reporting is how quickly it can be implemented. It’s cost-effective, requires minimal setup, and allows bookkeepers or controllers to produce GAAP-compliant income statements, balance sheets, and cash-flow statements in just a few weeks. This makes it a great choice for early-stage companies focused on immediate questions like, “Are we profitable this quarter?” or “Did we stay within the department’s budget?” For startups, this simplicity helps conserve resources for priorities like product development and sales, rather than building out complex financial systems. However, as operational complexity increases, these fixed templates may no longer meet the company’s needs.
As businesses grow and operations become more complex, the limitations of standard reporting often become apparent. Companies with multiple revenue streams, business units, or subsidiaries typically require customizable reporting to gain the deeper insights needed for strategic decision-making. These tools are essential for answering forward-looking questions about growth, pricing strategies, cash runway, or unit economics by product line or customer segment - areas where standard reports fall short.
The shift to customizable reporting often aligns with hiring a CFO or establishing a financial planning and analysis (FP&A) function. It also becomes crucial when preparing for major events like raising debt or equity, or planning mergers and acquisitions. Customizable tools allow businesses to create tailored profit-and-loss statements by product, region, or customer; refresh financial data daily from systems like ERP, CRM, and billing platforms; consolidate multi-entity and multi-currency data while maintaining clear USD views for U.S. stakeholders; and build driver-based forecasts and scenario models.
For example, Phoenix Strategy Group helps mid-market companies streamline these processes by identifying key financial drivers, building FP&A models, and designing custom reporting systems. This ensures finance teams can deliver actionable dashboards instead of static spreadsheets - an invaluable resource for fundraising, strategic planning, and exit strategies.
A hybrid approach can be particularly effective during this transition. Companies can maintain standard monthly financial reports for audit, tax, and lender purposes while layering on customizable dashboards for internal decision-making. For instance, a U.S.-based SaaS company might keep using standard GAAP reports for its auditors and bank while implementing a custom FP&A tool to monitor real-time metrics like ARR, churn, cohort retention, and sales pipeline. This approach balances compliance with the growing need for advanced, tailored insights as the business evolves.
Standard reports provide consistency, while customizable reports offer adaptability. Standard reports rely on fixed templates - like P&L statements, balance sheets, and cash flow summaries - that present information in a uniform way. These are perfect for routine tasks like compliance, tax preparation, and meeting lender requirements. They answer the question, "What happened?" in a format that's instantly recognizable to auditors, banks, and investors. On the other hand, customizable reports allow you to set your own metrics, groupings, and dashboards, delivering real-time updates to support faster, more informed decision-making. These reports tackle deeper questions like, "Why did it happen, and what should we do?"
As discussed earlier, these two reporting styles often work best together. For mid-market companies, combining the reliability of standard reports with the agility of customizable dashboards can be a game-changer. Use standard reports as the foundation for tasks like monthly closes, board presentations, audits, and bank compliance. Then, layer customizable dashboards on top to track profitability by product or region, subscription metrics like MRR and churn, scenario planning, and forecasting. This hybrid strategy balances the clarity of standard reports with the deeper insights provided by customizable tools.
Choosing the right reporting approach depends on your business's stage and complexity. If you're running a straightforward operation with less than $20 million in revenue, a single entity, and basic compliance needs, standard reports will likely suffice. However, as your business grows - adding new revenue streams, business units, or subsidiaries - or if you're preparing for fundraising, refinancing, or M&A, customizable reporting becomes indispensable. Investors and lenders not only expect clean, audit-ready financials but also demand tailored insights, such as revenue by cohort, customer concentration, segment-level margins, and cash flow forecasts.
Matching your reporting tools to your business goals is critical. If you're focused on growth, you'll need reports that spotlight revenue drivers, conversion rates, and unit economics. For profitability, you'll want detailed insights into gross margins by product, customer, and channel. And for cash and risk management, tools like runway forecasts, covenant headroom analysis, and scenario planning are essential.
Start by identifying the key questions your business needs to answer and align them with the appropriate reporting tools. Pinpoint any data gaps and decide whether to enhance your current systems or upgrade to a more advanced platform. For tailored solutions, consider consulting experts like Phoenix Strategy Group, who can help design the right data infrastructure to support your growth and prepare for future milestones.
Customizable reports give you the freedom to focus on the metrics that truly matter to your business. Unlike pre-made, one-size-fits-all reports, these can be tailored to meet your specific needs, offering the ability to analyze data from various angles and uncover insights that align with your goals.
What’s more, you can save and reuse custom templates, making it easier to access the information you need without starting from scratch every time. This not only speeds up decision-making but also ensures you’re ready to adapt to changing business conditions. For mid-market companies aiming to grow and refine their financial strategies, these reports can be a game-changer.
Customizable reports give growing businesses the ability to zero in on the insights that align with their specific goals and challenges. Unlike one-size-fits-all reports, these let you focus on the metrics that truly matter, helping you spot trends, monitor performance, and identify opportunities as they happen.
By tailoring data to match your objectives, customizable reports make it simpler to refine strategies, allocate resources where they’re needed most, and make informed decisions with confidence as your business grows.
As businesses expand and their operations become more intricate, the need for customizable reporting often becomes apparent. Standard reports might no longer provide the level of detail necessary to align with evolving goals or support critical decision-making.
Customizable reports are particularly useful for uncovering specific trends, improving performance, and shaping long-term strategies. Whether you're scaling operations, addressing shifting priorities, or preparing to secure funding, having the ability to tailor reports ensures you get the precise insights needed to navigate these challenges effectively.