Published on
March 16, 2026

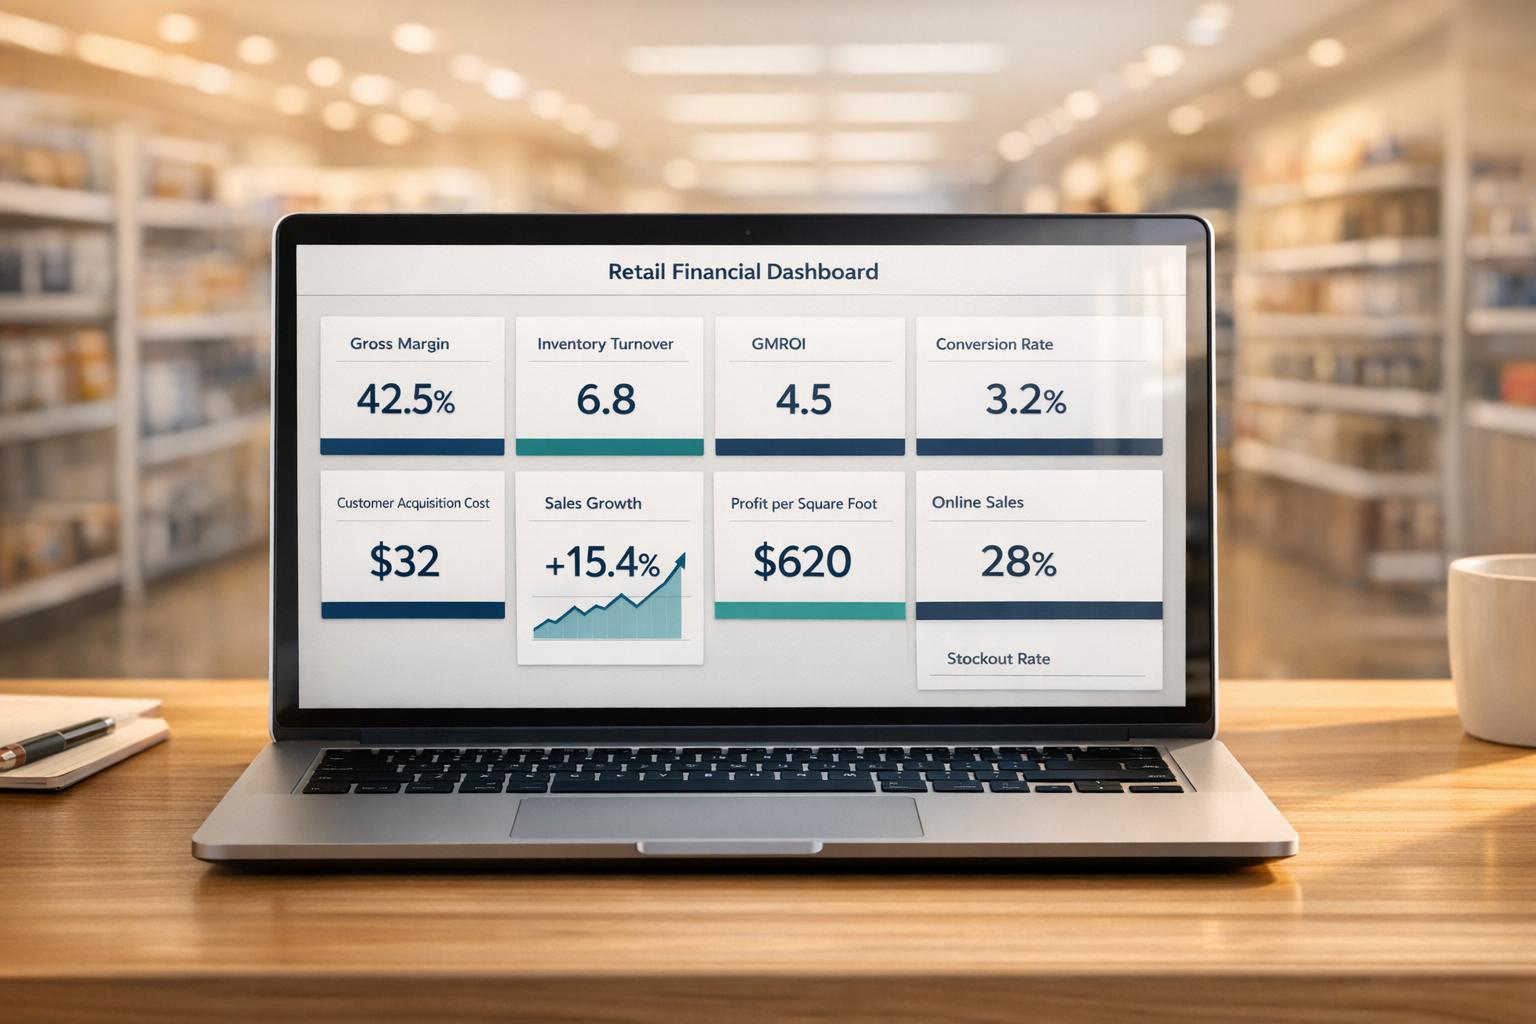
Retail financial dashboards help businesses turn raw data into actionable insights. They consolidate key metrics like sales, inventory, and customer behavior into visual formats, enabling faster decisions and improved profitability. Here are 10 crucial metrics for retail dashboards:
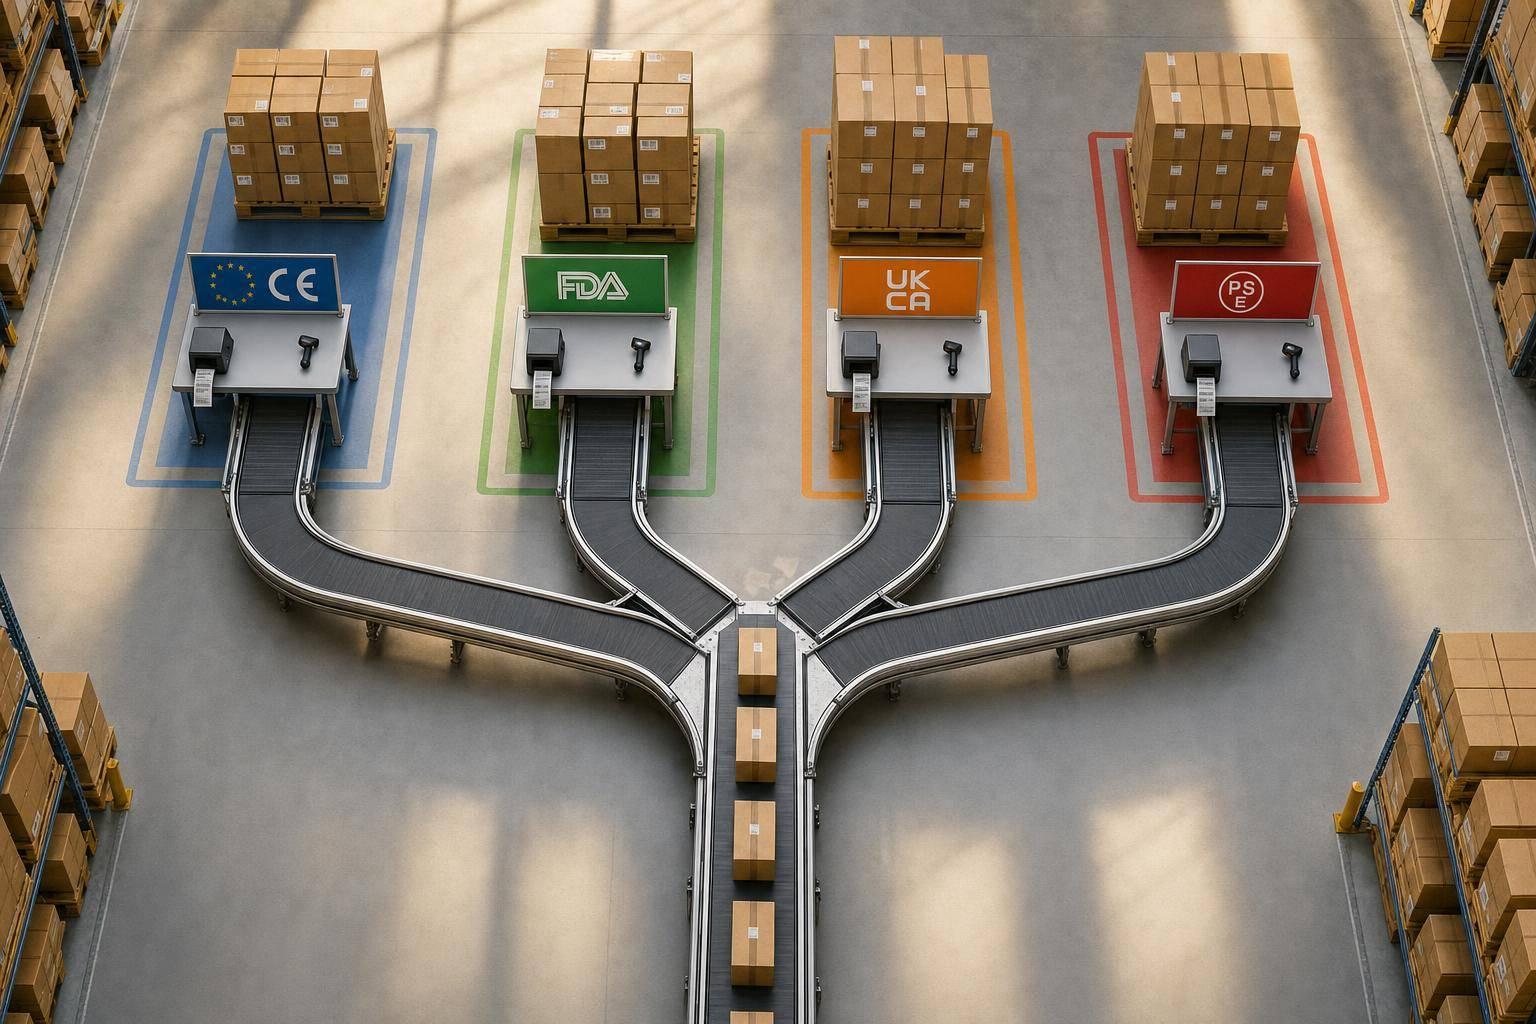
Dashboards integrate these metrics from tools like POS, ERP, and accounting systems, offering real-time updates. This allows retailers to adjust pricing, manage inventory, and refine marketing strategies effectively.
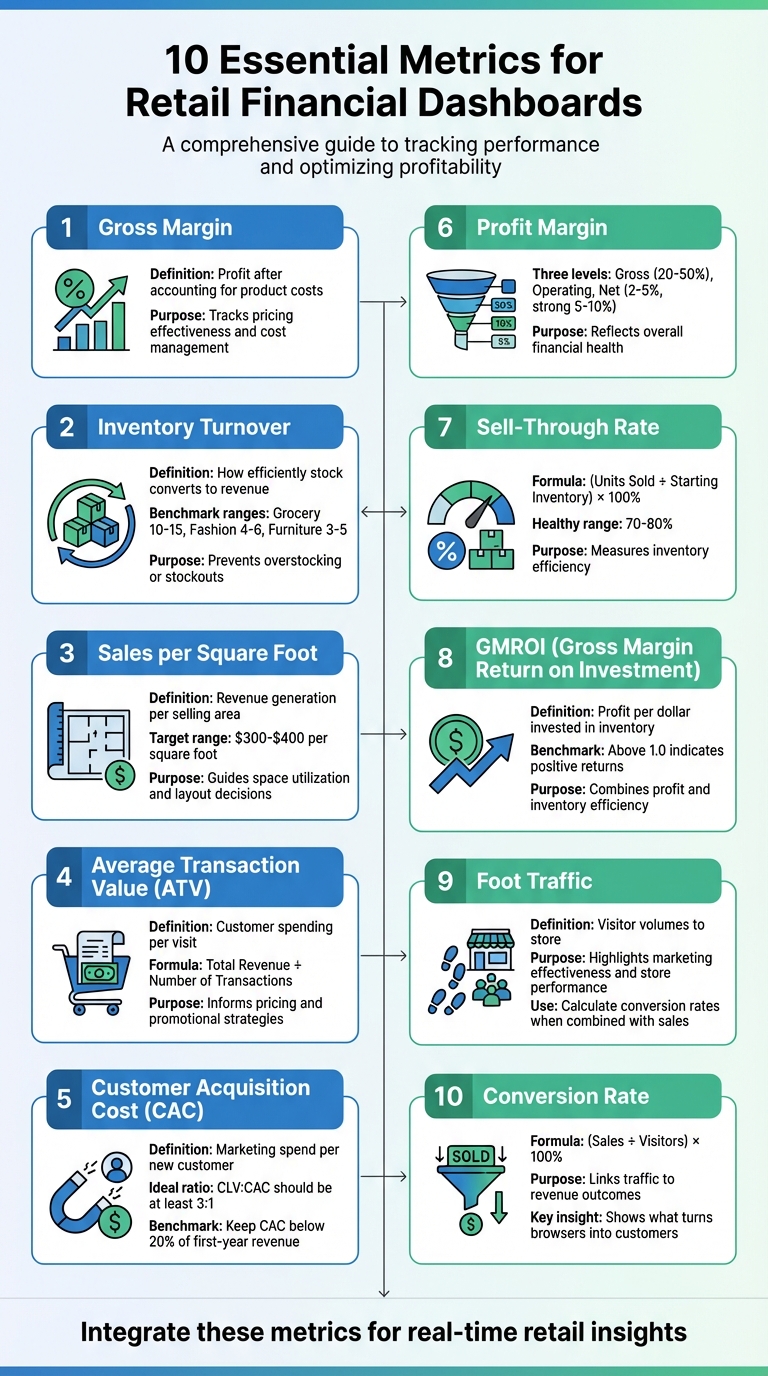
10 Essential Metrics for Retail Financial Dashboards
Gross margin represents the difference between sales revenue and the cost of goods sold (COGS). It's a straightforward way to measure how much profit remains to cover operating expenses after accounting for the cost of products sold [6]. For retailers, this metric answers a critical question: are your sales profitable enough to sustain your business?
Every single product sold impacts gross margin, making it one of the most important indicators of financial health [7]. Expressed as a percentage, it provides a clear view of pricing effectiveness and cost management [7]. This percentage format is especially useful for identifying long-term trends and assessing whether pricing strategies are hitting the mark.
Since gross margin reflects historical data, it highlights what has already occurred rather than forecasting future performance [10]. For instance, if your gross margin declines while sales remain steady, it’s a red flag that rising costs are eating into profits [7]. To stay ahead, retailers should analyze margins at the product or category level. This helps determine which items are boosting profitability and which might need to be rethought [8].
Thanks to modern accounting tools and ERP systems, gross margin calculations are automated and directly drawn from income statements [4][5][6]. This makes it incredibly easy to include in financial dashboards without requiring manual input. Retailers already collect the necessary data as part of standard operations, so dashboards can update in real time. This real-time data ensures that decision-makers have up-to-date insights when they need them most [4].
Gross margin isn’t just a number - it’s a guide for action. It can highlight whether current pricing strategies are sustainable or if changes are necessary [5]. When margins shrink, retailers have a few clear paths: renegotiate supplier contracts, adjust pricing, or cut costs [4][5][9]. It’s also a critical tool for evaluating promotions. While discounts or markdowns might drive sales, gross margin ensures they aren’t cutting into profits more than they should [9]. By analyzing this data, retailers can refine their product offerings - phasing out low-margin items and doubling down on those with higher profitability [8].
Inventory turnover measures how often a business sells and replaces its stock during a specific period. It’s calculated by dividing the Cost of Goods Sold (COGS) by the average inventory value [11]. This metric helps businesses understand how efficiently they’re converting inventory into revenue.
A faster turnover rate can boost cash flow by freeing up tied-up capital. It also lowers storage costs and minimizes the risk of inventory becoming outdated. That said, a turnover rate that’s too high could indicate frequent stockouts, potentially leading to missed sales opportunities. The ideal turnover rate varies by industry: grocery stores typically range from 10 to 15, fashion retailers from 4 to 6, and furniture businesses from 3 to 5 [11]. This ratio serves as a key indicator of financial efficiency and provides actionable insights, especially when tracked using dynamic dashboards.
Modern dashboards make it easier to track inventory turnover by pulling data from systems like financial accounting, inventory management, and point-of-sale (POS) platforms. This integration delivers real-time updates on stock and sales, enabling businesses to monitor turnover weekly or monthly instead of waiting for annual reports [12]. With this level of visibility, retailers can adapt quickly to shifting market conditions.
Turnover data offers valuable insights for managing inventory. For example, slow-moving items can be identified and discounted or promoted to clear shelf space [11]. High-turnover products may require quicker restocking or even automated reordering to prevent stockouts [11][12]. Additionally, tracking trends in turnover can help pinpoint seasonal buying patterns, allowing businesses to fine-tune their ordering schedules and avoid issues like overstocking or running out of popular items. This makes inventory turnover a crucial part of any well-rounded retail dashboard.
Sales per square foot is a key way to gauge how efficiently a retail space generates revenue. It connects total net sales to the physical selling area, excluding spaces like stockrooms, offices, and receiving zones. The formula is straightforward: divide total net sales by the selling area [11][13].
This metric highlights how well a retailer utilizes its physical space to generate income [11]. A typical target ranges from $300 to $400 per square foot, though this varies widely by retail category [14]. For example, luxury retailers often report higher numbers due to premium pricing, while larger stores might show lower figures. These benchmarks help determine whether revenue growth comes from better space usage or simply adding more square footage [14].
Modern dashboards can seamlessly incorporate point-of-sale (POS) data with store layouts, creating heat maps that show revenue density [8][11][14]. This metric often serves as a Tier 2 indicator, enabling managers to drill down from overall revenue to the performance of specific areas [14]. Automated systems reduce calculation errors and provide real-time updates, making it easier to spot trends. While daily updates to net sales are common, tracking sales per square foot monthly offers a clearer view of long-term patterns without being distracted by daily fluctuations [11][14].
This metric is a practical tool for identifying underperforming areas within a store. For instance, low-performing zones can be reconfigured by placing high-margin items in high-traffic spots [11]. Research suggests that products displayed at eye level often sell better than those on higher or lower shelves, which can guide smarter merchandising strategies [8]. Additionally, comparing sales per square foot before and after a store renovation can indicate whether layout changes have improved efficiency [13]. When planning expansions, this data provides solid evidence for opening new locations or downsizing spaces that aren't meeting performance expectations [11][14].
Average Transaction Value (ATV) is a vital metric for retail dashboards, offering real-time data to fine-tune pricing strategies, promotions, and customer experience. It calculates the average spending per customer visit by dividing total revenue by the number of transactions. For instance, if a store generates $50,000 in revenue from 1,000 transactions, the ATV is $50 [15].
ATV plays a pivotal role in boosting profitability. By increasing the average amount customers spend, retailers can make their marketing efforts more efficient. Take this example: if acquiring a customer costs $20, a $100 purchase delivers a much higher return than a $50 purchase. Since fixed costs like payment processing fees and employee wages remain constant per transaction, a higher ATV helps lower the cost-to-serve ratio [15].
Modern point-of-sale (POS) systems make tracking ATV straightforward. These systems sync with accounting and ERP software to provide real-time updates, eliminating the need for manual calculations [9]. ATV also complements other metrics like conversion rates and foot traffic, offering deeper insights into customer behavior. By breaking down ATV by sales channel - such as mobile apps, desktop, or physical stores - retailers can pinpoint where customers tend to spend more [15]. This level of integration enables smarter, data-driven merchandising decisions.
ATV can guide impactful strategies for increasing customer spending. For example, setting purchase thresholds - like free shipping on orders above a certain amount - can encourage shoppers to add more to their carts. Bundling complementary products is another tactic to drive multi-item purchases [15]. However, retailers need to balance these strategies carefully. Overly aggressive upselling might deter shoppers, reducing conversion rates. Comparing ATV with units per transaction (UPT) can reveal whether higher spending comes from big-ticket items or a mix of smaller purchases, helping refine sales strategies [9].
Customer Acquisition Cost (CAC) measures how much it costs to acquire a new customer. To calculate it, divide your total marketing and sales expenses by the number of new customers gained. For example, if you spend $50,000 and acquire 100 customers, your CAC would be $500 per customer. This number accounts for costs like digital ads, in-store promotions, loyalty programs, and sales team commissions. It’s a straightforward way to assess whether your customer growth strategies are financially sustainable.
CAC plays a crucial role in determining if your customer acquisition strategies are profitable. One key metric to compare against CAC is customer lifetime value (CLV). Ideally, the ratio of CLV to CAC should be at least 3:1, meaning every customer should generate three times the cost of acquiring them [17]. If CAC exceeds one-third of CLV, profit margins can shrink quickly. Retailers who keep CAC below 20% of their first-year customer revenue often experience growth rates that are 2.5 times higher [2].
Tracking CAC effectively requires pulling data from various sources, but modern tools make this easier. Retail dashboards can automatically sync with POS systems, marketing platforms, and accounting software like KORONA POS, Databox, and QuickBooks via APIs. This automation ensures real-time updates to CAC metrics [1][2]. Dashboards can display CAC trends through line charts or gauges, flagging when costs exceed safe levels. Breaking down CAC by channel - such as comparing in-store promotions (averaging $29 per customer) with e-commerce ads (averaging $45 in 2024) - helps pinpoint where your marketing spend delivers the best results [1][2].
CAC data is a powerful tool for optimizing your marketing budget. Regularly comparing CAC to CLV can highlight underperforming channels that may need adjustments or even elimination. Cohort analysis helps identify acquisition sources that deliver strong long-term value, allowing you to focus on the most effective strategies. For example, retailers who use segmentation to tailor promotions have managed to cut their CAC by 22% [3]. Dashboards also provide early warnings when CAC spikes - whether due to seasonal trends or inefficiencies - giving you time to pause campaigns or test new approaches before costs spiral out of control. Regularly benchmarking CAC against CLV ensures smarter, more agile marketing decisions.
Profit margin is the ultimate measure of a retailer's financial health. It reflects how much money a business keeps after covering all its expenses. As Derek Rodner from Agilence explains:
You'll never really know if you're profitable unless you have the right measurements [6].
With modern trends like BORIS (Buy Online, Return In-Store) programs and third-party delivery services driving up costs, keeping a close eye on profit margins has become more important than ever [6].
Profit margins can be analyzed at three key levels: gross, operating, and net.
Understanding these margins is critical for evaluating overall performance and identifying areas for improvement.
Thanks to advances in accounting and POS systems, tracking profit margins has never been easier. These systems automatically calculate key figures like COGS and net income [6]. Retail dashboards now consolidate data from multiple sources - POS systems, e-commerce platforms, and marketing tools - into a single, real-time view. This integration allows retailers to make quick, informed decisions in an ever-changing market [18][19].
Profit margin data serves as a guide for pricing strategies, product selection, and cost management. Harry Chu of TrueProfit emphasizes:
If products are priced too low, even high sales volume may not generate enough profit to cover operating expenses or support business growth [19].
Retailers can use this data in several ways:
Additionally, metrics like Net Profit on Ad Spend (NPOS) help determine whether marketing campaigns are driving actual profits. Retailers can also assess loyalty programs or third-party delivery services to ensure they aren't hurting margins [6].
For more help integrating these profit margin metrics into your financial dashboard, check out Phoenix Strategy Group.
Sell-through rate measures how much of your inventory is sold compared to the starting inventory. It's calculated using the formula: (# of Units Sold / Starting Inventory) × 100% [9]. This metric is a key indicator of how efficiently your inventory turns into sales, making it a vital part of retail financial dashboards.
A healthy sell-through rate typically falls between 70% and 80% [14]. If your rate gets close to 100%, you might face stockouts, while a rate below 50% often points to weak demand or overstocking, tying up cash in unsold products [14]. Monitoring this metric early can help you avoid profit-draining markdowns [9][8].
Modern dashboards can automatically pull sell-through data from ERP and POS systems [9][4]. These systems track sales against starting inventory, offering real-time updates across channels like Shopify, Amazon, or brick-and-mortar stores [14]. Placing sell-through metrics in sections like "Inventory Health" or "Category Summaries" on your dashboard allows for deeper analysis of sales trends and margin shifts. Tracking this data weekly or monthly ensures you can make timely adjustments to your inventory strategy [9]. This seamless integration supports real-time decision-making tied directly to merchandising efforts.
Sell-through data can guide decisions about inventory management. Products with high sell-through rates should be prioritized for more shelf space and faster reorders to avoid running out of stock [14]. On the other hand, items with rates under 50% may need discounts or promotions to clear stagnant inventory and free up cash [14]. Ranking your product catalog by sell-through rate can also highlight items that need better visibility or uncover cross-selling opportunities based on related buying patterns [9]. For a balanced financial view, compare sell-through rates with Gross Margin Return on Investment (GMROI) to ensure high sales volumes align with profitability goals [9][8].
GMROI reveals how much profit you're making for every dollar invested in inventory. It ties together profitability and how well you're using your assets, offering a clear view of financial performance. A GMROI of 1.0 means you're just breaking even on your inventory investment, while anything higher indicates stronger returns. Unlike metrics like sell-through rate, which focus purely on sales volume, GMROI digs deeper to show whether those sales are actually profitable.
"GMROI might be the most important KPI to track in your retail business, because it gives the best overall picture of your store's performance." – Retail Insights, ArcherPoint [5]
To calculate GMROI, divide your gross margin by the average inventory cost over a specific period [5]. If you're using an ERP system, you're in luck - most of them already track this data automatically. This means you can monitor GMROI in real time, whether you’re looking at individual products, entire categories, or the whole store. Companies like Phoenix Strategy Group specialize in creating financial dashboards that integrate metrics like GMROI, making it easier to stay on top of your numbers and adjust strategies as needed.
Drilling down into GMROI at the product level can reveal whether your inventory is pulling its weight. If certain items or categories show a low GMROI, it’s a red flag that pricing or merchandising strategies might need a rethink. This insight allows you to shift toward a more data-driven approach to managing inventory, ensuring your investments are working as hard as they should [5].
Foot traffic serves as a critical indicator of both visitor volume and in-store performance. By analyzing foot traffic alongside sales figures, you can calculate conversion rates - for instance, dividing Total Sales by Total Foot Traffic gives you a clear picture of how effectively visitors are turning into customers [8][9]. If sales are declining, traffic data can help pinpoint whether the issue lies in attracting customers or converting them.
When combined with metrics like GMROI, foot traffic offers a more comprehensive view of store performance. It also reflects the success of your marketing efforts. For example, a spike in foot traffic after launching an ad campaign or updating your storefront suggests these strategies are drawing people in [8][9]. High traffic levels indicate strong brand awareness and effective top-of-funnel efforts, such as visually appealing window displays. On the other hand, low traffic may highlight the need to improve external marketing or enhance your store's curb appeal.
Thanks to modern technology, foot traffic data is now easier than ever to track and analyze. Sensors can seamlessly integrate with ERP and accounting systems, providing real-time updates [4]. This data can be visualized through charts and graphs, making it simple to assess trends and compare them with revenue metrics across multiple stores [16].
"I use Databox... and it has been super beneficial for me because it organizes all critical information in one place. The best part is that it arranges data in the form of graphs and charts, making it easy for me to look at key metrics at a glance." – Aviad Faruzon, Faruzo [2]
Foot traffic data doesn’t just measure visitor count; it also uncovers deeper insights. For instance, high foot traffic combined with low sales might signal internal challenges like pricing issues, inventory shortages, or staff performance problems [8][9]. On the flip side, low traffic suggests opportunities to enhance your marketing efforts or improve your storefront’s appeal.
This data can guide adjustments to window displays, signage, or staffing during peak hours to better match customer behavior [8][9]. These insights lay the groundwork for deeper analysis, such as evaluating conversion rates in the next section.
The conversion rate tells you the percentage of visitors who complete a purchase, calculated as: (Sales ÷ Visitors) × 100 [18]. It’s a key indicator of how well your retail strategy turns interest into revenue. As Angus Chang from Petswithme explains:
"Conversion rates KPI is the most important to include in a retail KPI dashboard. It is the most important KPI which offers insights into what turns browsers into customers." [2]
While marketing campaigns might boost awareness and increase foot traffic, the conversion rate shows whether that interest translates into actual profit. Chang further emphasizes:
"Traffic and awareness have value, but if you don't get a measurable profit from them, you don't have anything to show for it." [2]
This metric also helps you compare performance across store locations, offering a direct link between visitor behavior and revenue outcomes.
Modern dashboards make it straightforward to track conversion rates by pulling data from tools like foot traffic sensors or web analytics and combining it with Point of Sale (POS) systems [18]. Visual elements like graphs and color-coded indicators make trends easy to spot. When displayed alongside visitor data, conversion rates give you a clear picture of how well your efforts are converting interest into sales.
Low conversion rates paired with high foot traffic often point to underlying issues, such as pricing, product selection, or checkout obstacles [18]. For instance, high traffic but low sales might signal problems with store layout, staffing, or how products are displayed [2]. By comparing conversion rates across locations and analyzing the time it takes for visitors to make a purchase, you can identify bottlenecks in your sales process and refine strategies to attract buyers who are ready to commit.
The 10 metrics discussed - like Gross Margin, Inventory Turnover, Conversion Rate, and GMROI - are essential for building retail dashboards that provide a clear picture of business performance. These metrics highlight how well you’re managing your inventory, utilizing your space, and converting customer interest into sales. When combined into dashboards, they transform raw numbers into actionable insights, helping you respond quickly and effectively to business challenges.
Tracking these metrics together also uncovers valuable connections. For example, one electronics retailer combined pricing and promotion data to monitor markdown percentages alongside gross margin trends. This allowed them to intervene early, boosting margin retention by 7% [20]. Dashboards like these empower smarter decision-making by showing how pricing strategies, inventory control, and profitability intersect.
Real-time tracking of metrics such as Sell-Through Rate, Foot Traffic, and Average Transaction Value enables quick adjustments to staffing, store layouts, and product placement. Meanwhile, monitoring long-term metrics like Customer Acquisition Cost, Profit Margin, and Sales per Square Foot helps identify growth opportunities, benchmark against competitors, and guide decisions about investments or expansion.
Of course, creating these dashboards can be tricky when your data is scattered across systems like POS software, inventory tools, and accounting platforms. That’s where expert help becomes invaluable. Phoenix Strategy Group specializes in FP&A and fractional CFO services, helping retailers design custom dashboards that integrate these 10 key metrics. Their tailored solutions make it easier to scale operations, secure funding, and make data-driven decisions using advanced tools and proprietary insights.
Your retail financial dashboard needs to track 10 essential metrics to effectively monitor your financial performance and guide decision-making. These include:
These metrics together provide a clear snapshot of your financial health and support smarter, data-driven strategies.
Keeping dashboard metrics updated in real-time or at least daily is essential for providing decision-makers with the most current insights. The update frequency can depend on the type of metric and what your business requires. For instance, sales teams might benefit from real-time updates, while weekly summaries might suffice for broader strategic metrics.
To keep tabs on retail financial metrics in real time, leverage platforms that bring together and automate data from sources like accounting software, payment processors, bank feeds, and ERP systems. These tools allow you to continuously monitor key figures like gross margin and cash flow without missing a beat. Cloud-based FP&A platforms and ERP dashboards take it a step further by offering customizable views and automation features, simplifying data updates and cutting down on manual reporting tasks.