Published on
March 16, 2026

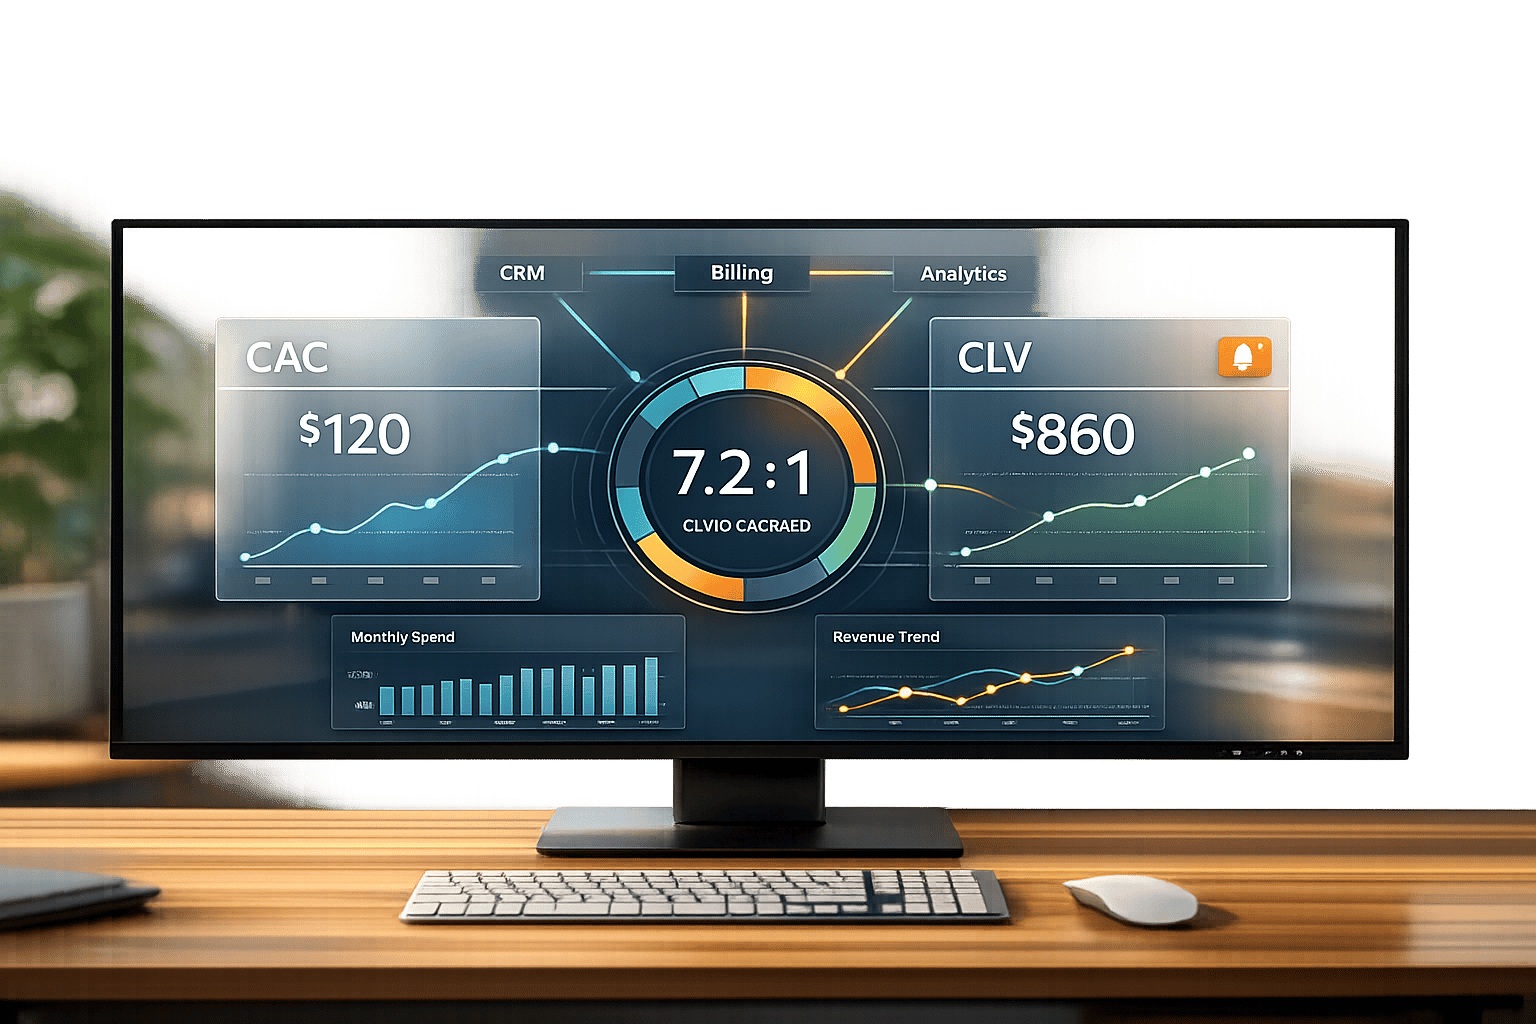
Tracking Customer Acquisition Cost (CAC) and Customer Lifetime Value (CLV) in real-time can help you make faster, data-driven decisions. These metrics are critical for SaaS businesses to measure profitability and growth potential. A healthy CLV-to-CAC ratio is typically 3:1, meaning for every $1 spent on acquiring a customer, you should generate $3 in return. Real-time monitoring allows you to quickly identify issues like rising acquisition costs or missed growth opportunities.
To create a real-time dashboard, you’ll need to:
This dashboard helps you monitor profitability, adjust strategies on the fly, and optimize spending. Below, you’ll learn step-by-step how to build and maintain it effectively.
Before setting up your real-time dashboard, it’s crucial to understand the formulas for Customer Acquisition Cost (CAC) and Customer Lifetime Value (CLV).
To calculate CAC, divide your total sales and marketing expenses by the number of new customers acquired. These expenses can include everything from ad budgets and sales team salaries to software subscriptions and agency fees.
For instance, if you spend $50,000 on sales and marketing and gain 100 new customers, your CAC would be $500. Be thorough in accounting for all acquisition-related costs, such as onboarding expenses, sales team overhead, and tools. In B2B SaaS, targeting small to mid-sized businesses, CAC often ranges between $300 and $5,000. On the other hand, consumer ecommerce SaaS typically sees a CAC of around $64 [3].
Customer Lifetime Value (CLV) is determined using three key inputs: average revenue per user (ARPU), gross margin, and customer lifetime (calculated based on churn rate). The formula looks like this:
CLV = (ARPU × Gross Margin) ÷ Churn Rate
For example, imagine your average customer spends $100 per month, your gross margin is 80%, and your monthly churn rate is 5%. Using the formula, your CLV would be ($100 × 0.80) ÷ 0.05 = $1,600.
For early-stage startups, it’s often necessary to adjust CLV using a discount rate to account for risk and uncertainty in future cash flows. Typically, this ranges from 15-20% for early-stage startups, 10-15% for later-stage companies, and 8-10% for public companies [4].
The go-to benchmark for a healthy SaaS business is a 3:1 CLV-to-CAC ratio, although this can vary depending on your business model [1][2][3]. A ratio like this ensures you’re covering acquisition costs while leaving room for reinvestment and profitability.
For B2B SaaS companies, higher contract values often lead to ratios around 4:1. Meanwhile, B2C SaaS businesses, which face higher churn and lower acquisition costs, average closer to 2.5:1 [2][3]. If your ratio drops below 1:1, you’re losing money on every customer and need to take immediate action [1][2]. On the flip side, a ratio above 5:1 might mean you’re not spending enough on growth and missing opportunities to capture market share [1][4].
Early-stage startups often fall between 1:1 and 3:1 as they work toward achieving product-market fit, which is acceptable during this phase [1][4]. Additionally, top-performing SaaS companies aim for a CAC payback period of under 12 months, ensuring steady cash flow while scaling [3].
Next, we’ll dive into the tools and data sources you’ll need to create your real-time dashboard.
To stay on top of these metrics, you'll need to bring together data from various platforms into a single, real-time reporting system.
Creating a live CAC vs. CLV dashboard means pulling data from multiple sources. For instance, your CRM (like Salesforce or HubSpot) handles customer acquisition and sales data, while your billing platform (such as Stripe or Chargebee) tracks revenue and subscriptions. Meanwhile, tools like Google Analytics or Mixpanel monitor user behavior and conversions. All these data streams should flow into a central data warehouse where you can calculate and update metrics in real time.
Google BigQuery works well as the core repository for such data. Using tools like Google Pub/Sub, Dataflow, and the BigQuery Storage Write API, you can set up a pipeline to stream data directly into BigQuery for live analysis. This approach ensures your dashboard reflects up-to-the-minute activity instead of relying on outdated batch updates [5].
For visualization, Looker Studio (formerly Google Data Studio) integrates seamlessly with BigQuery’s streaming tables. It supports auto-refresh intervals as low as one minute, while BI Engine speeds up queries with minimal resource use [5]. If building this pipeline sounds complex, Phoenix Strategy Group offers data engineering solutions to automate the connection between your data sources and dashboard.
To maintain data accuracy, use live API connections and automated synchronization between your source platforms and the data warehouse. BigQuery’s materialized views with time filters (like INTERVAL 24 HOUR) are perfect for frequently accessed data, and Looker Studio’s "Extract Data" feature can handle non-real-time metrics to avoid costly full-table scans [5].
Lastly, set up scheduled queries in BigQuery to flag anomalies, such as sudden spikes in CAC. You can even trigger alerts through Cloud Monitoring to stay informed in real time [5].
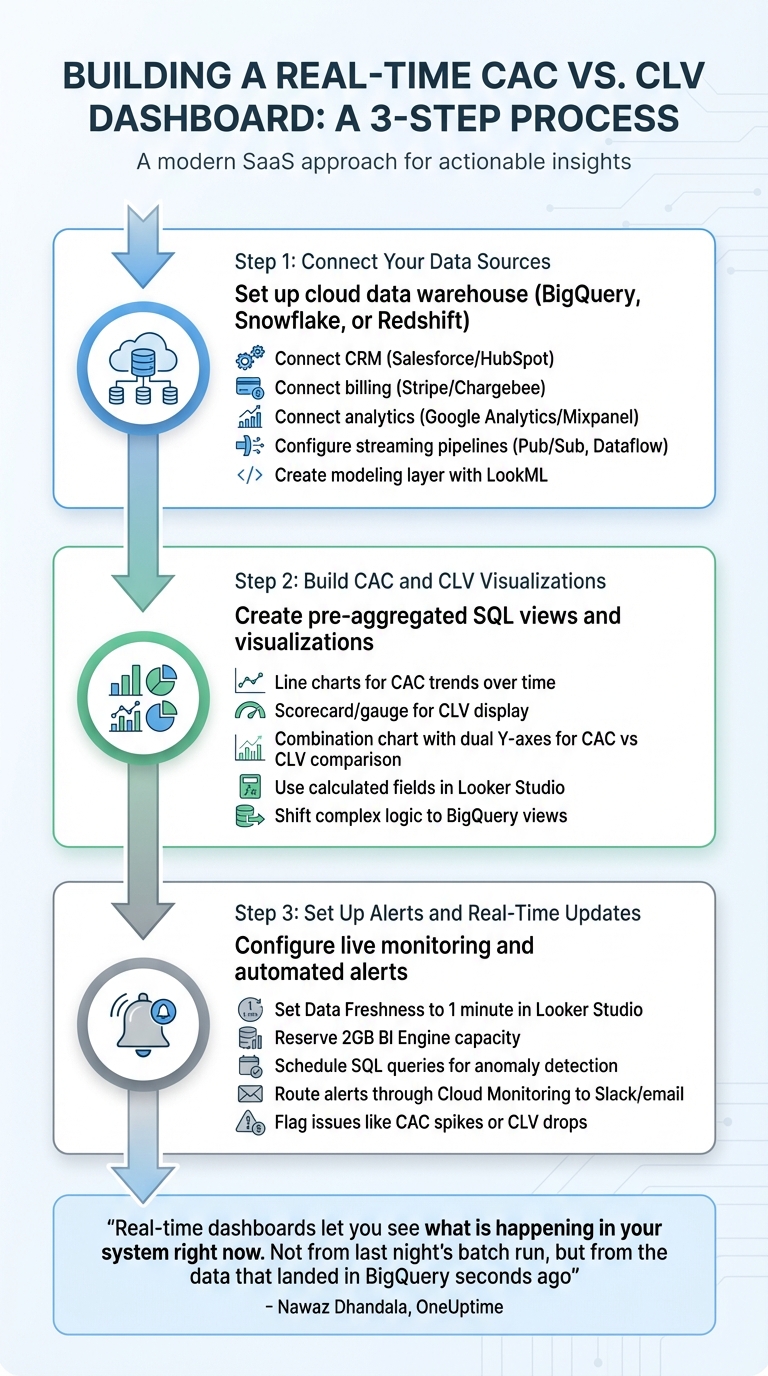
How to Build a Real-Time CAC vs CLV Dashboard in 3 Steps
Start by setting up a cloud data warehouse like Google BigQuery, Snowflake, or Amazon Redshift to act as your central hub. This is where you’ll consolidate data from systems such as Salesforce or HubSpot (for CRM), Stripe or Chargebee (for billing), and analytics platforms like Google Analytics or Mixpanel [7].
To keep your data fresh, configure streaming pipelines using tools like Pub/Sub, BigQuery Storage Write API, or Dataflow [5]. For efficient querying, enable ingestion time partitioning and clustering when setting up BigQuery tables. This ensures that queries targeting recent data run faster [5].
Next, create a modeling layer (using tools like LookML) to define your business logic in one place. This is where you’ll set up dimensions (e.g., sign-up date, acquisition channel) and measures (e.g., total monthly recurring revenue, active user counts). This consistency ensures that all reports pull from the same logic [7].
Once your data is connected and structured, you’re ready to move on to creating visualizations for CAC (Customer Acquisition Cost) and CLV (Customer Lifetime Value).
To improve dashboard performance, create pre-aggregated or materialized SQL views. These views reduce query costs and speed up load times [5][6]. For example, you can calculate total sales and marketing costs divided by new customers acquired over a specific time frame.
When building visualizations, focus on key metrics. Use line charts to track CAC trends over time, helping you spot fluctuations by week or month. For CLV, include a scorecard or gauge to display the value clearly. A combination chart with dual Y-axes works well for comparing CAC and CLV side-by-side, making it easy to see when your ratio is off balance [6].
If you need to create derived metrics like conversion rates or average revenue per user, Looker Studio’s calculated fields can help. However, if these calculations slow down your dashboard, shift the complex logic to BigQuery views to maintain performance [6].
Once your visualizations are set, it’s time to configure alerts and real-time updates.
In Looker Studio, adjust the Data Freshness setting to 1 minute to ensure your dashboard reflects live data [5]. As Nawaz Dhandala from OneUptime puts it:
"Real-time dashboards let you see what is happening in your system right now. Not from last night's batch run, but from the data that landed in BigQuery seconds ago" [5].
To maintain speed during real-time updates, reserve BI Engine capacity (around 2GB) in Google Cloud. This caches frequently queried data in memory, keeping performance smooth [5]. For metrics that don’t change as often, like weekly trends, use longer refresh intervals to save on query costs [5].
Automate anomaly detection by scheduling SQL queries in BigQuery. Set up checks to flag issues, such as event rates dropping below 100 within a 5-minute window. Use IF statements to generate system errors or log messages when thresholds are breached. Then, route these alerts through Cloud Monitoring to tools like Slack or email [5][8]. This setup ensures you’ll catch and address issues as soon as they arise.
Once your dashboard is built, the next step is ensuring it runs efficiently and can handle growth without breaking the bank.
Alerts are your early warning system for unusual shifts in key metrics. Instead of picking arbitrary thresholds, base your alerts on historical data trends. For example, set an alert if your Customer Acquisition Cost (CAC) exceeds 1.5 times its 30-day rolling average or if your Customer Lifetime Value (CLV) drops below a 3:1 ratio compared to CAC. A deviation of about 20% from the rolling average is often a good starting point - it highlights potential issues without overwhelming you with false alarms.
In Looker Studio, the built-in "Alert" feature lets you set conditions like "CAC > $150", with notifications sent straight to your email or Slack. Before going live, test these alerts using simulated data to ensure they work as intended. If an alert gets triggered (like a 30% overnight spike in CAC), investigate immediately. Check for changes in bids or campaign settings, and pause underperforming campaigns within 24 hours to minimize wasted spending. [9]
Now, let’s talk about managing the costs of processing real-time data.
Real-time data processing is faster but comes with a higher price tag compared to batch updates. Here’s a quick breakdown:
| Aspect | Batch | Real-Time |
|---|---|---|
| Cost per GB | $0.01–$0.05 | $0.10–$0.50 |
| Latency | Minutes to hours | Seconds |
| Resource Use | Scheduled jobs | Continuous streaming |
| Best For | Stable metrics | Immediate decisions |
For a SaaS company with around 10,000 users, real-time processing costs typically range from $200 to $1,000 per month. Tools like Google Cloud Pub/Sub (about $0.40 per million operations) or Snowflake streaming (roughly $2–$4 per credit) are great options. To trim costs, filter out unnecessary data - focus on paid acquisition events rather than processing every user action. Serverless solutions like AWS Lambda (approximately $0.20 per 1 million requests) can also help. A tiered approach works well: use real-time updates for critical metrics and batch processing for historical data. [9]
With these strategies, you can keep costs manageable while maintaining dashboard performance.
Creating a CAC vs. CLV dashboard is just the start. The real value comes from using it to guide strategic decisions. That’s where Phoenix Strategy Group can help. Their FP&A and fractional CFO services go beyond tracking metrics - they help you turn data into actionable insights. Whether you need custom KPI dashboards tailored to your growth stage, live data integrations, or accurate bookkeeping for CAC tracking, they’ve got you covered.
With a track record of supporting over 240 portfolio companies and assisting in raising more than $200 million, Phoenix Strategy Group brings expertise to the table. They also offer CLV forecasting models to prepare you for funding rounds or exits. [9][10][11]
This dashboard takes raw data and turns it into insights you can use to make decisions quickly. By linking tools like your CRM, billing system, and analytics platform, you create a single, reliable view of your most important metrics. To summarize customer acquisition cost (CAC) and customer lifetime value (CLV), use the formulas shared earlier: calculate CAC by dividing your total sales and marketing spend by the number of new customers acquired, and determine CLV using average revenue per user (ARPU), gross margin, and churn rate. Keep an eye on your CLV:CAC ratio - it’s a critical health check. A ratio under 1.0x signals unsustainable costs, while anything over 5.0x might mean you’re missing growth opportunities.
Real-time tracking is a game-changer. Instead of waiting weeks to notice trends or problems, you can spot them within hours and adjust your strategies on the fly. This responsiveness can lower acquisition costs by 20–30% and increase lifetime value through better retention efforts. The result? Faster revenue growth and stronger investor confidence when the time comes to scale or prepare for an exit.
Now it’s time to take action. Start by building your dashboard. Review your current data sources - whether it’s Salesforce, Stripe, HubSpot, or another tool - and choose a platform that supports live updates. Use the CAC and CLV formulas to create your first visualizations, then test real-time feeds and alerts to ensure everything works smoothly. Even a simple dashboard can quickly provide insights that change how you allocate resources and plan your next steps.
If you’re looking for expert help with advanced financial modeling or maintaining data accuracy as you grow, consider scheduling a free 30-minute consultation with Phoenix Strategy Group. Their fractional CFO and FP&A services have helped over 240 portfolio companies raise more than $200 million by turning real-time data into actionable strategies[11][12]. Whether you’re gearing up for your next funding round or fine-tuning your unit economics, they can help you turn your dashboard into a powerful tool for growth.
Customer Acquisition Cost (CAC) represents the total expenses involved in bringing in a new customer. This includes direct costs like advertising spend and sales commissions, as well as indirect costs such as employee salaries, marketing tools, and software used in the process.
By carefully tracking all these expenses, businesses can ensure their CAC calculations are accurate and reflect the true cost of acquiring customers.
To calculate CLV (Customer Lifetime Value) when dealing with fluctuating churn rates, use this formula: CLV = (ARPA × Gross Margin) ÷ Churn Rate. To improve accuracy, consider analyzing churn over an extended timeframe or use an average churn rate to balance out inconsistencies. Keeping a close eye on churn trends and adjusting your calculations accordingly ensures that CLV stays a dependable metric, even when churn rates shift unpredictably.
The frequency with which you update your CAC vs. CLV dashboard should match your business's specific needs and how quickly you need to make decisions. For SaaS companies focused on growth and managing cash flow, daily or near real-time updates are often the way to go. This allows you to spot trends quickly and act on them without delay. Make sure your dashboard setup aligns with your operations and helps you stay flexible and data-driven.