Published on
November 10, 2025

Taking control of your money starts with knowing where you stand. A financial health assessment can be a game-changer, whether you’re running a small business or managing personal budgets. It’s not just about numbers—it’s about gaining clarity on your income, debts, and savings to make smarter decisions for tomorrow.
Many of us go through life without a clear picture of our monetary stability. Are you saving enough? Is your debt load sustainable? These questions can feel overwhelming, but they don’t have to be. By evaluating key metrics like your debt-to-income ratio or net worth, you uncover strengths and weaknesses in your financial habits. Tools that analyze your fiscal wellness simplify this process, turning complex data into actionable steps. Imagine spotting a high expense area and redirecting those funds to build an emergency stash—it’s empowering!
Don’t wait for a crisis to check on your finances. A quick evaluation today can reveal opportunities to grow your wealth or avoid pitfalls. With user-friendly resources at hand, getting a grip on your economic health has never been easier. Start now, and pave the way for a more secure future.
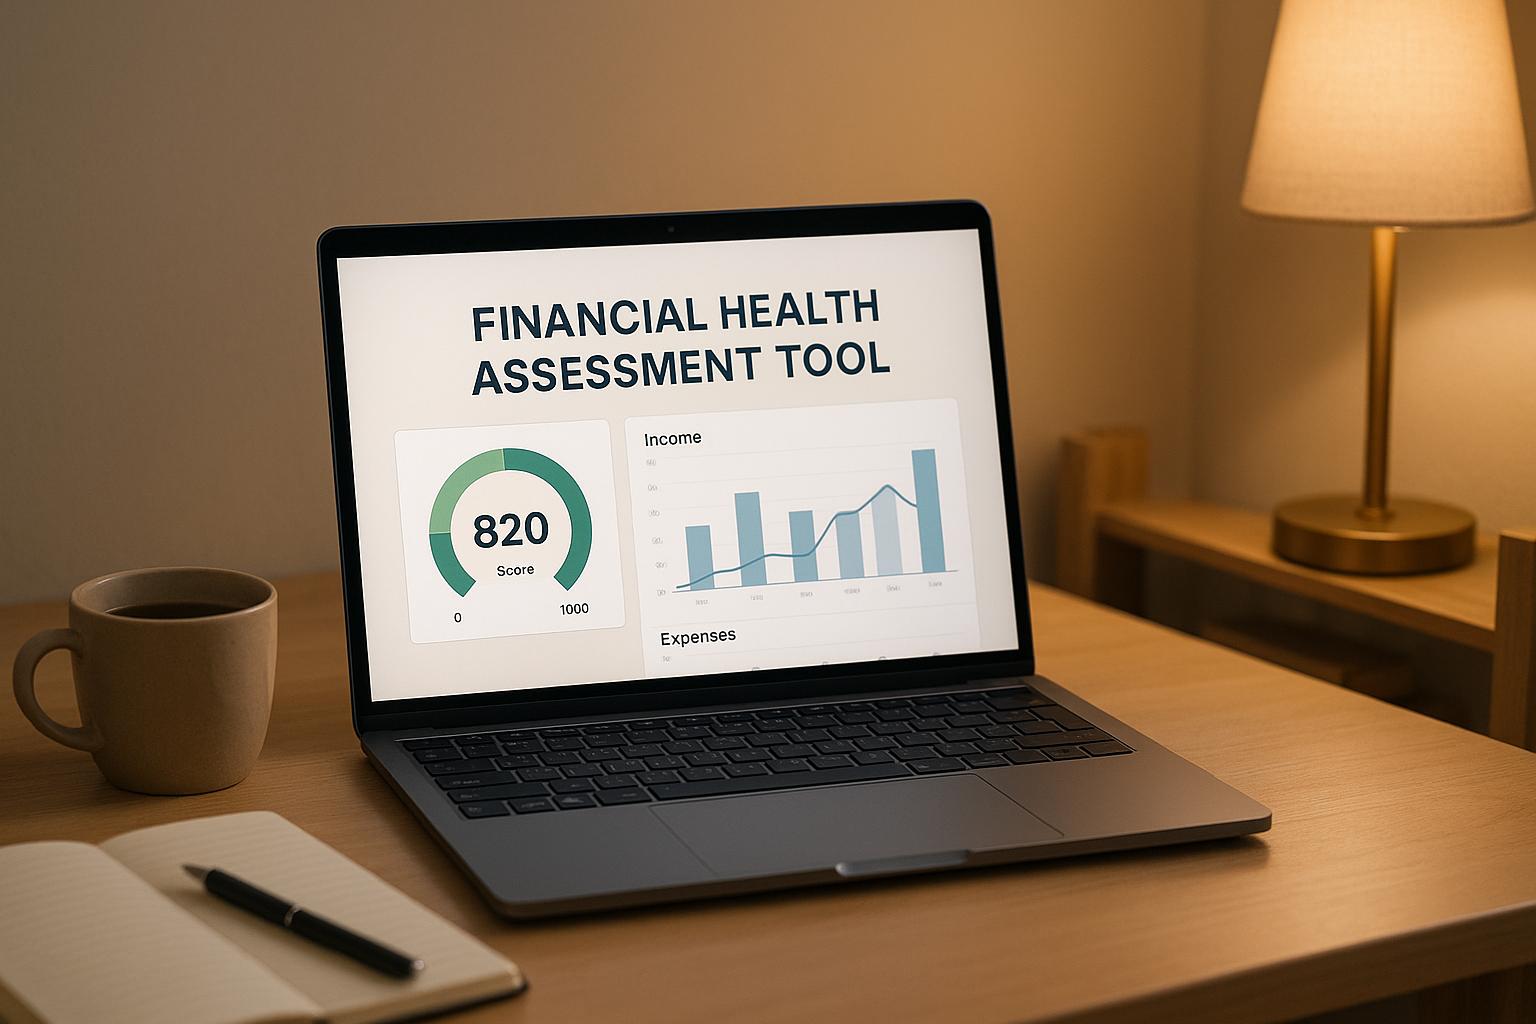
Think of your financial health score as a snapshot of your money situation. It’s a number between 1 and 100 that reflects how well you’re managing income, debt, savings, and expenses. A higher score means you’re in a stronger position—maybe you’ve got low debt and solid savings. A lower score might signal areas to work on, like cutting expenses or tackling loans. Our tool breaks it down so you know exactly where you stand and what to do next.
Your debt-to-income ratio is a simple measure of how much of your income goes toward debt each month. We take your total monthly debt payments and divide them by your monthly income, then multiply by 100 to get a percentage. For example, if you earn $5,000 a month and pay $1,000 in debt, your ratio is 20%. A lower percentage is better—it shows you’ve got more income free for saving or spending. We’ll flag if yours is high and suggest ways to bring it down.
No worries! Our tool is designed to work with whatever info you’ve got. If you’re missing some numbers—like exact savings or asset values—just leave those fields blank or estimate as best you can. We’ll still provide a score and insights based on the data you provide, though the more details you include, the more accurate your results will be. You can always come back and update your inputs later for a refreshed analysis.