Published on
April 28, 2026

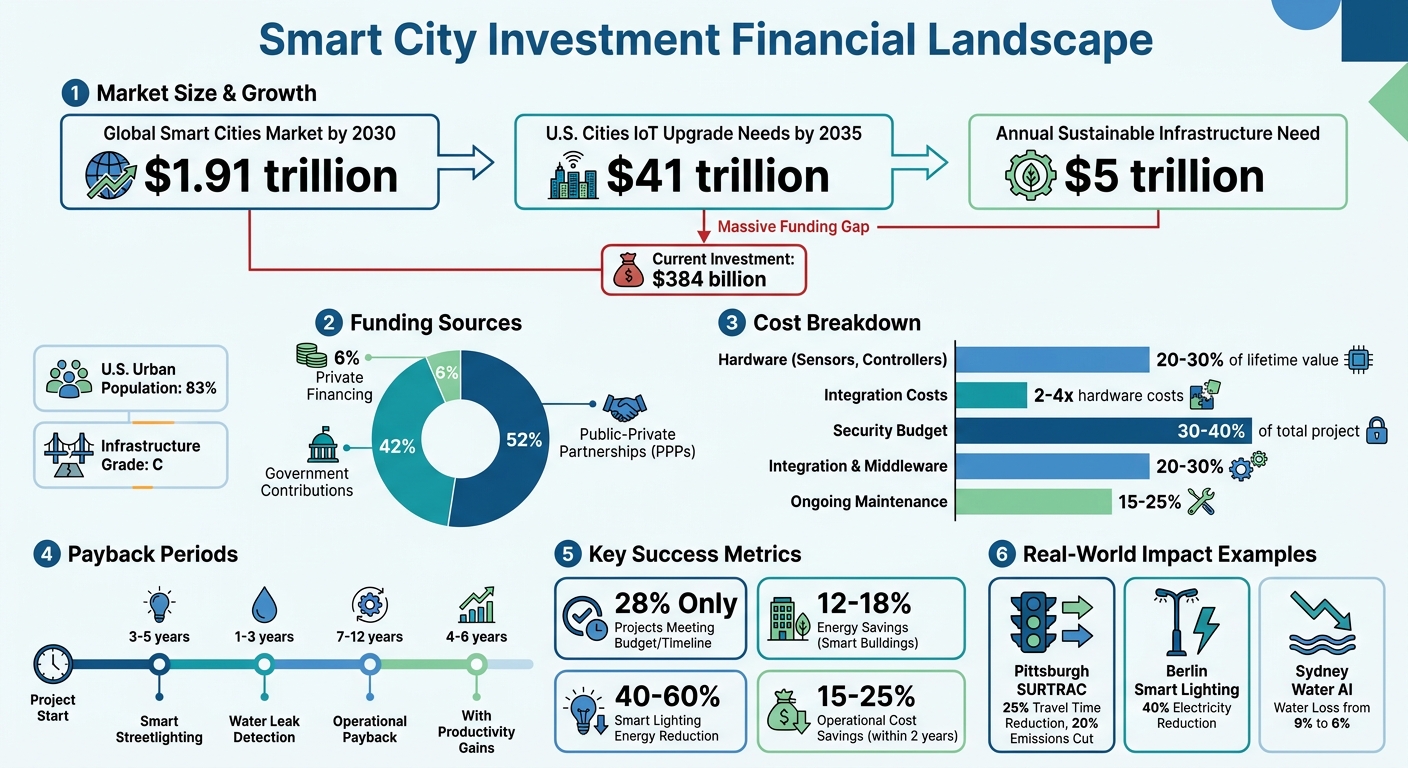
Smart city projects are reshaping urban areas, but they come with unique financial challenges. With 83% of the U.S. population living in cities and infrastructure receiving a "C grade" from engineers, there's a clear need for smarter, technology-driven solutions. By 2030, the global smart cities market is expected to surpass $1.91 trillion, with U.S. cities alone requiring $41 trillion for IoT upgrades by 2035. However, funding complexities, long payback periods, and balancing financial returns with social goals make these initiatives tricky to manage.
Key Takeaways:
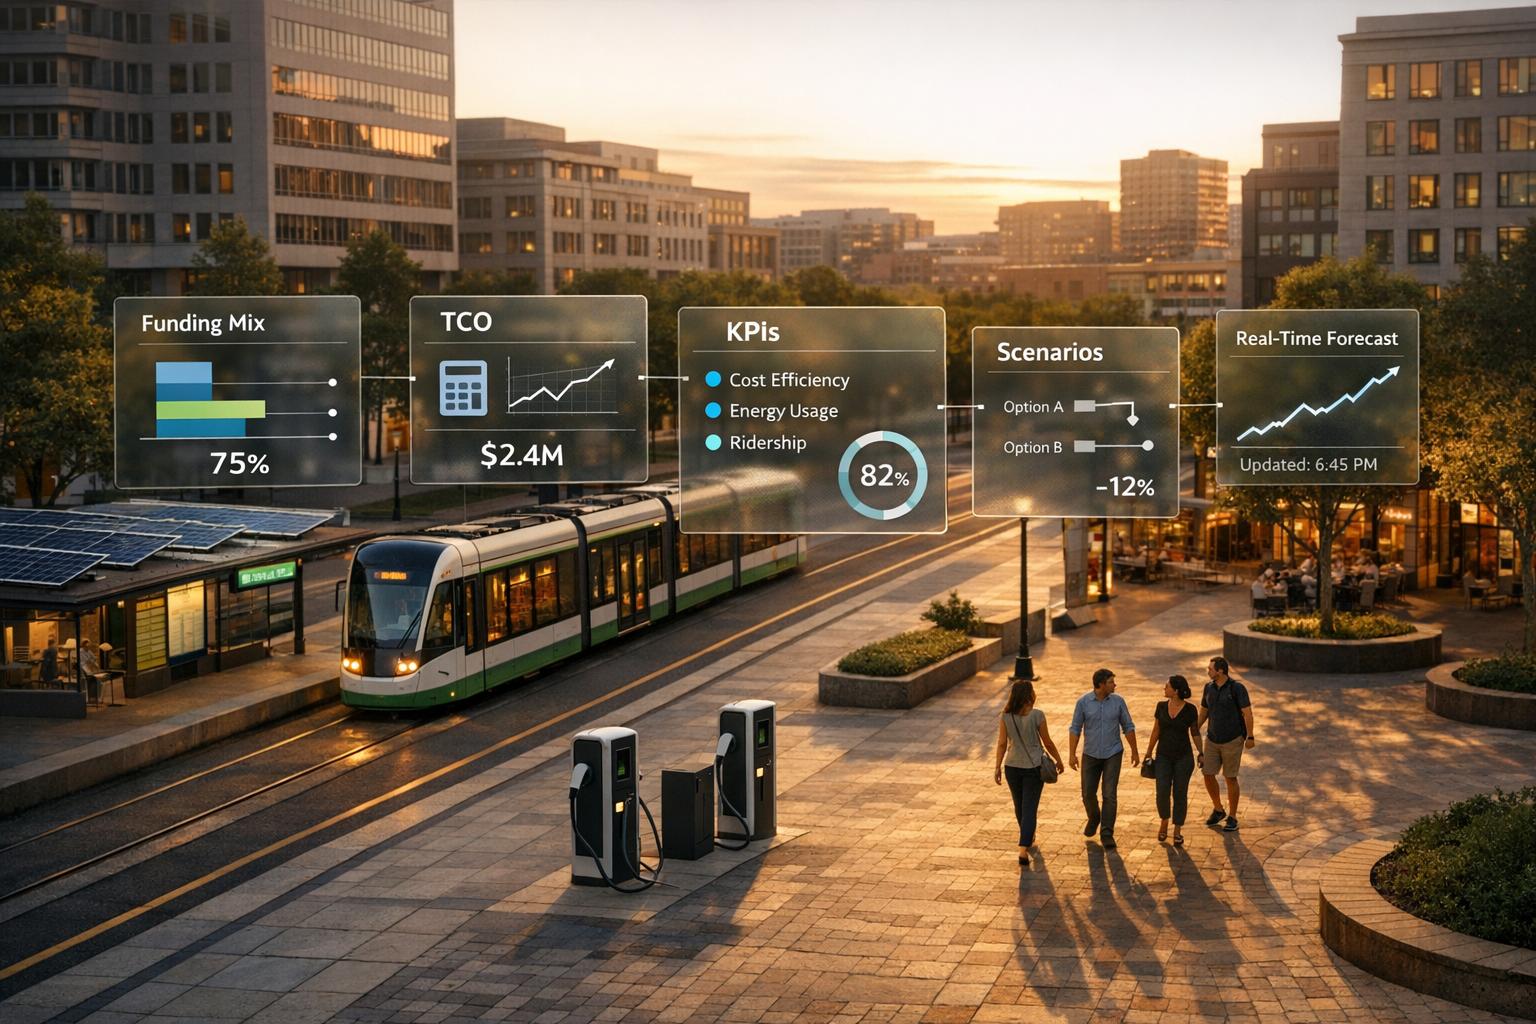
Financial Planning and Analysis (FP&A) is critical, using tools like scenario planning, real-time data integration, and multi-dimensional forecasting to ensure smart city investments deliver measurable outcomes. By focusing on both financial and social metrics, cities can create sustainable urban environments while attracting investors.
Smart City Investment Financial Breakdown: Funding Sources, Costs, and ROI Metrics
Smart city projects operate within a financial framework that’s quite different from traditional infrastructure investments. These projects feature complex funding arrangements, longer timelines, and success metrics that go beyond financial returns, factoring in environmental and social outcomes. Let’s break down what makes smart city investments unique.
Public-private partnerships (PPPs) are at the core of funding. In fact, data from six leading smart cities shows that PPPs account for 52% of total funding. Government contributions make up 42%, while private financing lags behind at 6% [4]. These partnerships help balance risks and rewards between public and private sectors, enabling large-scale tech deployments that might otherwise be financially unfeasible.
Payback periods for smart city projects also introduce challenges. Operational payback typically spans 7–12 years, but factoring in productivity gains can shorten this to 4–6 years [6]. While hardware costs - like sensors and controllers - make up just 20% to 30% of a system’s lifetime value, integration, data management, and security expenses can exceed hardware costs by two to four times over the project lifecycle [5].
"Government financial officers can play a key role in enabling this transformation using fiscal policy, Public Private Partnership, and performance-based revenue models."
– Steven Hamilton, Senior Manager, Deloitte [1]
Revenue models for these initiatives are evolving. More cities are adopting pay-for-performance arrangements, where efficiency improvements, data analytics, or advertising revenues are shared between investors and public sectors. Alternative financing options like green bonds, crowdfunding, and qualified infrastructure bonds are also gaining traction to meet the specific needs of these projects.
Smart city investments generally fall into several categories, each with its own financial and operational characteristics:
Funding complexities create substantial hurdles. Take Columbus, Ohio, as an example: its projects often rely on a mix of federal grants, state funds, municipal bonds, private equity, and even philanthropic contributions. Managing these diverse funding sources requires advanced financial modeling and stakeholder coordination, areas where FP&A (Financial Planning and Analysis) techniques are indispensable.
Balancing financial returns with environmental and social goals is another challenge. Unlike traditional infrastructure investments, which focus on cost recovery and efficiency, smart city projects aim for a "triple bottom line" that includes financial, environmental, and social benefits. This complicates ROI calculations and demands new performance metrics that go beyond simple dollar savings.
Total Cost of Ownership (TCO) is another critical factor. A project initially budgeted at $10 million for hardware may end up costing $20 million to $40 million once integration, security, and maintenance are factored in. Security alone can consume 30% to 40% of the total project budget, especially since 67% of smart city deployments experience a security incident within their first year [5]. Effective FP&A strategies are vital for navigating these costs and optimizing returns.
| Cost Category | Typical % of Total Cost | Financial Planning Adjustment |
|---|---|---|
| Hardware (sensors, controllers) | 15–25% | Prioritize rental/leasing models |
| Integration & Middleware | 20–30% | Use standardized APIs (e.g., ISO 37120) |
| Security & Compliance | 12–20% | Budget 30–40% more than initial estimates |
| Ongoing Maintenance | 15–25% | Establish SLAs that guarantee performance |
Vendor lock-in and outdated technology can further inflate TCO by 30% to 50% over 15 years [6]. To mitigate this, cities are increasingly favoring vendor-agnostic systems and open data standards, even if these come with higher upfront integration costs. Balancing cutting-edge technology with long-term adaptability is key to keeping costs under control.
For growth-stage companies navigating smart city investments, having a strong FP&A (Financial Planning and Analysis) framework is essential. These projects often involve intricate funding mechanisms, long payback periods, and hybrid financial metrics. With the right FP&A strategies, businesses can turn uncertainty into actionable insights, making it easier to manage the financial complexities of urban infrastructure. Below are some targeted approaches that help transform raw data into meaningful decisions for smart city projects.
Driver-based models rely on economic indicators and historical data to forecast future costs and revenues. Unlike static budgets, these models focus on key variables - such as the pace of technology adoption, shifts in policies, or utility usage trends - and assess how changes in these drivers can influence financial outcomes.
For smart city projects, scenario planning is a must. Take an intelligent transportation initiative, for example. A company might create three scenarios:
Regression analysis helps quantify how these variables, like policy changes or technology uptake, impact project economics [7].
A real-world example comes from the City of Phoenix, which uses financial planning to maintain a general fund balance of at least 5% of total expenditures within five years. This approach ensures liquidity and cushions against revenue swings [8].
"Financial excellence ensures the effective and efficient allocation of city resources for the delivery of quality services to residents." - City of Phoenix [8]
This kind of forward-thinking strategy allows organizations to adapt quickly to risks as they arise.
IoT sensors and 5G networks generate continuous streams of data from smart city infrastructure. FP&A teams that incorporate this real-time information can monitor project performance instantly, enabling predictive decision-making and performance-based revenue models.
For instance, Pittsburgh’s SURTRAC AI platform optimizes traffic signals at over 50 intersections, cutting travel times by 25% and vehicle emissions by 20% [2]. Similarly, Barcelona’s smart water network, equipped with more than 18,000 IoT sensors, detects leaks immediately, saving millions of liters of water annually [2]. For companies investing in such systems, real-time data can deliver measurable returns within 12 to 18 months.
To maximize the benefits, ensure interoperability by requiring open APIs and standardized data formats. This guarantees that data flows seamlessly into FP&A systems for comprehensive analysis.
| Application Domain | KPI | Baseline Range | Smart City Target |
|---|---|---|---|
| Traffic Management | Average intersection delay | 45–90 seconds | <30 seconds |
| Smart Lighting | Energy consumption per luminaire | 150–250 kWh/year | <80 kWh/year |
| Water Networks | Non-revenue water (leakage) | 20–40% | <10% |
| Waste Management | Collection route efficiency | 60–70% bin utilization | >85% utilization |
Source: Sustainability Atlas, 2025 [2]
Unlike typical annual budgets, smart city investments demand longer-term financial forecasts. Multi-year planning considers factors like policy changes, potential technology obsolescence, and shifting market demands. A five-year capital plan, for example, might balance spending on new infrastructure while maintaining existing assets to ensure financial stability as technology evolves.
Effective forecasting combines internal company data with external economic trends. Cities like Phoenix use both internal and external inputs to maintain responsible revenue forecasts [8]. Another example is Helsinki’s Whim platform, which integrates public transit, bike-sharing, and taxis into a single real-time subscription model. Data from the platform shows that 38% of users replaced private car trips with these alternatives [2]. For companies investing in mobility-as-a-service platforms, forecasts must simultaneously account for adoption rates, regulatory frameworks, and competition from other transportation options.
"A well-designed city budget is characterized by transparency, accountability, and adaptability." - Sarah Lee [7]
Flexible budgets and forecasts, supported by scenario analysis and contingency planning, are vital for smart city projects. FP&A systems that adapt to unexpected changes ensure that projects remain viable, even under shifting conditions. This adaptability strengthens the foundation for sustainable urban infrastructure investments.
Phoenix Strategy Group’s FP&A tools offer growth-stage companies the systems they need for this kind of detailed analysis. From real-time financial data integration to advanced forecasting models and KPI tracking, these tools make it easier to oversee smart city investments across multiple dimensions, adjusting plans as new data comes in.
Creating financial models for smart cities requires a careful balance between profitability and sustainability. These models must evaluate cash flows while considering traditional revenue streams alongside environmental factors. Key components include initial capital investments (like infrastructure and regulatory fees), ongoing operational costs (such as maintenance and security), and diverse revenue sources like rental income, advertising, data analytics, and increased property values [3][10].
To evaluate project viability, standard valuation metrics are essential. Net Present Value (NPV) accounts for the time value of money and risk in future cash flows. Internal Rate of Return (IRR) highlights the expected growth rate of returns. The Payback Period measures how quickly infrastructure investments are recouped, while Cost-Benefit Analysis (CBA) assesses both financial returns and qualitative factors, such as social and environmental benefits [10].
Take Hudson Yards in New York, for example. This multi-billion-dollar venture transformed an underdeveloped area into a thriving mixed-use hub by leveraging advanced planning and diverse revenue streams. Similarly, South Korea's Songdo International Business District was designed as a smart city from the ground up, boosting property values while reducing long-term costs [10]. These projects illustrate how well-structured models can achieve both economic success and sustainability goals.
Investments in smart cities come with unique uncertainties, such as regulatory changes, technology obsolescence, and fluctuating cash flows. Sensitivity analysis helps manage these risks by testing how variations in key factors - like interest rates, policy incentives, or market conditions - impact ROI. This approach enables stakeholders to anticipate risks before committing capital [10].
Key variables should be identified and tested through unified what-if scenarios and simulations. For instance, changes in regulatory timelines or technology costs can significantly affect NPV projections. Tools like digital twins - virtual replicas of urban environments - allow stakeholders to simulate scenarios and stress-test assumptions, reducing risks before construction begins [10]. Combining these insights with environmental and social metrics strengthens the reliability of financial models.
Incorporating sustainability metrics into financial models adds depth by aligning them with urban sustainability goals. These metrics go beyond profit calculations, tracking factors such as carbon reduction, energy efficiency, water conservation, and social inclusion alongside traditional financial indicators [3][10].
A great example is Columbus, Ohio's Smart Cities Challenge project. With $40 million from the U.S. Department of Transportation, $10 million from Vulcan Philanthropies, and $100 million in private investment, the initiative focused on ride-sharing to connect underserved communities. This approach aimed to drive economic benefits while improving health outcomes [3]. By combining revenue forecasts with social impact metrics, the project offered a more comprehensive view of its value.
Performance-based revenue models also support sustainability by enabling public and private stakeholders to share gains from efficiency improvements, advertising, and data analytics [3]. Additionally, incorporating green incentives - such as tax rebates, green funding, and expedited permits - can significantly enhance project economics. Evaluating efficiency gains from technologies like energy-efficient systems further helps lower operating costs over time [10].
"Achieving sustained ROI in urban projects is not solely an outcome of financial expertise; it involves strategic foresight, technological integration, and adaptive risk management." - Sarah Lee, Number Analytics [10]
Phoenix Strategy Group exemplifies this approach with its FP&A systems, which integrate real-time financial data with sustainability metrics. This dual focus allows investors to monitor both profitability and environmental impact, ensuring that smart city projects deliver strong financial returns while advancing urban sustainability.
Smart city budgeting is a delicate balancing act that combines traditional financial discipline with a forward-thinking approach. Unlike standard infrastructure projects, smart cities face unique hurdles: fast-changing technologies, diverse stakeholder demands, and the challenge of aligning profitability with sustainability goals. The numbers paint a stark picture - cities need around $5 trillion annually for sustainable infrastructure development, yet only $384 billion is currently being invested [12]. This massive funding gap underscores the importance of precise budgeting and forecasting to make every dollar count.
The best smart city budgets find strength in combining broad strategic planning with detailed, ground-level input. Top-down budgeting provides a high-level financial framework through tools like fiscal policies, Public-Private Partnerships (PPPs), and performance-based revenue models. These methods allow public and private sectors to share the financial benefits of efficiency improvements and data-driven insights [3]. This approach ensures that citywide goals, like sustainability and net-zero commitments, remain central.
On the other hand, bottom-up budgeting, especially through Zero-Based Budgeting (ZBB), builds the budget from scratch rather than relying on prior years as a baseline [13]. A successful pilot in a mid-sized city demonstrated how combining grant funding with private investments can make this approach effective.
Breaking down departmental silos is another critical step. For instance, Barcelona centralized procurement across departments when implementing smart technologies, cutting public transportation costs by leveraging economies of scale [13]. Similarly, Singapore ties every project expense to its projected ROI through merit-based budgeting, ensuring transparency and effective use of public funds [13].
| Metric | Description | Target Value |
|---|---|---|
| Cost Savings (%) | Annual expenditure reduction | 10% |
| Project Completion Time | Average duration to complete projects | 15% less than baseline |
| Revenue Growth (%) | Increase in revenue from optimized services | 5–7% increase |
| Project ROI | Ratio of net savings to cost of investment | Variable by project |
Tools like Phoenix Strategy Group's FP&A systems are invaluable for connecting real-time financial data across departments and stakeholders. This integrated approach helps smart city planners maintain strategic focus while tracking performance against clear KPIs, ensuring budgets remain aligned with evolving priorities.
Establishing these budgeting practices lays the groundwork for ongoing financial monitoring and quick adjustments in the ever-changing landscape of smart cities.
Once a solid budget framework is in place, continuous monitoring ensures that strategies stay effective in the face of rapid changes. Static budgets often fail in dynamic environments influenced by regulatory shifts or technological advancements. Driver-based planning focuses on key variables that directly impact financial outcomes, enabling quick adjustments as those variables change [11]. This is especially critical when only 18% of organizations can run financial scenarios in under a day, while 33% take an entire week [11].
A great example of this approach is Swarovski's transformation of its cash flow planning in 2025. Under the leadership of Michael Nudelmann, VP Group Controlling and Head of Group FP&A, Swarovski implemented a driver-based forecasting system in just 12 months. Their cross-functional "Cash Squad" met bi-weekly to analyze performance drivers, reducing their cash flow forecasting cycle to two days through automation and driver models [11].
Integrating real-time data is another game-changer. Today, 69% of FP&A efforts go toward manual data consolidation [11]. Connecting ERP, CRM, and IoT systems into a single platform offers finance teams an up-to-date view of project health. Tools like digital twins and interactive dashboards simplify scenario simulations and make it easier to detect budget anomalies [9] [13].
"It's not about perfection - it's about momentum. We're building a culture of insight and readiness."
- Janice Lambert, CFO, American Council on Education [11]
Smart cities can start small by piloting these strategies within select departments. This allows for testing and refining approaches before scaling them citywide [13]. Establishing a dedicated financial analytics team to provide quarterly updates and conduct regular audits can also help identify inefficiencies early, ensuring budgets remain adaptable to changing urban needs [13].
Using FP&A strategic models, KPIs provide measurable benchmarks to evaluate the success of smart city investments. With only 28% of 87 analyzed smart city initiatives meeting their original budget and timeline goals [14], selecting the right KPIs is essential. These metrics must account for financial returns while also addressing sustainability and social outcomes, offering a well-rounded approach to assessment.
Financial KPIs help quantify the success of investments. For smart cities, this involves metrics like Return on Investment (ROI), Net Present Value (NPV), Internal Rate of Return (IRR), and Payback Period [10]. However, these traditional measures need to be adapted to the unique context of smart city projects.
CAPEX Recovery Period offers a clear timeline for when investments begin to pay off. For example, water leak detection systems often recover costs in 1–3 years, smart streetlighting in 3–5 years, while more complex platforms may take 10+ years [14][15]. Bogotá’s $180 million unified fare collection system for its TransMilenio bus network, implemented between 2022 and 2024, is a prime example. It reduced fare evasion by 34%, saving $120 million annually, and improved schedule adherence by 18% [15].
Chennai Metropolitan Water Supply’s partnership with Grundfos and Flutura highlights another success. Their $8.5 million AI-driven pump scheduling project reduced energy consumption by 24%, achieving full payback in just 2.3 years through electricity savings [15].
Demand charge reductions also play a significant role. Smart building systems can cut peak power costs by 15–40% [15], while ongoing operational savings - from reduced labor costs, preventive maintenance, and avoiding infrastructure failures - add further financial value [14]. DC Water’s deployment of 4,800 acoustic leak sensors demonstrates this well. Within 30 months, they reduced unbilled water losses by 38%, saving $8.2 million annually against a $12 million deployment cost, achieving an 18-month payback [14].
The lesson here? Establishing clear baselines before deployment ensures accurate comparisons, proving the financial value of investments.
Financial metrics reveal only part of the picture. Smart city investments must also show measurable improvements in environmental and social outcomes to fulfill their broader purpose and attract green financing.
Energy efficiency is one of the most quantifiable sustainability metrics. Smart buildings typically save 12–18% in energy, while smart streetlighting cuts usage by 40–60%. However, since lighting accounts for only 2–4% of total energy use, its overall impact may be limited [14]. Emerging markets often see more dramatic results. For instance, Kigali, Rwanda deployed 10,000 LED streetlights with IoT sensors from 2021 to 2024. This $28 million project reduced energy costs by 68% compared to older sodium vapor fixtures [15].
Service delivery efficiency measures how well technology improves municipal operations. Leading cities report 12–22% improvements in areas like emergency response and traffic flow [15]. Pittsburgh’s SURTRAC AI platform, for example, reduced travel time by 25% and vehicle emissions by 21% [2][17].
Environmental impact requires a lifecycle carbon assessment, which considers the carbon footprint of IoT devices, from production to disposal, typically 5–15 kg CO2e per device [16]. This ensures operational savings are weighed against manufacturing and disposal costs, avoiding hidden trade-offs.
Social metrics complete the evaluation. These include community engagement, digital literacy, and public health outcomes [14][15]. Geographic equity indices monitor disparities in service delivery, ensuring underserved areas benefit. Trust and adoption metrics address concerns over data collection, which affect 58% of residents [16][17].
The Phoenix Strategy Group’s FP&A systems help cities track these diverse KPIs through integrated dashboards. For municipalities requiring high-level financial leadership to oversee these complex models, fractional CFO services provide the necessary expertise without the overhead of a full-time executive. These tools connect financial, operational, and sustainability data in real time, enabling decision-makers to balance priorities and demonstrate value across all stakeholder dimensions. This comprehensive tracking reinforces a city’s FP&A strategy, ensuring long-term urban success.
Smart city investments are reshaping urban infrastructure, and at the heart of this transformation lies effective financial planning and analysis (FP&A). These projects are anything but simple, often involving multi-year timelines, diverse stakeholders, and the challenge of balancing financial returns with environmental and social goals. To succeed, cities need financial strategies that go well beyond traditional budgeting.
By leveraging tools like data-driven forecasting, scenario-based planning, and real-time monitoring, cities can optimize both fiscal performance and social impact. As Deloitte highlights, "By championing the creation of smart cities, government finance officers can drive urban reinvestment and modernisation" [18]. Take Columbus, for example - its use of mixed funding sources to enhance urban transportation demonstrates how thoughtful FP&A can unlock capital and drive meaningful progress [18].
Innovative financing models are also playing a key role in this evolution. Approaches like performance-based revenue sharing, qualified infrastructure bonds, and cross-government collaborations go beyond standard debt instruments. These models help distribute risks and rewards more equitably between public and private sectors, creating a stronger foundation for long-term success.
What makes this approach even more impactful is the integration of financial, operational, and sustainability metrics. Advanced FP&A systems allow cities to track progress toward economic goals while meeting sustainability targets, whether it's through energy efficiency improvements or expanding services to underserved areas. This kind of integrated planning ensures that smart city investments deliver measurable results.
For cities to thrive in this new era, they must embrace advanced FP&A tools, adopt flexible planning frameworks, and foster collaboration across stakeholders. As Deloitte notes, "By thinking outside the box and partnering in new ways, even resource-constrained federal, state and local governments can participate in smart city programs" [18].
Organizations like Phoenix Strategy Group offer tailored advisory services to help municipalities and businesses implement these strategies effectively. The cities that excel in mastering these financial disciplines will be at the forefront of urban transformation in the decades to come.
To calculate ROI for a smart city project that focuses on social goals, it’s crucial to blend both numbers and narratives. Start by outlining specific social objectives - think cleaner air, safer neighborhoods, or better mobility. Measure tangible outcomes like cost reductions or energy savings alongside harder-to-quantify benefits, such as how satisfied residents feel or improvements in quality of life. Keep revisiting your model to ensure it reflects shifting priorities, and use data analytics to evaluate both the financial and societal effects in a well-rounded way.
Often, the focus on IoT investments revolves around hardware costs, but there are other expenses that can sneak up on you. These include hidden fees, forecast creep, and underutilized services. These factors can quietly inflate vendor expenses and throw off your budget planning. By conducting thorough financial analysis, you can spot these risks early and take steps to minimize their impact, ensuring your investments stay aligned with your goals.
The best KPIs for showcasing the success of smart city investments to funders are those that directly connect technological efforts to tangible improvements in areas such as mobility, energy efficiency, public safety, and service delivery. It's important to focus on metrics that come with clear benchmarks, providing a solid definition of what constitutes strong performance in these critical sectors.