Published on
March 18, 2026

The Labor Efficiency Ratio (LER) is a simple yet powerful metric that shows how much gross profit your business generates for every dollar spent on labor. It’s calculated by dividing gross profit by total labor costs. A benchmark LER of 2.0 means $2 in gross profit for every $1 spent on payroll, and hitting this target can help 90% of businesses consistently meet their profit goals.
Here’s why it matters:
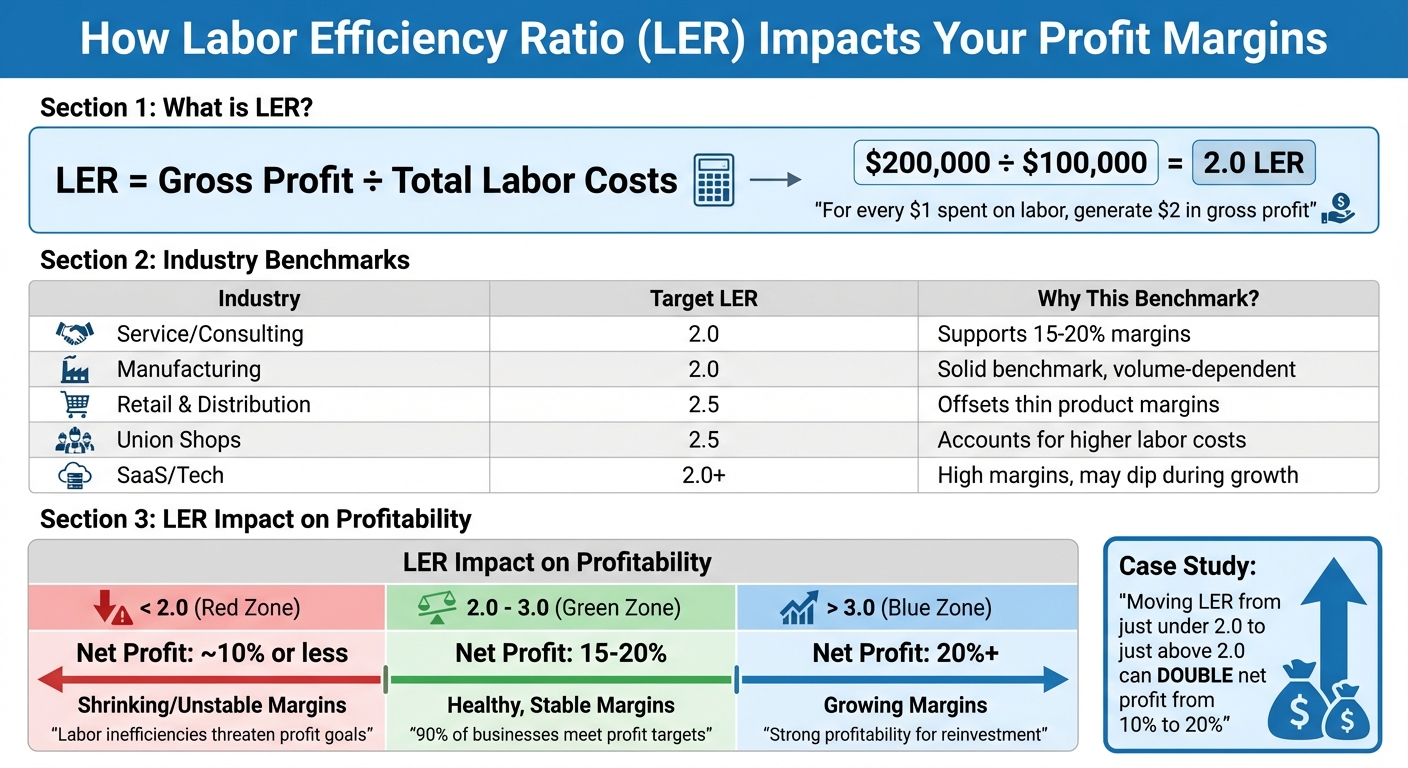
Labor Efficiency Ratio Impact on Profit Margins by Industry
LER, or Labor Efficiency Ratio, is a metric that connects labor costs directly to profitability. It’s calculated by dividing your gross profit by total labor costs. For example, if your labor costs are $100,000 and your gross profit is $200,000, your LER would be 2.0. This means that for every dollar spent on labor, two dollars of gross profit are generated [1].
LER can be further broken down into two categories: Direct Labor Efficiency Ratio (dLER), which measures efficiency for revenue-generating staff, and Management Labor Efficiency Ratio (mLER), which applies to support or overhead roles [2]. This distinction helps businesses pinpoint where inefficiencies might be occurring - whether in frontline operations or in support functions.
Unlike productivity metrics like units produced per hour, LER focuses on the financial impact of labor. By separating direct and management roles, it offers a clearer view of how labor costs influence profit margins.
A widely accepted benchmark for LER is 2.0, meaning $2 of gross margin is generated for every $1 spent on labor. Research shows that 90% of U.S. businesses that maintain this ratio consistently meet their profit targets [2].
However, the ideal LER can vary based on the industry and its specific cost structures:
| Industry | Target LER | Reason for Benchmark |
|---|---|---|
| Service/Consulting | 2.0 | Supports healthy margins of 15–20%. |
| Manufacturing | 2.0 | A solid benchmark, though lower ratios require volume. |
| Retail & Distribution | 2.5 | Offsets thinner product margins. |
| Union Shops | 2.5 | Accounts for higher labor costs. |
| SaaS/Tech | 2.0+ | High margins support strong ratios, though growth phases may lower it. |
Falling below these benchmarks often signals issues like inefficient pricing or overstaffing [2]. On the flip side, an LER of 3.0 or higher typically indicates strong profitability, allowing businesses to reinvest strategically.
Small shifts in LER can have a big impact on net profit margins. For instance, a business operating with an LER slightly under 2.0 might see net profits around 10%. However, increasing the ratio to just above 2.0 could double net profits to 20% [3].
Take the example of Etch, an agency that started tracking LER alongside its utilization ratios in 2025. By improving its LER from just under 2.0 to slightly above, the company saw its net profit jump from 10% to 20%. This improvement also allowed them to set specific LER targets for individual clients and projects [3].
An LER below 2.0 often correlates with unsustainable profit margins, typically under 10%, which can threaten long-term business stability. Beyond profitability, LER can act as an early warning system, highlighting issues like rising overtime costs, project delays, or pricing inefficiencies before they significantly impact the bottom line [1].
Labor Efficiency Ratios (LER) are essential for aligning labor costs with revenue, ensuring a clear connection between efficiency and profitability. Here's a breakdown of how to calculate and interpret the two key components: Direct Labor Efficiency Ratio (dLER) and Management Labor Efficiency Ratio (mLER).
To calculate dLER, use the formula: Gross Profit ÷ Direct Labor Costs. Start by determining your gross profit (revenue minus cost of goods sold or COGS). Then, divide this figure by your direct labor costs - expenses tied to frontline workers.
For instance, if your gross profit is $200,000 and direct labor costs are $80,000, your dLER is 2.5. This means that for every dollar spent on direct labor, $2.50 is generated in gross profit. Service-based businesses often operate efficiently with a dLER between 1.5 and 2.5, though the ideal range can vary depending on the industry.
The mLER formula is: Contribution Margin ÷ Management Labor Costs. First, calculate the contribution margin by subtracting direct labor costs from gross profit. Then, divide that result by management labor costs, which include salaries for supervisors, administrative staff, and executives.
While a dLER of around 2.0 is common, an mLER between 4.0 and 8.0 is generally considered optimal. A low mLER could indicate problems like excessive overhead, an overstaffed management team, or salaries that are too high relative to the margin being generated. These issues often point to inefficiencies in labor productivity.
Here's how different LER ranges affect profitability and operations:
| LER Range | Profit Margin Impact | Operational Implications |
|---|---|---|
| < 2.0 | Shrinking or unstable margins | Labor inefficiencies and difficulty in meeting profit goals |
| 2.0 – 3.0 | Healthy, stable margins | Balanced labor costs and revenue, supporting profit targets |
| > 3.0 | Growing margins | Highly efficient labor utilization with strong profitability (15% or more) |
Regularly tracking your LER can help you spot and address inefficiencies. For example:
If your LER falls below 2.0, it’s wise to focus on increasing revenue or streamlining processes instead of hiring more staff or raising salaries. On the other hand, waiting until your LER exceeds 2.0 before making those decisions can help ensure your labor costs remain aligned with profitability goals. These metrics provide actionable insights to improve both labor efficiency and overall financial performance.
Once you’ve got a handle on your Labor Efficiency Ratio (LER) metrics, it’s time to put that insight into action. Boosting labor efficiency is all about working smarter - ensuring your labor costs align with the revenue they generate. This approach not only keeps your LER healthy but also protects your profit margins.
Start by digging into your financial data to uncover inefficiencies. Look for red flags like overtime spikes, underutilized staff, or processes that drag down productivity. Regular reviews - monthly or quarterly - can help spot these issues early. For instance, if your direct LER (dLER) drops below 2.0, it’s a sign to hit pause on hiring or salary increases until you identify the root cause. Often, the problem isn’t about headcount but about how time is being used - think excessive meetings or outdated workflows.
A great example of this comes from Gravitas Legal. In August 2025, they adopted Flowace’s automated timesheet and time-tracking system, cutting out the need for manual entries. This change saved employees an average of 37 minutes a day [1]. That kind of visibility helps pinpoint where time - and money - is being wasted. By addressing inefficiencies like these, you’re setting the stage to optimize both direct labor and overhead costs.
Another key to hitting your LER targets is keeping overhead and direct labor costs in check. If management overhead seems out of proportion to the value being generated, it could signal inefficiencies like an overstaffed admin team or redundant management roles. Adjusting workforce planning to focus on revenue forecasts - rather than reacting to short-term pressures - can help balance these costs.
Weekly check-ins can also make a big difference. Use these meetings to highlight productivity wins and address any drags on performance. As Greg Crabtree, author of Simple Numbers, Straight Talk, Big Profits, explains:
"90% of businesses consistently meet their profit goals when they maintain an LER of about 2.0" [1].
After addressing inefficiencies and rebalancing costs, technology and expert advice can help maintain progress. Automated tools provide real-time insights into labor expenses, reducing the risk of errors and delays that come with manual tracking. These systems can alert you to potential overtime issues before they escalate, giving you the chance to act quickly. Plus, they integrate seamlessly with payroll systems, eliminating duplicate entries and creating reliable audit trails [1].
For more in-depth support, consider working with financial advisors who specialize in scaling businesses. Take Phoenix Strategy Group, for example. They offer fractional CFO services, financial planning and analysis (FP&A) systems, and data engineering expertise to help businesses track LER metrics, forecast cash flow, and implement effective changes. Their Weekly Accounting System and Monday Morning Metrics provide the real-time financial visibility you need to keep labor costs aligned with revenue growth. Tools like these are essential for maintaining strong profit margins as your business expands.
Your Labor Efficiency Ratio (LER) is a direct driver of profit margins. Unlike broader metrics like revenue-per-employee, LER ties every payroll dollar to the gross profit it generates. Companies that maintain effective LER targets see real results - 90% of businesses hit their profit goals when their LER hovers around 2.0, meaning $2 in gross profit for every $1 spent on labor costs [1]. In professional services, even a slight increase in LER, moving from just under 2.0 to just over, can double net profit from 10% to 20% [3]. These shifts can be the difference between thriving and struggling.
Regularly tracking LER is critical for identifying inefficiencies early, especially for growth-stage companies where hiring decisions can either accelerate growth or create unsustainable overhead. As Bonita Richter, MBA at Profit Strategies, explains:
"The Labor Efficiency Ratio always indicates when decisions need to be made in order for the business to become or remain profitable" [4].
The roadmap is straightforward: consistent LER monitoring, breaking down metrics by department, and leveraging automation to simplify the process. For businesses seeking expert guidance, Phoenix Strategy Group provides fractional CFO services and FP&A systems tailored for growth-stage companies. Their tools, like the Monday Morning Metrics and Weekly Accounting System, offer real-time insights to help align labor costs with revenue as your business scales. With the right mix of automation and expert advice, LER becomes a powerful tool to keep labor costs in check and profit margins on track.
Labor costs in LER (Labor Efficiency Ratio) encompass more than just wages. They include wages, taxes, benefits, and fully burdened rates - essentially, the total hourly cost of employing someone. This calculation accounts for all the expenses tied to hiring and keeping a worker on the payroll.
To determine the right Labor Efficiency Ratio (LER) target, start by comparing your metrics to industry standards. Typically, an LER above 2 suggests a profitable operation. Make it a habit to monitor your LER regularly, measure it against industry averages, and tweak your targets as trends and performance evolve. This strategy allows you to set realistic goals that align with your specific industry while finding ways to boost labor productivity over time.
To boost the Labor Efficiency Ratio (LER) without adding new hires, the key is making the most of your current resources. Start by analyzing labor costs tied to specific production processes. This helps pinpoint areas where inefficiencies might be lurking. From there, focus on streamlining workflows to enhance productivity.
Cutting down on waste and idle time is another priority. Better scheduling and automation can go a long way in achieving this. It’s also worth keeping a close eye on overtime and labor rates. These can highlight where adjustments to staffing or shift patterns might be needed, ensuring your team’s efforts are more closely aligned with revenue-driving activities.