Published on
July 8, 2026

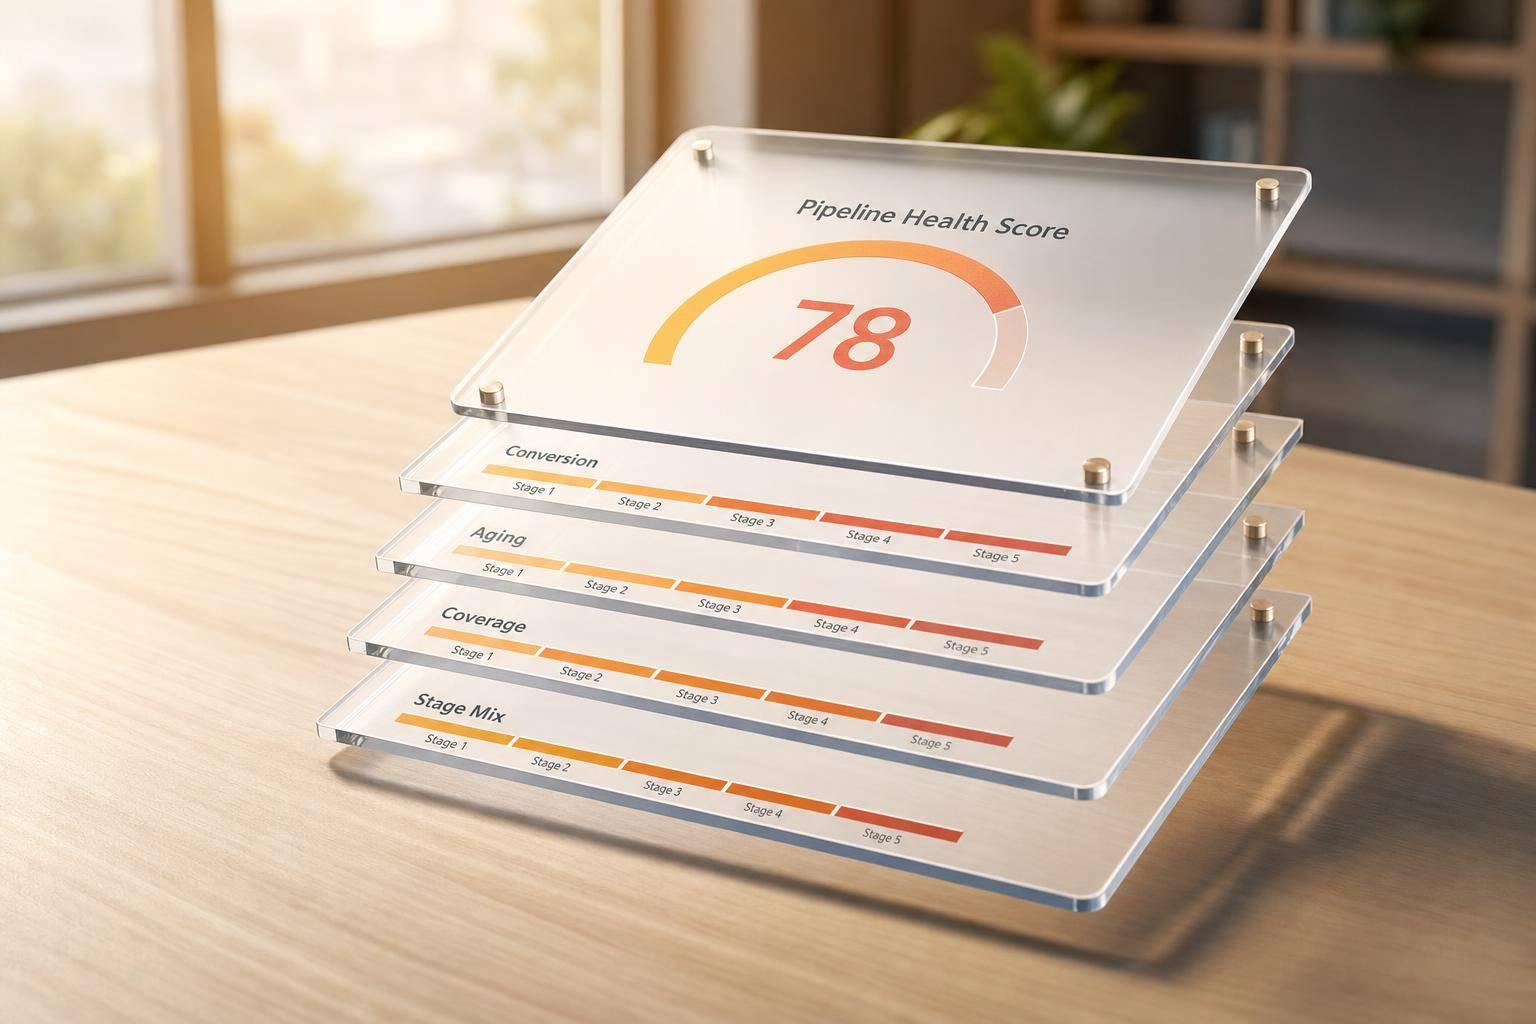
A big pipeline does not mean a safe forecast. I’d judge pipeline health with four inputs: conversion, aging, coverage, and stage mix. Then I’d roll them into a 0–100 score, where 80+ usually means stronger forecast confidence, 60–79 means caution, and below 60 points to pipeline risk.
Here’s the short version:
If I wanted a fast snapshot, I’d use a point-score model. If I wanted a sharper read on forecast risk, I’d use a weighted-score model.
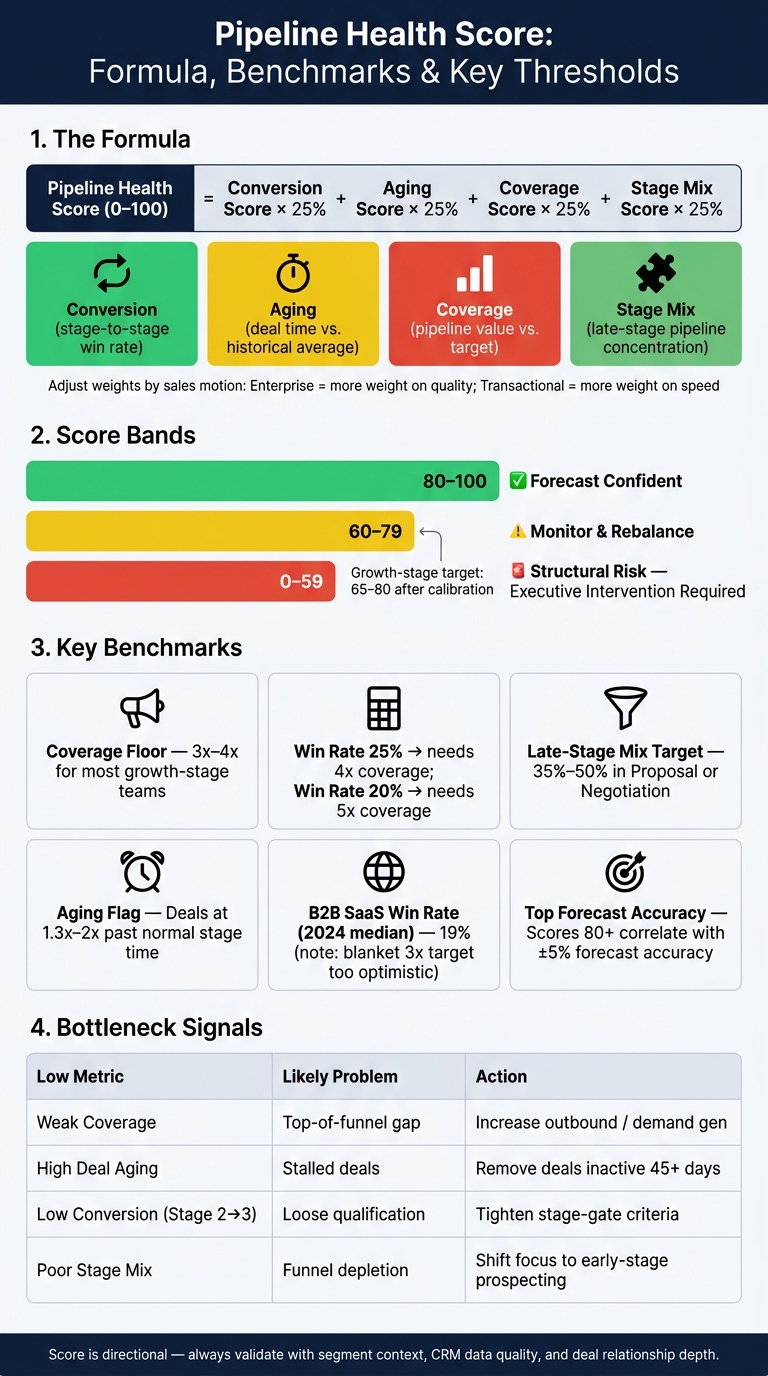
Pipeline Health Score: Formula, Benchmarks & Score Bands Explained
| Area | What I’d look for |
|---|---|
| Core inputs | Conversion, aging, coverage, stage mix |
| Scoring scale | 0–100 |
| Healthy composite range | 65–80 after calibration |
| Green / Yellow / Red | 80–100 / 60–79 / 0–59 |
| Coverage floor | 3x–4x for many growth-stage teams |
| When higher coverage is needed | Lower win rates or longer sales cycles |
| Late-stage mix target | 35%–50% in Proposal or Negotiation |
| Aging flag | 1.3x to 2x past normal stage time |
| Main limit | The score is directional; context still matters |
That’s the core idea: I’d use the score to spot where forecast risk is building, then check the segment, deal context, and CRM quality before making a call.
This score is meant to show forecast risk. It is not just another dashboard number.
Pipeline Health Score = (Conversion Score × weight) + (Aging Score × weight) + (Coverage Score × weight) + (Stage Mix Score × weight) [2][1]
First, turn each metric into a 0–100 score. Then apply the weight for that metric and add the results together. [2][1]
A good starting point is to give each input a 25% weight. After that, shift the weights based on your sales motion. Enterprise teams usually need to put more weight on deal quality. Transactional teams usually need to put more weight on speed. [2][1]
Each input points to a different type of forecast risk.
Conversion looks at stage-to-stage movement and overall win rate. The goal is to protect forecast accuracy. In B2B SaaS, a healthy opportunity-to-close rate usually lands between 20% and 30%. [4] If qualified-to-demo conversion drops below 30%, progression is weak. [3]
Aging looks at how long deals stay in a stage compared with your past average. This helps spot slippage before it turns into a bigger problem. A common rule is to flag deals that sit 1.5x to 2x longer than normal. [3][6]
Coverage has two versions: gross and weighted. Gross coverage uses total pipeline value as-is. Weighted coverage applies stage-based probabilities, which gives you a more realistic picture of what may close. To find your coverage requirement, divide 100 by your win rate. So if your win rate is 25%, you need 4x coverage to hit target. Then compare that number with your growth-stage coverage benchmark. [3][4]
Stage mix checks whether enough pipeline value sits in later stages. That matters because late-stage deals give the forecast more support. Aim to keep 35% to 50% of pipeline value in Proposal or Negotiation. [1]
Most teams can use one of two simple models.
The point-score model gives each metric a 1–5 rating based on set thresholds, then averages the ratings. The weighted-score model converts each metric to 0–100, applies set weights, and rolls everything into one score. [7][6][2][1]
| Feature | Point Score Model | Weighted-Score Model |
|---|---|---|
| Simplicity | High - easy to calculate manually in a spreadsheet | Moderate - requires normalization math |
| Transparency | High - easy to see which metric is dragging | Moderate - the composite score can hide detail |
| Flexibility | Low - usually uses rigid tiers and equal weighting | High - weights can change by segment or season |
| Forecasting usefulness | Directional - best for hygiene snapshots | High - more predictive for future revenue outcomes |
Use the point-score model when you want a fast read. Use the weighted-score model when your benchmarks are stable and you can compare them across segments. [7][6][2][1]
For smaller growth-stage teams, it makes sense to start with the point-score model. Once the data gets more mature, move to the weighted-score model. [7][6][2][1]
Once the formula is set, benchmarks show whether the score is healthy or quietly hiding risk.
These benchmarks are starting points, not fixed goals. Your numbers will move based on ACV, sales cycle length, and the kind of motion you run. A high-velocity SMB team won’t look the same as a team selling into large enterprise accounts. Start with these ranges, then check them against your own past performance.
For most growth-stage companies, a 3x–4x pipeline coverage ratio is a solid floor. If your sales cycle is longer or your win rates are lower, teams often need 4x–5x to go into a quarter with confidence. [3]
Here’s the part many teams miss: 3x only works if your win rate is 33%. That means you shouldn’t use a generic target just because it sounds standard. Use your actual win rate from the last four quarters. A 25% win rate calls for 4x coverage. A 20% win rate calls for 5x. Median B2B win rates fell to 19% in 2024, so a blanket 3x target can be far too optimistic for a lot of teams. [3]
For the composite score, growth-stage companies should aim for a score in the 65–80 range once the scoring model is calibrated. [2] Here’s how those score bands line up with forecast confidence:
| Score Band | Status | What It Means |
|---|---|---|
| 80–100 | Green | Forecast confident |
| 60–79 | Yellow | Monitor and rebalance; marketing or SDR intervention may be needed [1] |
| 0–59 | Red | Structural risk; executive intervention required [1] |
If late-stage concentration drops below 20%, that usually points to current-period risk. And if the pipeline is too bottom-heavy, that can point to a future revenue miss even when total pipeline volume looks fine on paper. [1]
You should also flag deals that run past 130% of the historical stage average. The key here is simple: use your own sales-cycle data, not industry averages. What looks old for one company may be normal for another. [1][3]
These ranges help you judge whether the pipeline looks healthy. The next step is looking at what the score still doesn’t catch.
A low score only matters if it helps you find the right bottleneck. The score tells you where to look. From there, you trace the issue back to the funnel stage causing it.
A score below 60 points to structural risk, even when pipeline value still looks strong. [1]
Each weak input usually signals a different kind of problem. Here’s where to look first:
| Low Metric Reading | Likely Bottleneck | Operating Response |
|---|---|---|
| Weak coverage ratio | Top-of-funnel shortfall; marketing gap | Increase outbound activity; launch targeted demand generation [2][3] |
| High deal aging | Stalled deals; inflated pipeline | Remove deals with no activity for 45+ days; executive deal review [3][8] |
| Low conversion (Stage 2→3) | Loose qualification criteria; messaging friction | Tighten stage-gate requirements; audit discovery exit criteria [2][3] |
| Poor stage mix | Funnel depletion; future quarter revenue gap | Shift focus to early-stage prospecting and lead qualification [7] |
So the pattern is pretty simple: each weak reading ties back to one of four inputs - conversion, aging, coverage, or stage mix.
Start with stage conversion. It often shows friction earlier than win rate does. [3]
The score is directional. Context tells you whether the signal is real.
A common blind spot is segment masking. One benchmark won’t explain every segment. If you apply the same threshold to SMB and enterprise, the readout can send you in the wrong direction. [7][5]
Strategic shifts create another gap. Say your team is moving upmarket on purpose to lift ACV. Deal cycles will get longer, and conversion rates may drop during that move. The score may look worse even if the business choice makes sense. A scorecard built on static benchmarks can’t tell the difference between a problem and a planned shift. [2]
Stale CRM data is another trap. It can inflate coverage and hide risk. [8]
Scorecards also miss relationship depth. Deals with three or more engaged stakeholders close at nearly double the rate of single-threaded ones. That means a late-stage deal can still carry high forecast risk if only a mid-level contact is engaged. [3]
That’s why the score should guide action, not replace judgment.
That limit is why the score should guide action, not replace judgment. A pipeline health score only matters if it changes what your team does next, not just what shows up in a report. Its job is to pull conversion, aging, coverage, and stage mix into one clear action signal.
Scores of 80+ are where forecast confidence is strongest, with top teams forecasting within about ±5% [1]. That sounds strong, but the point isn't certainty. The point is direction. Use the score to spot bottlenecks, not to treat it like a revenue promise [2][3]. Put simply, volume matters less than structure.
Segment differences, strategic pivots, and CRM hygiene can all distort the readout [3]. That's why trends and segment-level views matter so much. A low score only means something when it points to the stage or behavior that's blocking revenue.
This is where pipeline health becomes most useful. It gives FP&A, forecasting, and board reporting a shared signal they can act on. Used this way, the score becomes a weekly prioritization tool for pipeline, forecast, and resource allocation.
Pipeline health is a decision signal, not a forecast guarantee.
Set weights to match your business model and current growth priorities. The right mix depends on what drives your sales motion. For example, velocity tends to matter more in short-cycle transactional sales, while quality usually carries more weight in enterprise deals.
A balanced model often spreads weight across coverage, velocity, conversion, and quality. Keep coverage capped at 25% to 30% so a bottom-heavy pipeline doesn’t artificially boost the score. Then review those weights quarterly and compare them against forecast accuracy.
Yes. Score each sales segment on its own because win rates, sales cycles, and other pipeline traits can change a lot by deal size, geography, product line, and market maturity.
When you use segment-level weights and thresholds, you get a sharper view than you would from one blended score. It also keeps benchmarks tied to the right context and makes structural risks easier to see.
Recalculate and review pipeline health scores at least weekly. For most growth-stage organizations, monthly reporting moves too slowly to guide action.
If your pipeline moves fast, daily or real-time updates can help flag problems before they hit the quarter. Match the review cadence to your internal revenue review cycle so teams look at health metrics alongside forecast accuracy and pipeline coverage.