Published on
April 18, 2026

Real-time ERP reporting is a game-changer for businesses looking to manage financial risks effectively. By providing instant updates on financial and operational data, it bridges the gap caused by outdated, batch-processing systems. This approach helps businesses identify risks earlier, improve cash flow management, and streamline decision-making.
Key takeaways:
The faster you can act on accurate data, the better you can protect your business from financial and operational risks.
Real-Time ERP Reporting Impact: Key Metrics and ROI Statistics
Growth-stage companies often find themselves grappling with outdated financial data. Traditional ERP systems typically process information in batches, meaning decisions are often based on stale data. For instance, if an inventory report only shows last week's stock levels, disruptions in the supply chain might go unnoticed until they directly impact production. These outdated processes not only delay financial insights but also slow down the ability to catch anomalies quickly.
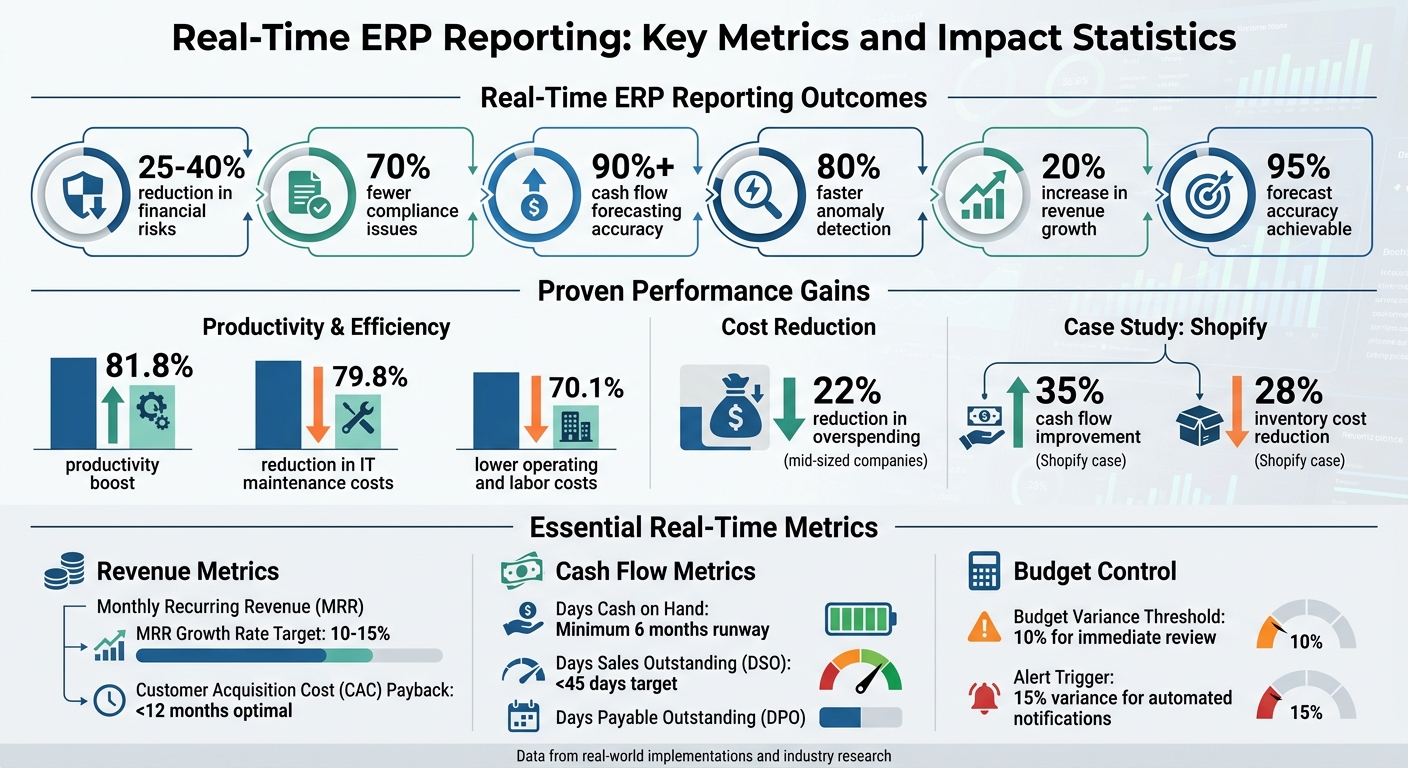
Month-end reporting is a major culprit when it comes to lagging financial data. By the time transactions from operational settings make their way into financial systems, cash flow projections and inventory counts may already be inaccurate. This delay makes it harder for leaders to spot risks like cash flow shortages in time. Consider this: 70.1% of organizations report lowering operating and labor costs by improving ERP metric tracking [4].
Manual data entry only adds to the problem, increasing the likelihood of human error and requiring extra time for reviews and reconciliation. On top of that, fragmented spreadsheets create a scattered data landscape, forcing teams to spend more time reconciling numbers instead of analyzing them. These delays make it harder to spot early warning signs, weakening the effectiveness of risk control measures.
The challenges don’t stop with delayed insights. Outdated systems also struggle to detect anomalies swiftly and accurately. Legacy systems often lack the ability to dive into detailed data, which is critical for understanding unexpected variances. When anomalies appear in financial reports, managers need to investigate specific transactions, cost breakdowns, or vendor behaviors. However, older systems might not provide the level of detail required, leaving teams to manually piece together information from disconnected sources - often too late to prevent damage.
Operational bottlenecks further complicate anomaly detection. Outdated workflows and unnecessary approval steps can slow down the process, delaying the identification of issues. Without automated tools like three-way matching for purchase orders, receipts, and invoices, fraudulent transactions can go unnoticed. Additionally, data silos restrict visibility across departments, leaving finance teams without the full context that operations and compliance teams might have. This lack of swift detection leads to a reactive approach to risk management, where problems are addressed only after they’ve caused harm.
Keeping an eye on key metrics is crucial. For growth-stage companies, focusing on financial and operational indicators can directly impact how quickly risks are identified and decisions are made.
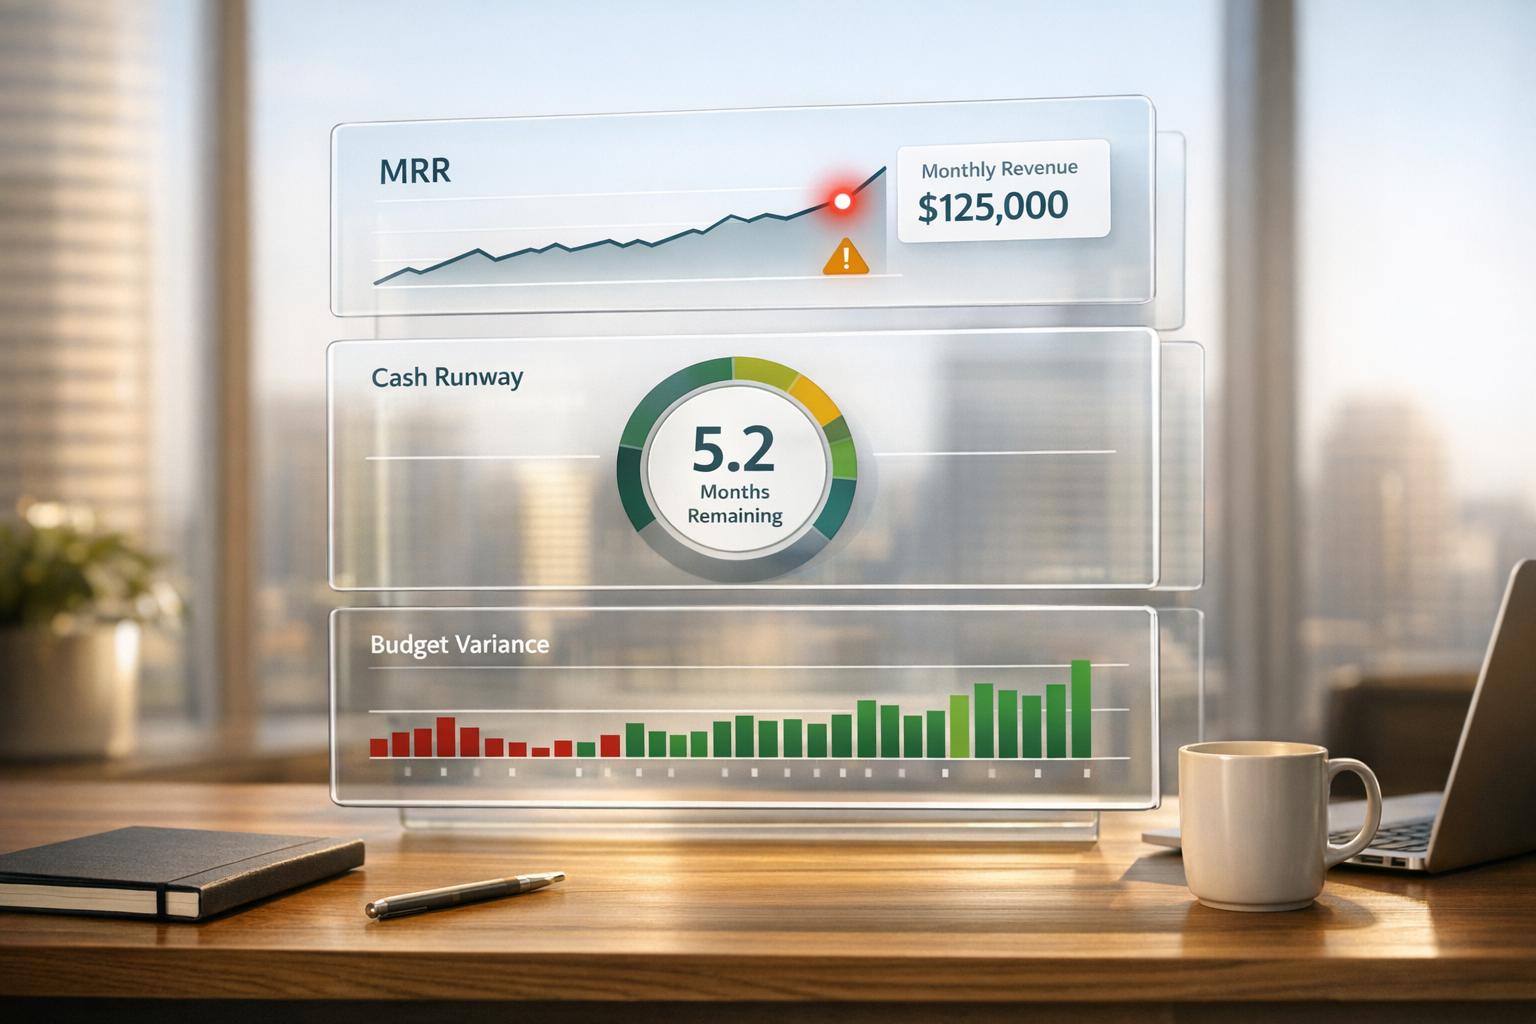
Start with the basics: monthly recurring revenue (MRR) and annual recurring revenue (ARR). These should be front and center on your dashboard. To calculate MRR growth rate, use this formula:
(Current MRR - Previous MRR) / Previous MRR × 100.
Another critical metric is the customer acquisition cost (CAC) payback period, which you can find by dividing CAC by the average monthly revenue per customer. For most growth-stage companies, an MRR growth rate below 10-15% month-over-month could signal customer churn risks. Similarly, if your CAC payback period exceeds 12 months, it’s a sign of inefficient scaling and high cash burn.
Sales metrics like pipeline velocity, win rates, and deal size trends are equally important. For example, in Q1 2023, Nutanix, a client of Anaplan, used real-time ERP dashboards to track MRR and cash burn rate. This approach reduced forecasting errors from 18% to just 4% within six months. CFO Mike Scarpelli led the initiative, integrating Salesforce data to monitor sales velocity. The result? Nutanix preserved $15 million in cash and accelerated revenue by 12%. This demonstrates how real-time revenue tracking can help detect and address shifts in growth trends early.
While revenue metrics are vital, they work hand-in-hand with cash flow management to ensure financial stability.
Cash flow is a lifeline for growth-stage companies. One key metric to track is days cash on hand, calculated by dividing current cash by the average daily cash burn. Aim for at least six months of runway - anything less could leave you in a precarious position. If your monthly burn exceeds $500,000, set up alerts to flag potential issues.
Another important pair of metrics are days sales outstanding (DSO) and days payable outstanding (DPO), which reveal how efficiently cash moves through your business. A DSO above 45 days essentially means you're financing your customers' operations with your own working capital - a risky position to be in.
In the second half of 2024, Zoom Video Communications implemented Workday to monitor ARR growth and cash flow forecasts in real time. Under CFO Kelly Steckelberg’s leadership, this system increased forecast accuracy to 95% and reduced risk exposure by $20 million. By incorporating AI thresholds for drops in win rates, Zoom achieved a 22% improvement in operational efficiency. This example highlights how automated cash flow tracking can prevent liquidity issues before they escalate.
Cash flow is vital, but keeping your spending in check is just as critical.
Budget variance analysis is another key tool for managing risk. Use the variance percentage formula to track spending:
(Actual spend - Budgeted spend) / Budgeted spend × 100.
Set a threshold of 10% for overruns to trigger immediate reviews. Breaking variances down by categories like marketing, R&D, operations, and personnel allows for mid-quarter adjustments instead of waiting until the end of the month to uncover issues.
Take Shopify, for example. In 2022, the company used NetSuite to track real-time budget variances and DSO metrics. This approach helped them cut inventory costs by 28%, saving $45 million in just nine months. FP&A Director Amy Shapero oversaw the project, which included automated alerts for variances exceeding 15%. This effort improved Shopify’s cash flow by 35%.
On average, real-time budget variance tracking can reduce overspending by 22% for mid-sized companies. Without such tools, 60% of scaling firms experience budget variances of 20-30%, often jeopardizing their chances of securing funding. Detecting and addressing variances early can make all the difference in staying on track financially.
Real-time ERP reporting shifts organizations from reacting to problems after they occur to addressing potential issues before they escalate. By moving from batch reporting to live, continuous operations, companies can better manage risk and maintain compliance [1][3].
This transformation is driven by automated monitoring, which replaces manual oversight with system-driven, ongoing controls.
ERP systems can be configured to send instant alerts when anomalies occur. For example, the three-way match feature automatically cross-checks purchase orders, goods receipts, and invoices. This ensures controls are consistently applied while reducing the risk of fraud [3]. Any discrepancies are flagged immediately for review.
"An ERP system strengthens compliance and regulatory frameworks by enforcing role-based access, maintaining automated audit trails, and integrating real-time monitoring, ensuring that sensitive tasks are performed only by authorized users and that all actions are traceable." - Plante Moran [3]
Segregation of Duties (SoD) analysis tools add another layer of protection. These tools monitor for conflicts of interest, such as ensuring one individual doesn’t control all steps of a transaction. For instance, the same person shouldn’t approve a vendor and process their payment. If a conflict arises, the system sends an alert to management. This rule-based workflow eliminates the need for constant manual checks while ensuring compliance [3].
These automated alerts serve as the foundation for a robust compliance dashboard.
Building on automated controls, compliance dashboards provide a consolidated view of metrics, enabling instant detection of gaps. Instead of relying on quarterly audits, management can monitor key indicators daily and track real-time remediation efforts [3]. This is especially critical in heavily regulated industries, where tracking lot numbers or sourcing details is crucial for audits or recalls [2].
As Axiever explains, "If an ERP system shows yesterday's data, it is already outdated. Real time ERP is becoming essential for competitive advantage" [1]. Many cloud-based ERP providers now offer 24/7 proactive monitoring, with dedicated security teams addressing threats as they arise [5]. Companies using these systems report a 70.1% improvement in operating and labor costs, thanks to enhanced compliance tracking [4].
Automated audit trails further simplify responses to regulatory changes or inquiries. By automating recurring compliance checks, businesses avoid last-minute scrambles when new requirements emerge [3]. This continuous monitoring not only reduces regulatory risks but also ensures companies remain audit-ready at all times.
Creating an effective real-time ERP dashboard requires careful planning of data structures and alert mechanisms. The growing importance of real-time visibility in financial operations is reflected in the projected expansion of the risk analytics market, which is expected to grow from $32.25 billion in 2025 to $51.34 billion by 2030, with a compound annual growth rate of 9.7% [10]. By integrating automated compliance alerts with actionable insights, businesses can significantly improve their risk control strategies.
To start, it's crucial to define the dashboard's purpose and customize data views based on user roles. Fractional CFOs, executives, and risk managers often have different priorities, so understanding their needs early ensures dashboards remain focused and avoid cluttered or irrelevant data.
A real-time dashboard can only function effectively when all data originates from a single, unified source. Relying on fragmented spreadsheets or disconnected systems introduces delays and errors, undermining the accuracy of live monitoring. Centralizing financial data involves integrating ERP modules with CRM systems, external threat feeds, and other operational tools into one cohesive database.
For example, when a transaction occurs - like shipping goods to a customer - a well-integrated ERP system can simultaneously update inventory, generate an invoice, and send notifications [9]. This level of automation eliminates manual data entry and ensures that all departments operate with the same up-to-date information.
Cloud-native ERP systems further enhance this integration by offering global scalability and seamless API connections to external data sources [10]. However, before implementing such systems, it's essential to establish strict data governance and validation protocols to maintain accuracy and consistency.
Once data is centralized, the next step is configuring precise, rule-based alerts. The key is to strike a balance: alerts should identify issues early without overwhelming users with unnecessary notifications. Setting thresholds too low can lead to "alert fatigue", while thresholds set too high may allow critical risks to go unnoticed.
Start by reviewing existing internal controls - such as approval workflows, access restrictions, and audit trails - to pinpoint areas that require automated monitoring. For instance, budget variance alerts can be configured to flag deviations that exceed a specific dollar amount or percentage. Similarly, a three-way match can be set up to highlight discrepancies between purchase orders, goods receipts, and invoices.
Regularly revisiting and adjusting these thresholds is essential to keep pace with changing risks and organizational goals. Companies that implement structured ERP tracking often report a 79.8% improvement in IT maintenance costs [4].
To prevent information overload, role-based access ensures that users only receive alerts relevant to their responsibilities. It's also a good idea to pilot the dashboard with a small group to fine-tune its accuracy and usability before rolling it out across the organization.
These configurations are critical for enabling proactive risk management and ensuring compliance in real-time financial operations.
Rolling out real-time ERP reporting is just the start. To ensure it's delivering value, you need to track key success metrics. These indicators help confirm whether risks have been minimized, financial accuracy has improved, and the investment was worth it. Organizations that measure these metrics have reported impressive outcomes: productivity boosts of 81.8%, IT maintenance cost drops of 79.8%, and reductions in operating and labor costs of 70.1% [4].
It's equally important to monitor both the implementation process and the system's operational impact. As KPC_Admin from KPC Team puts it, "The greatest ERP implementation will falter if it exceeds budget or timeline, jeopardizing an organization's livelihood" [4]. These insights align with earlier discussions about how real-time ERP reporting supports proactive risk management.
Keeping an eye on your timeline is critical. Compare planned dates with actual completion dates for key milestones. For instance, if user training scheduled for March 15, 2026, is delayed until April 2, 2026, that's an 18-day gap that could point to resource allocation issues. Beyond timelines, track user adoption rates, the integration process with CRM, supply chain, and HR systems, and system uptime to ensure the rollout stays on track.
Once the ERP system is live, the focus shifts to how well it manages risks and streamlines operations. Start by reviewing data accuracy metrics - like entry errors, duplication, and consistency - to confirm the system is providing a reliable single source of truth. Compliance metrics are also key; monitor automated audit counts and resolve segregation of duties (SoD) conflicts to reduce fraud risks. Financial risk can be assessed by tracking reconciliation times and the frequency of budget overruns. Operational improvements, such as fewer manual entries, quicker procurement cycles, and better inventory accuracy, are also worth measuring.
| Metric Category | Specific KPI to Track | Risk Mitigation Impact |
|---|---|---|
| Financial | Reconciliation lag time | Reduces the risk of compliance violations and inaccurate cash forecasting |
| Security | SoD conflict frequency | Prevents internal fraud by ensuring responsibilities are appropriately divided |
| Operational | Manual error rate | Lowers labor costs and avoids operational bottlenecks |
| Compliance | Audit trail gaps | Deters fraud and minimizes exposure during regulatory audits |
| System | Uptime and performance | Ensures continuous access for real-time decision-making |
Real-time ERP reporting is changing the way businesses manage financial risk. Instead of waiting for delayed insights, companies can now identify potential issues in minutes and take immediate action. This shift allows problems to be addressed before they grow into larger challenges.
The numbers speak volumes. Businesses using real-time dashboards report 25–40% reductions in financial risks, 70% fewer compliance issues, and cash flow forecasting accuracy exceeding 90%. Additionally, anomaly detection becomes 80% faster[6][7][8]. These improvements not only stabilize operations but also contribute to growth, with some companies experiencing a 20% increase in revenue growth by proactively managing risks.
To get started, consider conducting a dashboard audit to focus on key metrics like revenue growth, cash flow, or budget variance. Set alert thresholds - such as a 5% deviation in budgets - and run a pilot program in one department for 30 days. Monitor the results, including faster reporting, fewer manual errors, and more accurate forecasts.
For U.S. growth-stage companies, real-time ERP reporting is a game-changer. It’s vital for scaling operations, attracting investors, and preparing for future milestones like funding rounds or exits. When you can demonstrate 95% forecast accuracy or catch a $500,000 budget overrun before it spirals, you're not just managing risk - you’re also building trust and ensuring long-term success.
The benefits are clear. Start implementing real-time dashboards now to protect cash flow, improve forecasting, and set the foundation for steady, scalable growth.
ERP reporting achieves real-time functionality when it seamlessly pulls data from various sources, updates instantly via live dashboards, and provides precise, current insights. This enables businesses to act quickly and make well-informed decisions based on the most recent information available.
Real-time financial dashboards are invaluable tools for keeping an eye on crucial metrics like cash flow, liquidity ratios, and profitability indicators. These dashboards provide up-to-the-minute data, offering a clear picture of your financial health at any given moment.
Why does this matter? Because having instant access to these metrics can help you spot potential risks early and make smarter decisions. For example, tracking cash flow in real time ensures you’re never caught off guard by unexpected shortfalls. Similarly, monitoring liquidity ratios helps you assess your ability to meet short-term obligations, while profitability indicators reveal how well your business is performing overall.
By using these dashboards, you’re not just reacting to financial changes - you’re staying ahead of them. That means more control, less uncertainty, and better outcomes for your business.
To prevent alert fatigue, it's important to establish clear and meaningful thresholds for 5 to 7 key performance indicators (KPIs). For each metric, define specific objectives - such as improving Days Sales Outstanding (DSO) or shortening the cash runway - and set thresholds that highlight only significant deviations. Avoid setting overly sensitive limits that could flood you with unnecessary alerts. Make it a habit to regularly review and adjust these thresholds to reflect evolving business priorities. This way, your alerts stay relevant and actionable.