Published on
May 23, 2026


Retention revenue often surpasses new customer revenue because it costs less, grows over time, and delivers higher profit margins. Here's why it matters:
Key metrics like Net Revenue Retention (NRR) and Gross Revenue Retention (GRR) reveal how well businesses retain and grow revenue from their current customers. Balancing retention and new customer acquisition is critical to avoid overdependence on either strategy. Companies that excel in retention strategies often secure higher valuations and long-term growth.
Retention Revenue vs. New Customer Revenue: Key Stats & Metrics
Retention revenue is crucial for any business, but measuring it correctly is what makes the difference. If you're not tracking the right metrics, you might think your growth is solid when, in reality, there are underlying issues.
When it comes to retention revenue, three metrics stand out: Net Revenue Retention (NRR), Gross Revenue Retention (GRR), and Logo Retention Rate. Each offers a unique perspective on your customer base and revenue health.
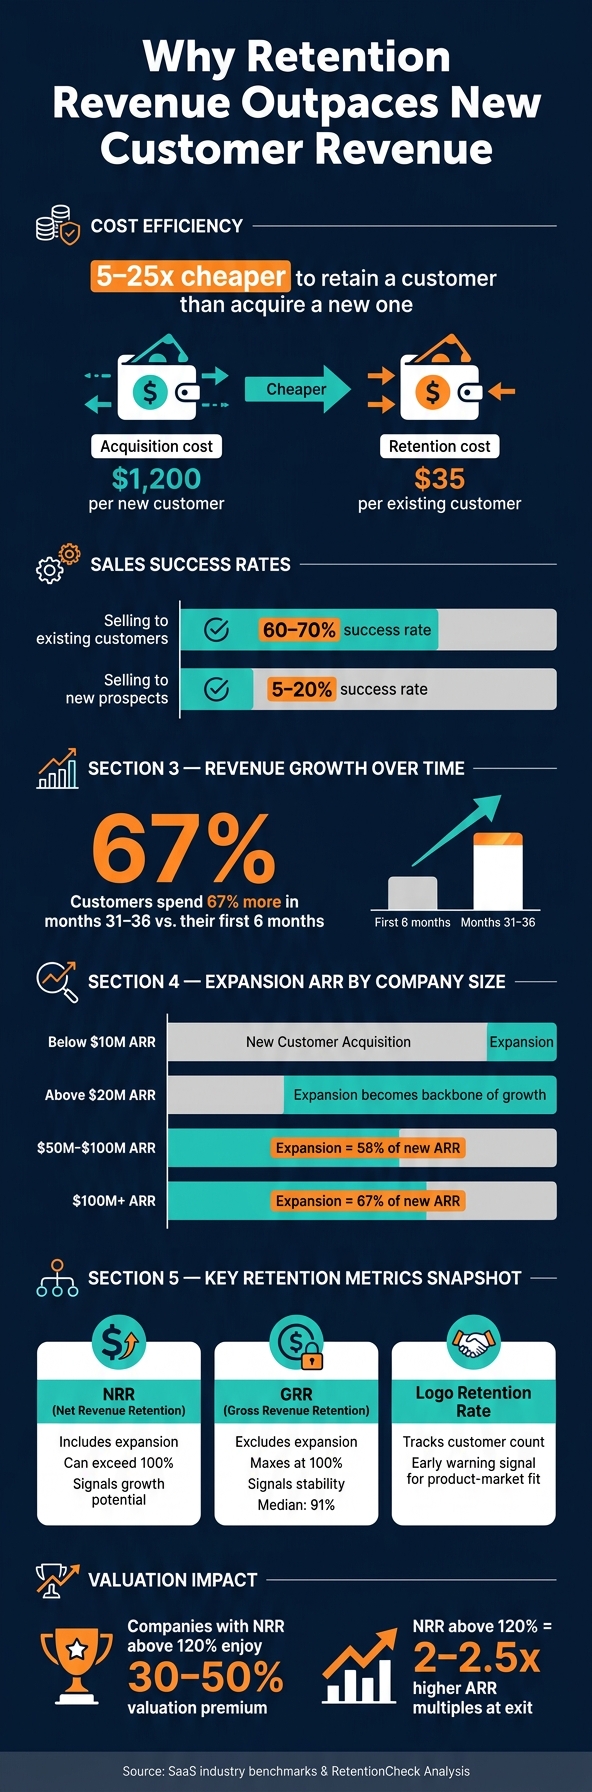
Net Revenue Retention (NRR) is the star of the show. It measures how much revenue your existing customers generate over time, factoring in upsells, upgrades, and expansions, as well as churn and downgrades. An NRR above 100% signals growth from your current customers, even without acquiring new ones. Here's the formula:
(Starting ARR + Expansion − Contraction − Churn) ÷ Starting ARR
For example, if you start with $100,000 in ARR, gain $2,000 from expansions, and lose $3,000 due to churn, your NRR would be 99%. As Gaj Tanwar of SaaS Mag explains: "A company with 120% NRR and zero new sales would still grow 20% annually." [7]
Gross Revenue Retention (GRR), on the other hand, focuses solely on what you retain. It excludes expansion revenue and highlights how much of your starting revenue survives churn and downgrades. GRR maxes out at 100%, making it a straightforward measure of customer satisfaction. If GRR dips, it’s a red flag for your product’s core appeal, regardless of how well your upselling strategies are performing. The median GRR for private SaaS companies is about 91% [8].
Logo Retention Rate measures the percentage of customers who stick around. This metric is often the first to signal trouble with product-market fit before revenue metrics take a hit [5][9].
Here’s a quick comparison of these metrics:
| Metric | Includes Expansion? | Can Exceed 100%? | Primary Signal |
|---|---|---|---|
| NRR | Yes | Yes | Growth potential within existing customers |
| GRR | No | No | Stability and retention health |
| Logo Retention | N/A | N/A | Customer stickiness and product fit |
Tracking both NRR and GRR is essential. A high NRR can sometimes mask issues if aggressive expansions are offsetting high churn rates. GRR keeps you grounded [6][8].
Real-world examples highlight the importance of these metrics. Monday.com reported an NRR of 140–145% in 2026, driven by a model that grows accounts as teams expand. Similarly, Snowflake achieved a 125% NRR in Q4 of fiscal 2026, thanks to a pricing model tied to customer data usage [6][7]. Companies with NRR above 120% often secure 2 to 2.5x higher ARR multiples at exit compared to those below 100% [6].
"NRR above 115% is the single strongest predictor of a Series B-to-C valuation uplift in 2026 B2B SaaS." - Peter Vogel, Founder, peppereffect [6]
These metrics are more than just numbers - they directly shape financial strategies and forecasts.
Retention revenue doesn’t just stay in the metrics - it plays a big role in financial reporting.
One of the most effective ways to visualize this is through a revenue bridge. This report breaks down your ARR into its components: starting ARR, new business, expansion, contraction, and churn. It reveals exactly where growth is happening and where you're losing revenue. A healthy revenue bridge shows expansion outpacing churn, while a troubled one highlights leaks, even if total ARR looks stable [6][9]. Separating expansion and contraction in this report is essential to uncover the real story behind your numbers [9].
Retention metrics also tie directly into unit economics, especially Customer Lifetime Value (LTV) and the LTV/CAC ratio. Both NRR and GRR influence how long customers stay and how much they spend, which are critical inputs for calculating LTV. If your LTV/CAC ratio starts to slip, retention is often the first area to investigate. Financial planning teams, like those at Phoenix Strategy Group, often embed cohort-level retention data into models to give leadership a clearer view of efficiency before it becomes a major issue.
Finally, retention data enhances ARR forecasting accuracy. Instead of applying a flat churn rate across your entire customer base, a better approach is to use historical GRR and expansion rates for specific customer cohorts. This method creates a more realistic revenue "decay curve" and avoids overestimating long-term revenue in projections [9][10].
By 2026, the average B2B SaaS company spends around $1,200 to acquire a new customer, compared to just $35 to retain an existing one [12]. These cost savings directly contribute to higher profitability, making retention a powerful driver of revenue growth.
Customer behavior plays a significant role in this dynamic. Between months 31 and 36 of a relationship, customers typically spend 67% more per order than they did during their first six months. Additionally, they convert on new products at rates of 60–70%, a stark contrast to the 5–20% conversion rates seen with new prospects [2][12]. These patterns explain why mature customer relationships often lead to compounding revenue growth.
Pricing strategies also amplify retention benefits. Companies that adopt hybrid or usage-based billing models - where revenue grows in tandem with customer consumption - achieve 38% higher Net Revenue Retention (NRR) compared to those relying solely on seat-based pricing [1]. For example, Snowflake's impressive 125% NRR in Q4 of fiscal 2026 demonstrates how increased customer data usage drives revenue growth without requiring additional sales efforts [7].
The way a company compensates its teams can heavily influence its growth strategy. When Customer Success Managers (CSMs) are rewarded solely for renewal rates, their focus often remains on preventing churn. However, when their variable pay is linked to expansion ARR, CSMs shift to a more proactive approach, identifying upsell opportunities as soon as customers exhibit signs of growth [1][13].
Equally important is how companies measure performance. When teams track both NRR (Net Revenue Retention) and GRR (Gross Revenue Retention) side by side, they gain a clearer picture of whether expansion revenue is masking underlying churn issues. Without this discipline, a high NRR can give the illusion of success while the core customer base deteriorates. As Peter Vogel of peppereffect aptly noted:
"The CEO's job is not to hire more sales reps. It is to install the operating system that compounds expansion revenue faster than new logos." [1]
These internal strategies are influenced further by external market forces and the company’s stage of growth.
While internal incentives drive upsell strategies, external factors like market conditions and business maturity shape overall revenue priorities. Over the past five to eight years, customer acquisition costs have skyrocketed by 222% [2][12], with win rates for new prospects hovering between 2–5% [14]. In contrast, expansion efforts within existing accounts boast win rates of 20–40%, with much shorter sales cycles - measured in weeks rather than months [14].
This shift in efficiency leads to what’s often called the "mid-market inversion." When a company is below $10M ARR, growth relies heavily on acquiring new customers. But as businesses surpass $20M ARR, expansion becomes the backbone of their growth strategy [1]. For companies generating $50M–$100M in revenue, expansion ARR already accounts for 58% of total new ARR, climbing to 67% for those surpassing $100M [1]. At this stage, market saturation pushes businesses to prioritize retention over acquisition.
Recognizing this lifecycle shift is critical. Phoenix Strategy Group, for instance, integrates cohort-level retention data into financial models for growth-stage companies. This approach helps businesses understand their position on the growth curve, ensuring they allocate capital wisely and strike the right balance between retaining existing customers and acquiring new ones before external pressures dictate the strategy.
Putting too much emphasis on retention revenue can create instability for a business.
The most concerning issue is something called the "NRR Trap." On the surface, two companies might both report a Net Revenue Retention (NRR) of 110% and seem equally strong. But a closer look reveals a different story. The key distinction lies in Gross Revenue Retention (GRR). For example, a company with 110% NRR but just 78% GRR is facing high customer churn and depends heavily on upselling to a small group of large accounts. Here's a comparison that highlights the risks:
| Metric | Healthy Growth | The NRR Trap |
|---|---|---|
| NRR | 110% | 110% |
| Gross Revenue Retention (GRR) | 92% | 78% |
| Annual Customer Churn | 8% | 22% |
| Expansion Concentration | 24% from top 10 accounts | 68% from top 10 accounts |
| Outcome | Sustainable, diversified growth | Fragile; collapses if one large account leaves |
Source: RetentionCheck Analysis of $5M ARR companies [15]
The problem gets worse when a company relies too much on a handful of big clients for growth. If one of these major accounts leaves, NRR can plummet from 110% to 82% [15]. Companies in the $5M–$15M Annual Recurring Revenue (ARR) range are especially at risk because they often rely on high-level dashboards that don’t break down data enough to expose these vulnerabilities [15].
These financial risks are just part of the story. Operational and cultural challenges add further complications, as explained below.
The dangers of over-relying on retention revenue extend beyond finances - they affect how a company operates and its internal culture.
When too much focus is placed on retention, the urgency to bring in quality new customers fades. This can lead to what’s often called a "leaky acquisition treadmill", where bringing in customers who don’t align with the Ideal Customer Profile (ICP) results in higher churn rates [11].
Product development can also take a hit. If the roadmap is shaped entirely by the demands of current customers, it risks becoming a mere wishlist for existing users. This approach limits the product’s ability to attract new markets and keeps the company stuck serving the same stagnant user base [3].
"Net revenue retention... hides what's really going on in the business." [16]
Another hidden danger is silent contraction - where revenue quietly shrinks because customers underuse certain features or pricing models are too weak. Teams that focus only on top-line retention metrics might miss these red flags [17]. Tackling these issues is essential to create a balanced approach to revenue growth, which will be discussed in the next section on balancing retention and acquisition metrics.
Striking the right balance between retaining existing customers and acquiring new ones demands a thoughtful approach. By focusing on specific strategies, companies can maintain both revenue streams without undermining either.
One common pitfall is lumping all revenue into a single figure. Combining new-logo ARR with NDR can inflate overall numbers by 3–7 points, hiding deeper issues beneath the surface [18]. The solution? Break down revenue into new logo ARR, expansion ARR, and churn ARR as distinct categories.
NDR should exclusively reflect activity from customers active at the start of the period. Additionally, list expansion ARR (from upsells, cross-sells, and price increases) and contraction ARR (from downgrades) as separate items. This granular view helps companies identify early signs of silent churn, rather than discovering it too late.
For example, Phoenix Strategy Group specializes in helping growth-stage companies design dashboards that clearly separate these metrics. This clarity ensures leadership can pinpoint revenue sources before making key capital decisions.
Once metrics are clear, the next step is aligning team incentives to support both retention and acquisition goals.
Compensation drives behavior more effectively than any strategy document. For example, if Account Executives (AEs) are paid their full commission at the time of closing, they may prioritize volume over long-term fit. A practical adjustment is to hold back 10% of their commission until the customer successfully renews [9]. This ties their earnings to the quality of the acquisition.
On the retention side, Customer Success Managers (CSMs) who are only rewarded for logo retention may become overly cautious, focusing on maintaining accounts rather than expanding them.
"If the CSM is paid on retention only (and not expansion), the role becomes risk-averse account stewardship." - Peter Vogel, Founder, peppereffect [1]
To create a growth-oriented mindset, link 30–50% of CSM bonuses to NRR [9]. Structuring their workload by Average Contract Value (ACV) instead of headcount can also prevent smaller accounts from consuming too much attention, ensuring high-value clients receive the focus they deserve [4].
High retention rates can sometimes mask a weak acquisition strategy. Since win rates for existing accounts often hover around 60–70%, compared to just 5–30% for new prospects [1], it’s easy to deprioritize new customer acquisition. However, neglecting this area can backfire.
Refining the Ideal Customer Profile (ICP) is a key step. Customers who fall outside the ICP tend to churn more quickly, placing unnecessary strain on the expansion engine just to maintain revenue. By segmenting target markets based on behavior and revenue potential - rather than just industry or company size - sales teams can focus on prospects with the highest conversion rates and lifetime value.
It’s also important to track Customer Acquisition Cost (CAC) separately. Expansion CAC is typically 5–10x lower than new-logo CAC [1], so misallocating budgets can become an expensive mistake.
While improving acquisition is crucial, maintaining strong retention remains equally important.
Retention doesn’t mean pouring all your resources into keeping current customers happy at the expense of growth. The goal is to make retention proactive and systematic. For instance, health-score triggers - like flagging accounts when seat utilization hits 85% or when usage spikes by 20% within 30 days - can help teams identify expansion opportunities without waiting for renewal discussions [1].
Pricing models play a surprisingly large role in retention. Hybrid structures that combine a base subscription with usage-based pricing often outperform pure seat-based models, delivering 38% higher NRR on average [1]. Multi-year contracts with built-in price escalators also help smooth out NDR fluctuations and create more predictable revenue over 18–24 months [18]. These aren’t just retention strategies - they’re foundational changes that make the entire revenue model more stable.
Retention revenue has a compounding effect over time. Customers who stick around tend to spend more, are far less expensive to retain, and are much easier to upsell compared to acquiring brand-new customers. As highlighted earlier, long-term customer relationships play a major role in driving organic growth [2].
But while organic growth is a powerful tool, it does have its limits. Relying solely on retention creates a growth ceiling. To keep growing, businesses need a steady stream of new customers. Sustainable growth happens when you balance a strong retention strategy with efforts to bring in fresh customers [14].
The companies that excel are those that develop a well-rounded revenue framework. This framework separates new customer ARR (Annual Recurring Revenue) from expansion ARR, while aligning team incentives with both goals. This ties back to the importance of clear metrics, aligned rewards, and disciplined go-to-market strategies. When done right, these elements work together to create a cycle of balanced growth.
The data backs this up:
"Expansion revenue is structurally higher-margin than new logo revenue, and it compounds on a growing base." - Udit.co [14]
It’s also worth noting that companies with Net Revenue Retention (NRR) above 120% enjoy a 30–50% valuation premium compared to those focused heavily on acquisition [1]. Achieving this level of performance requires careful planning across strategy, team organization, measurement, and incentive structures.
For companies in the growth stage (with $10M-$50M ARR), Net Revenue Retention (NRR) in the range of 110-120% is generally seen as strong, while anything above 120% is outstanding. When it comes to Gross Revenue Retention (GRR), a healthy figure typically falls between 86-88%, but the best performers achieve over 95%. These benchmarks provide a solid framework to measure your success and pinpoint areas that may need attention.
High NRR can sometimes hide churn problems, especially when growth is heavily reliant on expansion revenue from just a few big accounts. This reliance can obscure the fact that smaller accounts might be churning at a high rate, making it difficult to spot retention issues. Keeping an eye on both overall NRR and the performance of specific customer segments can help bring these hidden challenges to light.
For SaaS companies, finding the right mix between acquiring new customers and growing revenue from existing ones is key. To drive growth, businesses should focus on strategies like upselling, cross-selling, and encouraging increased usage among their current customer base - all while continuing to bring in new customers.
Why prioritize expansion revenue? It often delivers a higher ROI, comes with lower acquisition costs, and supports more long-term, sustainable growth. Keeping an eye on metrics like Net Revenue Retention (NRR) - aiming for numbers above 105% - and maintaining an LTV-to-CAC ratio of 3:1 can help ensure the company stays on a healthy growth trajectory as it scales.