Published on
June 26, 2026


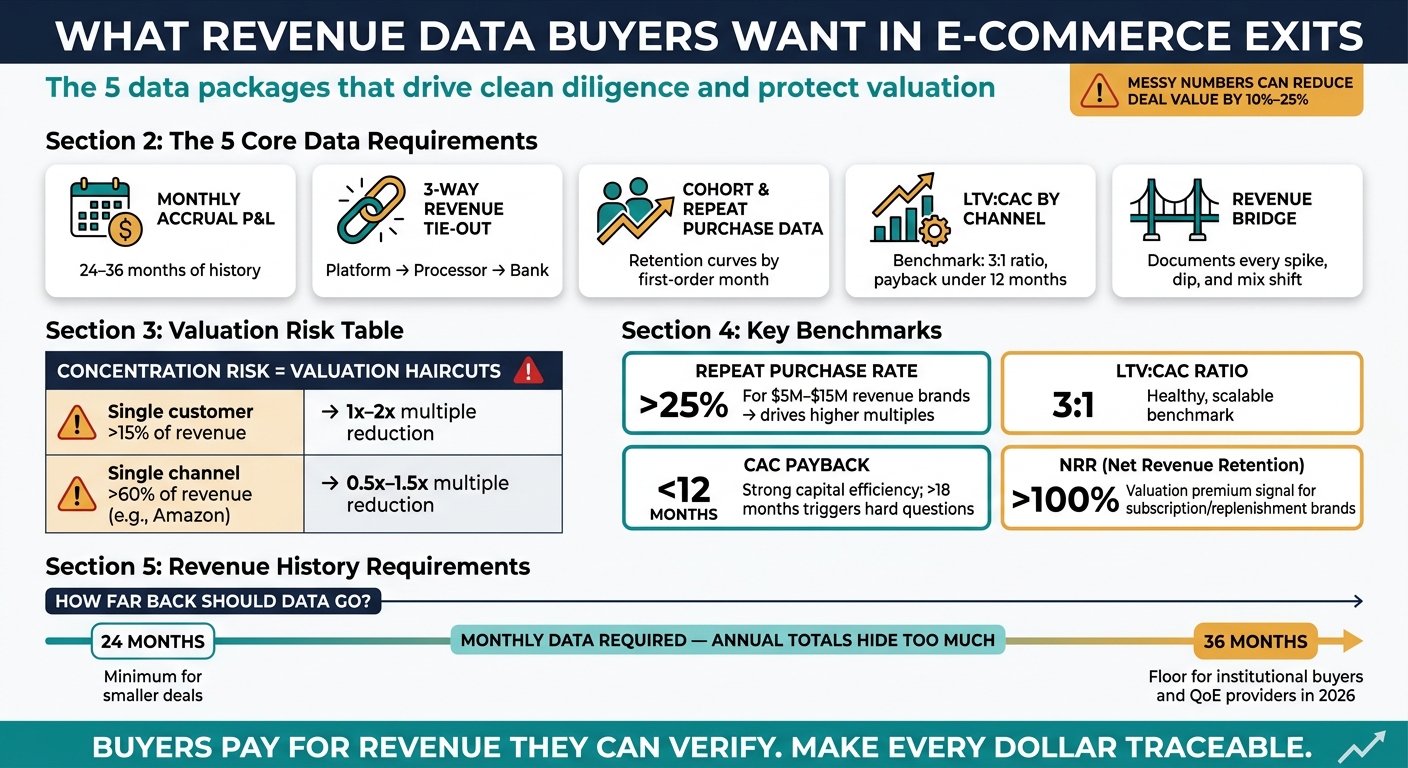
If I want a strong exit, I need to prove that revenue is clean, repeatable, and easy to trace. Buyers usually ask for 24–36 months of monthly data, a tie-out from sales platforms to bank deposits, customer retention views, and clear notes for any big swings. If my numbers are messy, deal value can drop by 10% to 25%.
Here’s the short version:
Buyers are not just checking sales. They are checking whether those sales hold up under review, whether customers come back, and whether growth came from durable demand or short-term events.
What E-Commerce Buyers Check During Revenue Diligence
| What buyers check | What they want to see | Why it matters |
|---|---|---|
| Revenue history | 24–36 months of monthly data | Shows seasonality and trend quality |
| Accounting view | Accrual reporting | Matches revenue to the right period |
| Revenue proof | Platform → processor → bank tie-out | Confirms reported sales match cash |
| Channel mix | DTC, Amazon, Walmart, wholesale, etc. | Shows concentration risk |
| Customer behavior | Cohorts, repeat rate, time to second order | Shows whether buyers come back |
| Unit economics | LTV:CAC by channel, payback period | Shows if growth is efficient |
| Revenue changes | Event log and revenue bridge | Explains unusual movement |
So when I prepare for diligence, the goal is simple: make it easy for a buyer to verify every dollar and understand every change.
When diligence starts, buyers usually ask for a small set of revenue reports right away. If those reports are ready, the process moves a lot faster.
The first ask is usually a monthly accrual P&L [1][2]. Buyers prefer accrual accounting because it matches revenue to the period when it was earned, not just when cash hit the account.
That P&L should also break revenue out by channel. For most brands, that means Shopify/DTC, Amazon, Walmart, wholesale, and any other live revenue stream. This matters because channel-level reporting makes it easier to spot when one channel is hiding another channel's weak margin.
Buyers also want gross margin, returns, refunds, discounts, and marketplace fees shown as separate line items. If those numbers are all netted together, it's much harder to see what's going on.
A monthly P&L by itself doesn't cut it. Buyers will cross-check it against source-system reports to confirm revenue. In practice, that means pulling reports from Shopify or Amazon Seller Central, matching them to Stripe or PayPal settlement statements, and then reconciling those settlements to bank deposits [5][6].
Use a three-way reconciliation:
This is a standard diligence check. It helps account for timing differences, marketplace reserves, processing fees, and chargebacks.
After channel margin, buyers usually test concentration risk. They also want a concentration schedule that shows revenue by top customers, top SKUs or categories, and geography, along with a split between recurring revenue and one-off spikes.
This can hit valuation hard. If a single customer makes up more than 15% of revenue, that can trigger a 1x–2x multiple reduction. And if more than 60% of revenue comes from one channel like Amazon, buyers often apply a 0.5x–1.5x multiple reduction [2][1].
Once these core reports are in place, buyers usually move to the next issue: how far back the data goes and whether the history is clean.
Buyers want 24–36 months of monthly revenue history, not annual totals.
That distinction matters. Annual numbers can hide too much. Buyers use monthly data to check seasonality and see whether growth holds up over time. For smaller deals, 24 months is often the starting point. For institutional buyers and Quality of Earnings (QoE) providers in 2026, 36 months is more and more seen as the floor [1][11][2][3].
The clearest way to show seasonality is with year-over-year monthly comparisons. That lets buyers see whether peaks like Black Friday/Cyber Monday are getting bigger or just showing the same annual bump.
It also helps to pair that view with trailing 12-month (TTM) revenue. That gives buyers a clean read on the current run-rate, without letting older periods skew the picture.
If a spike or dip came from something specific, say so right in the data. A traffic surge, a stockout, or a supply chain problem can change a month in a big way. When that happens, annotate it directly and back it up with source documents. Annotate spikes and dips with source documents.
Once buyers can read the monthly pattern with confidence, they usually shift to the next layer: customer-level proof that people come back and buy again.
This is the buyer’s quiet test in plain English: can I trust this revenue history?
If you want diligence to move cleanly, keep channel definitions and the chart of accounts the same across the full look-back period. When those labels or rules change halfway through, trend analysis gets messy fast. Buyers can’t build a clean line from one period to the next, and that’s when diligence slows down.
Here’s the core set of datasets buyers expect, how detailed each one should be, and what question it answers:
| Dataset | Granularity | Period Covered | Buyer Question Answered |
|---|---|---|---|
| Monthly P&L by Channel | Monthly | 36 months | Is growth durable, or is one channel subsidizing a weak one? [1][2] |
| Trailing 12-Month (TTM) Revenue | Rolling monthly | Last 12 months | What is the current run-rate? [11] |
| Revenue Reconciliation Bridge | Monthly | 24–36 months | Does the reported revenue actually match bank deposits? [5][6] |
| Returns & Refunds Log | Monthly | 24 months | Are returns being netted out properly or buried in expenses? [5] |
| Event Annotations | Per event | 36 months | Were spikes or dips caused by one-time events or structural shifts? [2][6] |
With the revenue history cleaned up, buyers usually move to a simple follow-up question: which customers come back, and how often?
Once buyers trust the revenue history, they usually ask the next thing: do customers come back?
Start with cohorts grouped by first purchase month. Then track both spend and active customers over time. This helps buyers see whether retention drops off fast or starts to flatten. When the retention curve levels off instead of sliding toward zero, it points to a loyal customer base and real product-market fit [12].
A healthy brand often shows a cohort returning about 1.5x its first-order revenue by month three and 2x by month eight [1]. That gives buyers a simple yardstick. If your cohort performance falls well short, they'll notice. If it meets or beats that mark, your revenue looks more durable.
Buyers also don't stop at the first-order-month view. They often want cohorts broken out by:
Those cuts can reveal something a top-line cohort chart can't. One channel may bring in customers who buy once and disappear, while another may bring in people who stick around. The same goes for products.
A blended repeat purchase rate doesn't tell the full story. Promotions, seasonality, and one-off spikes can skew it [12]. Buyers want cohort-specific retention instead.
They also want that retention data paired with time to second order: the average gap between a customer's first and second purchase. This matters a lot. A short gap usually means a fast replenishment cycle and faster cash recovery. A long gap - or one that's getting longer - can be a sign that customers aren't coming back as expected.
For brands in the $5M-$15M revenue range, a repeat purchase rate above 25% is a main driver of higher valuation multiples [8]. Buyers also look at how revenue splits between new and returning customers over time. If growth comes almost entirely from new customers, that's a red flag. It can mean the business depends too much on continued acquisition spend just to hold its pace.
After retention, buyers shift to unit economics.
One point matters right away: calculate LTV on gross margin, because buyers will do the same [12][9]. If you present LTV on revenue, you're setting yourself up for a correction later.
The 3:1 LTV:CAC ratio is the standard benchmark for a healthy, scalable e-commerce model [12][9]. But a blended ratio can hide problems. A brand may look fine overall while paid channels are underperforming. Buyers will dig into that anyway, so it's better to show the channel splits up front and explain them clearly.
On payback, a CAC payback period under 12 months points to strong capital efficiency. Anything above 18 months tends to trigger hard questions about cash flow [12]. And if CAC keeps rising without LTV rising with it, buyers often discount forward projections by 20% to 40% [2]. That's a steep haircut.
For subscription or replenishment businesses, Net Revenue Retention (NRR) can have a major effect on valuation. An NRR above 100% means the current customer base is growing on its own, without any new acquisition spend. Buyers tend to treat that as a valuation premium [10].
| Metric | Definition | Buyer Interpretation | Common Mistake |
|---|---|---|---|
| LTV:CAC Ratio | Lifetime value (gross margin) ÷ acquisition cost | Healthy unit economics; 3:1 benchmark [12][9] | LTV calculated on revenue, not gross margin [12] |
| CAC Payback Period | Months to recover acquisition cost from margin | Capital efficiency; under 12 months is strong [12] | Blended averages that mask unprofitable channels [12] |
| Cohort Retention Curve | % of a first-purchase cohort returning each month | Proves product-market fit; curve leveling off = loyalty [12] | Relying on blended repeat purchase rates skewed by promotions [12] |
| Net Revenue Retention (NRR) | Revenue from existing customers vs. prior period | Growth without new spend; above 100% is a premium signal [10] | Failing to subtract refunds and chargebacks [10] |
| Time to Second Order | Average days between first and second purchase | Speed of replenishment cycle and cash recovery | Ignoring distortion caused by out-of-stock events |
Once buyers trust retention and repeat purchase behavior, they move to the next check: can the revenue trend be explained? Cohort data shows whether customers come back. The revenue bridge shows why revenue changed.
Buyers don't expect perfectly flat numbers. They expect movement. What hurts is movement that no one can explain. If you can clearly document every spike, dip, and mix shift across the trailing 24 months, diligence gets a lot less messy.
A revenue bridge breaks revenue change into the main drivers: order volume, AOV, price, channel mix, product mix, and returns [4].
That matters because not all growth means the same thing. A 30% revenue jump from one viral influencer moment tells a very different story than a 30% jump from better retention plus a price increase that held. The top-line number may look the same, but the quality of that growth does not.
Without a bridge, QoE providers can pull 5% to 8% out of your SDE for revenue spikes that don't reconcile [3].
The next job is simple: tie those drivers to actual business events.
Build a dated event log that tracks major promotions, influencer campaigns, stock-outs, fulfillment issues, and marketplace policy changes. For each entry, note the exact revenue impact and whether the event was recurring or one-time [7][6].
This gives buyers context fast. If revenue dipped in March because a best-seller was out of stock for 12 days, say that plainly. If a promo weekend drove a short-term bump, log that too. You're not trying to make the chart look perfect. You're showing that you know what happened and can back it up.
Your bridge and event log need to tie back to reconciled numbers. That means using accrual bookkeeping and reconciling monthly across platforms, payment processors, and bank deposits before going to market [3][1].
Revenue figures should match across systems within a 0.5% variance [10].
If the source numbers don't line up, buyers start digging. And once that happens, small reporting gaps can turn into bigger valuation cuts than you'd expect.
With a documented bridge and clean source support, diligence tends to move faster and valuation risk drops.
The table below shows the most common revenue shift drivers, the evidence that supports each one, and how buyers read them.
| Revenue Shift Driver | Impact on Revenue | Supporting Evidence |
|---|---|---|
| Influencer/Viral Campaign | One-time spike | Campaign dates, Klaviyo attribution, Shopify discount code usage |
| Inventory Stock-out | One-time decline | Inventory aging reports, PO dates, out-of-stock site logs |
| Price Increase | Revenue up / volume down | SKU-level pricing history, gross margin trend reports |
| One-time Wholesale Order | One-time spike | B2B invoices, shipping manifests |
| Marketplace Policy Change | Revenue shift | Amazon Seller Central notifications, fee change logs |
| Returns/Refunds Spike | Lower net revenue | Refund rates by SKU and channel, return policy documentation |
In an e-commerce exit, buyers pay for revenue they can verify.
That’s why the starting point is a clean, reconciled revenue package. If the numbers don’t tie out, diligence can slow down fast.
Buyers usually want to see:
Put simply, they’re looking for clear proof that revenue is tracked the right way and that changes in performance make sense on paper.
If your reporting still needs cleanup before going to market, Phoenix Strategy Group can help prepare the books, models, and data room for diligence.
If your revenue doesn’t fully tie out, buyers may assume the numbers are padded. That can lead to a lower valuation - or kill the deal altogether. Have a documented reconciliation ready before due diligence starts.
Buyers want a clear paper trail. Orders should match settlement statements, and settlement statements should match bank deposits. If there’s any unexplained gap between gross revenue, net revenue, and cash receipts, it stands out fast as a major red flag.
The biggest hits to valuation usually come from revenue risk tied to durability and verifiability.
Here’s the plain-English version: buyers get nervous when revenue looks shaky or hard to prove.
They often cut valuation when too much revenue depends on a single channel, one SKU, or a small group of customers. The same thing happens when reported revenue doesn’t line up with payment processor data or bank deposits. If the numbers don’t match, that’s a red flag. Simple as that.
Other issues can chip away at value too. A drop in repeat purchase rate or weaker cohort retention can signal that demand isn’t holding up. Aggressive revenue recognition can make performance look better than it is. And treating returns as expenses, instead of reducing revenue, can distort the picture.
Heavy dependence on paid media creates another layer of risk, especially when organic and email revenue are thin. If growth only comes from ad spend, buyers may worry that revenue could dry up the moment acquisition costs climb.
Prioritize financial hygiene and reconciliation before diligence begins. You want revenue to match across your platform, payment processor, and bank deposits within 0.5%–1%. Also, use accrual-based accounting. If those numbers don’t line up early, things can get messy fast once buyers start digging in.
Your data room should include:
This gives buyers a clean view of how the business makes money, where that money comes from, and how steady the engine looks over time.