Published on
May 25, 2026

Measuring service delivery time is critical for improving client satisfaction, maintaining profitability, and ensuring projects are completed on time. Here's a quick breakdown of how to measure and optimize service delivery time:
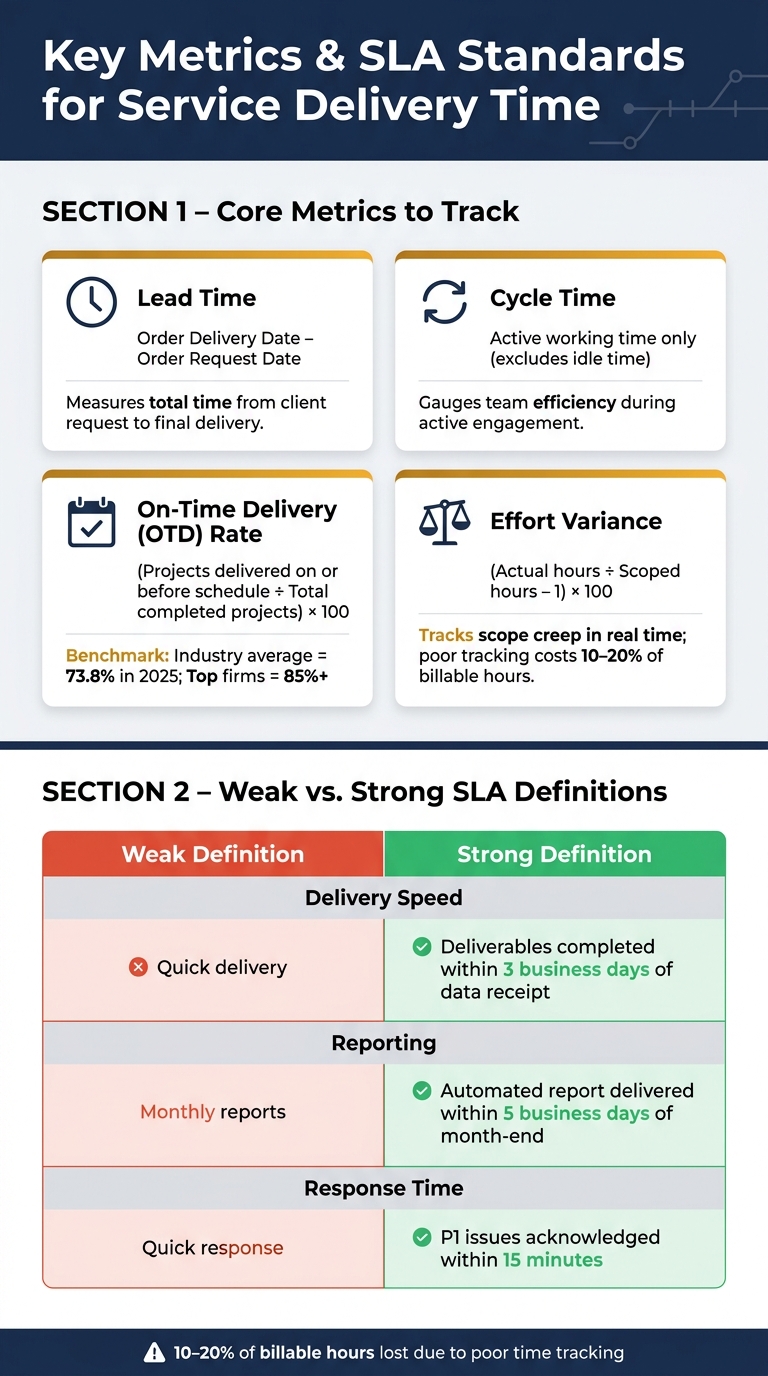
Weak vs. Strong SLA Metric Definitions for Service Delivery
Building on the earlier discussion of measurement basics, setting clear metrics is essential for evaluating service delivery performance effectively.
Start by defining specific start and end points for your services to ensure consistent data collection and meaningful comparisons across projects.
Link your service scope to a Statement of Work (SOW) or contract. For example, the contract signature date could serve as the starting point, and the delivery of the first measurable outcome could mark the endpoint [2]. Be sure to also outline exclusions, such as delays caused by the client or scheduled maintenance, to prevent external factors from distorting your data. Without these exclusions, it becomes harder to pinpoint internal inefficiencies [5].
"Timekeeping is not just a reporting layer. It is the foundation for every financial and operational decision that follows." This is especially true when managing complex budgets through fractional CFO services. - Kailash Ganesh, Author, Rocketlane [4]
Once your boundaries are in place, focus on tracking a few key metrics that provide actionable insights:
It’s worth noting that poor time tracking can cost teams between 10% and 20% of billable hours [4]. Switching to real-time tracking instead of relying on end-of-week timesheets can significantly reduce this loss.
Once your metrics are defined, incorporate them into client agreements through well-structured Service Level Agreements (SLAs). Replace vague terms with specific, measurable thresholds to ensure clarity and accountability.
"Service Level Agreements define measurable performance, remedies, and accountability between buyers and vendors. Strong SLAs use outcome-based KPIs, enforceable service credits, and clear governance models." - ZiaSign [5]
Here’s a comparison of weak versus strong metric definitions:
| Metric Area | Weak Definition | Strong Definition |
|---|---|---|
| Delivery Speed | "Quick delivery" | Deliverables completed within 3 business days of data receipt |
| Reporting | "Monthly reports" | Automated report delivered within 5 business days of month-end [5] |
| Response Time | "Quick response" | P1 issues acknowledged within 15 minutes [5] |
To take this further, implement proactive thresholds. For example, set alerts when 50% or 80% of the allowed delivery time has passed, giving your team a chance to address delays before they escalate [6]. Combine this with a tiered penalty system: minor delays might incur a 5% fee reduction, while chronic issues could result in penalties of up to 20% [5]. These measures ensure accountability for both parties.
Finally, review SLAs annually to reflect changes in service volumes or team capacity [5]. This regular evaluation keeps the agreement relevant and effective.
Getting accurate time data is essential if you want to measure service delivery time effectively. Even with well-thought-out metrics and SLAs, inconsistent or incomplete data can undermine everything. That’s why building a reliable infrastructure for data collection is non-negotiable.
Reliable time data starts with standardized workflows. Tasks need clear ownership, well-defined boundaries, and baseline estimates. When tasks are tied to outcomes rather than activities, the data becomes more comparable across projects, offering better insights at a portfolio level [10].
Assigning one person to each task ensures accountability and avoids variances that are hard to trace. Daily time logging is crucial - delays, even by a single day, can lead to inaccuracies [4]. A helpful framework for managing this process follows a continuous loop: Capture → Validate → Govern → Analyze → Feed into Billing/Forecasting [4].
"Time tracking is the act of logging hours. Timekeeping is the full system around it. It includes validation, policies, approvals, and analysis." - Rocketlane [4]
Once workflows are standardized, the next step is picking tools that integrate seamlessly into your processes.
After creating standardized workflows, it’s time to select tools that align with those processes. For growing companies, tools that link people, time, and costs in a single platform are ideal. Professional Services Automation (PSA) platforms like Kantata, Scoro, and Certinia excel at this, offering real-time insights into capacity and project delivery without the need for manual data pulls [7][8].
The real game-changer is integration. When your CRM (like HubSpot or Salesforce) connects with your PSA and ERP (like NetSuite), everything flows smoothly. For example, when a deal closes, a project can be automatically set up, and time tracking can begin immediately - no redundant data entry required [8].
Here’s a real-world example: In April 2026, Anmol Gupta’s fractional CFO and financial advisory firm used Airtable, Pipedrive, Zapier, and Google Sheets to automate its revenue cycle. By triggering renewals at the 11-month mark using Airtable, the firm cut its revenue cycle from 18–19 months to just 12–13 months [9].
"The best hire is often a well-designed workflow." - Anmol Gupta, Founder, PhotonMan [9]
Once you’ve chosen the right tools, the focus shifts to maintaining data accuracy and quality.
The key to maintaining high-quality data is enforcing strict rules at the point of entry. For example, configure your system to flag entries that exceed planned effort, require notes for overruns, or misclassify labor types [4]. This preventive governance approach catches errors early, preventing them from affecting billing or forecasting.
In addition to entry controls, conduct weekly variance reviews instead of waiting for monthly ones. Comparing planned versus actual effort at the task level allows you to address issues before they derail milestones [10]. To avoid conflicting reports, use standardized naming conventions and a shared business calendar across all tools. This prevents "reconciliation drift", where different teams report inconsistent utilization figures from the same data [11].
When rolling out a new system, consider running parallel billing for the first month. Generating invoices in both the old and new systems can reveal discrepancies in rates or time entries before they impact clients [12].
"Time tracking does not automatically create discipline. It creates visibility. Discipline emerges when teams consistently examine variance, interpret patterns, and adjust delivery behavior accordingly." - Rocketlane [10]
Once you've collected accurate data, the next step is to turn raw timestamps into meaningful insights. This is where segmentation and visualization come into play, transforming numbers into actionable information.
To measure efficiency, start by breaking down your process into key timestamps - such as when a request is received, work begins, work is completed, and the service is delivered. These timestamps allow you to calculate essential metrics like average delivery time, on-time delivery (OTD) rate, and On-Time In-Full (OTIF), which checks if orders meet both timing and completeness criteria.
Two calculation methods are particularly useful. First, adjust for business hours unless your operations run 24/7. For example, excluding weekends helps avoid skewed averages [13]. Second, decide whether to calculate based on the customer's request date for a more holistic view or the promise date to assess internal performance [14]. For a revenue-focused perspective, you can use a weighted OTD calculation, factoring in revenue instead of just order count [14].
These calculations build on earlier steps, helping you apply insights to improve your service delivery process.
"On-time delivery is not a metric you hope improves - it is a metric you engineer." - User Solutions Team [14]
While overall averages are helpful, segmenting your data uncovers patterns and variations that might otherwise go unnoticed. Break the data down by factors like client type, service category, order complexity, or team member. This approach can expose inefficiencies, such as recurring delays in specific areas, that broad averages might hide [15].
For instance, analyzing Average Handle Time (AHT) by task complexity may reveal that some team members excel at routine tasks but struggle with more challenging ones, highlighting a need for additional training [16]. Similarly, looking at delivery performance by day of the week or workflow stage can pinpoint where delays are most likely to occur [17].
Once you've segmented the data, use it to locate bottlenecks in your process.
Interestingly, actual processing time often accounts for only 10–15% of total lead time. The rest is usually made up of queue time, waiting for approvals, or delays during handoffs [14]. To identify bottlenecks, track timestamps at each workflow stage - such as when an order is placed, assigned, in progress, under review, dispatched, and delivered. This step-by-step breakdown makes it easier to pinpoint vague delays and uncover their root causes, whether it's overpromising delivery dates, inefficient task sequencing, or unexpected downtime [14].
"A reliable five-week lead time is better for customer relationships than an optimistic three-week promise followed by a two-week delay." - User Solutions Team [14]
Automated alerts for tasks that exceed expected durations are another useful tool. Catching delays early - especially at critical stages like dispatch - can prevent missed deadlines and keep things running smoothly [13].
Once you've identified delays in your service delivery, the next step is to set realistic, data-backed targets. Use historical performance metrics to guide these goals. For example, calculate the average, median, and 90th percentile delivery times for each service type. If your median onboarding time is 8 days and 90% of cases are completed in 12 days, a 10-day SLA (Service Level Agreement) target could be a practical benchmark.
Establish targets at different levels:
Review these benchmarks regularly, especially when changes occur in staffing, tools, or customer demand patterns.
"Using historical data, we build a forecast and establish realistic, actionable targets for the company, aligning growth strategies with financial goals." - Phoenix Strategy Group
These benchmarks provide the foundation for process improvements, which we'll explore next.
With clear targets in hand, the next focus is streamlining workflows to eliminate unnecessary delays. Most delays occur during waiting periods between tasks. By mapping your entire workflow and timing each stage using system timestamps, you can pinpoint bottlenecks. Look for steps with long durations, frequent rework, or excessive handoffs.
Some practical fixes include:
For example, one professional services firm found that collecting client data accounted for 40% of their onboarding time. By introducing standardized intake forms, automated reminders, and pre-call checklists, they cut this stage's time in half, reducing overall onboarding time by 20%.
Technology can be a game-changer when paired with process improvements. Modern tools can do more than track time - they actively prevent delays. Platforms like Jira Service Management, ServiceNow, or Asana can:
For organizations handling complex, data-heavy services, consolidating information from ticketing, finance, and time-tracking systems into a unified dataset can provide leadership with full visibility into the delivery process. This approach allows for real-time tracking, from the first client interaction to project completion.
"When you put the Right Data in front of an Empowered Team, they get better." - Phoenix Strategy Group
A practical way to introduce new tools or automation is by piloting them with a single team. Measure delivery times before and after implementation, refine the process, and then roll it out more broadly. Remember, automation is most effective when built on a well-structured workflow.
Tracking service delivery time isn't just about keeping tabs - it directly impacts your revenue. Professional services teams that fail to consistently monitor delivery time often lose between 10% and 20% of their billable hours annually [4]. For each employee, this can translate into thousands of dollars in lost revenue every year.
This guide emphasizes a crucial shift: moving from relying solely on lagging indicators to incorporating leading ones. Metrics like revenue and utilization reflect past performance, but leading indicators - such as milestone completion rates, 30-day utilization forecasts, and mid-project satisfaction scores - can alert you to potential issues 6 to 8 weeks before they show up in your financial results [2].
"Lagging KPIs tell you the score. Leading KPIs tell you whether you'll win the next game." - Kailash Ganesh, Author [2]
Balancing speed with quality is another critical takeaway. While fast response times are important, they need to be paired with metrics like First Contact Resolution (FCR) and Customer Satisfaction (CSAT) for a complete picture. For instance, customers who receive a response within 5 minutes rate their experience three times higher than those who wait an hour [18]. However, focusing on speed alone without ensuring quality can harm client trust in the long run.
The most successful businesses aren't just quicker - they're proactive. They excel at spotting problems early, addressing them in real time, and embedding accountability throughout their processes. Leading professional services firms maintain on-time delivery rates above 85% and limit project overruns to less than 15% [2]. They treat delivery measurement as a foundational part of their operations, rather than an afterthought. By adopting these practices, you can turn service delivery into a competitive advantage that drives efficiency, accountability, and profitability.
Lead time refers to the total time it takes from the moment a request is made until the final result is delivered. This includes all waiting periods and any delays along the way. In contrast, cycle time focuses solely on the active work time - the time spent actually working on the task - leaving out any idle periods. Understanding both metrics is key to spotting delays and boosting efficiency in the entire process.
To effectively measure delivery time, you need to establish clear start and end points tailored to your operations:
Make sure to record timestamps with precision. Adjust for external factors like weather to ensure your focus remains on improving internal processes.
To spot bottlenecks, conduct a thorough root cause analysis of the delivery process. Track key steps like order release, picking, packing, and carrier pickup. Pay attention to patterns in delays that might highlight recurring problems. Additionally, leverage performance tools to assess factors like on-time pickups, transit reliability, and responsiveness. By combining a detailed timeline review with performance data, you can identify and address bottlenecks more efficiently.