Published on
November 26, 2025

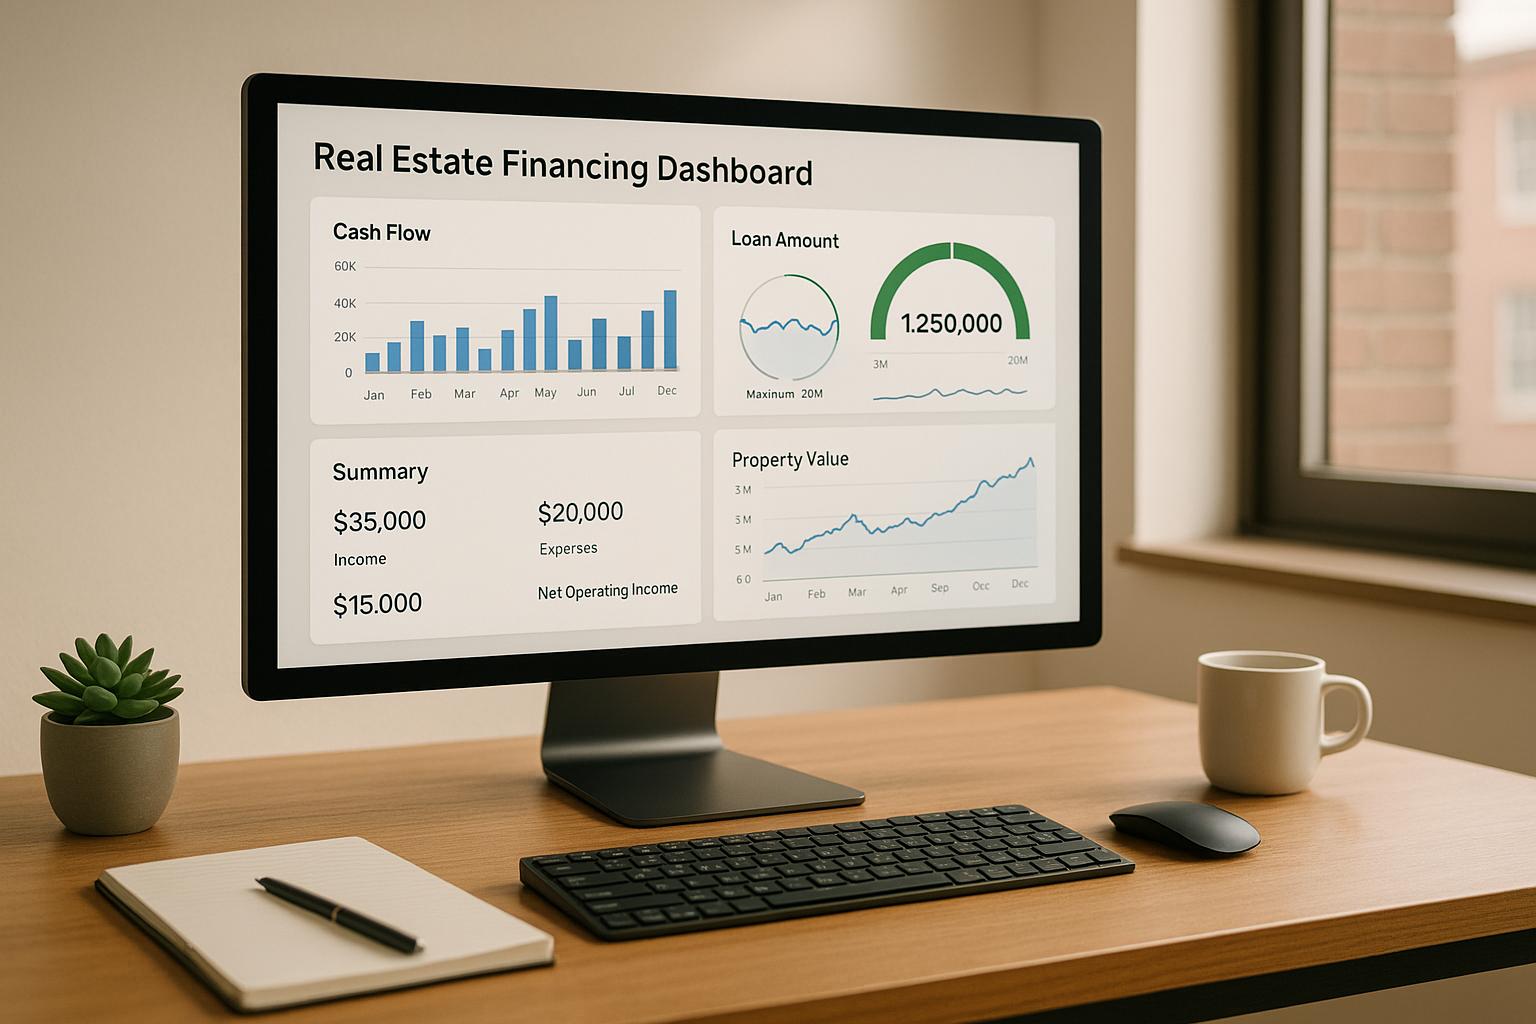
Real estate financing dashboards simplify managing complex financial data for professionals. These tools centralize information from various sources, like QuickBooks and property management systems, into one interactive hub. Key benefits include:
Dashboards are transforming how real estate firms manage finances, offering clarity, efficiency, and actionable insights. Pairing these tools with expert advisory services can further optimize performance and drive growth.
Managing multiple loans and deals can quickly become overwhelming without the right tools. Centralizing financial data is key to simplifying loan tracking and deal management. Real estate financing dashboards tackle this challenge by gathering all loan information into one place, offering teams a clear view of every stage in the deal process. This not only improves how lending activities are monitored but also supports smarter decisions about capital allocation.
A centralized dashboard brings all your loan data together in one place. Instead of juggling multiple systems to check on portfolio health, teams can instantly view critical metrics like total loan volume, number of deals, sponsor exposure, and important dates such as origination, maturity, and payment deadlines [3]. By reducing data silos, this approach makes it easier to pinpoint loans that need immediate attention.
For example, Phoenix Strategy Group offers data engineering services that include analytics and dashboards as part of their financial solutions. They design systems to process data, generate essential metrics, and build forecasts that help teams set actionable goals [1].
Keeping track of loan statuses and key milestones in real-time ensures no detail is missed. Dashboards provide a clear picture of where each loan stands, highlighting the next steps to keep everything on schedule. This visibility helps teams stay on top of follow-ups, meet deadlines, and make the most of available capital [3].
Take this example: a dashboard might show one loan stuck in underwriting while another is ready to close after meeting all conditions. With this clarity, teams can prioritize their efforts and allocate resources more effectively. Additionally, comparing current performance with historical trends helps refine processes and improve overall efficiency. This level of detailed tracking also lays the groundwork for a comprehensive view of the entire deal pipeline.
Visualizing the deal pipeline turns complex data into easily understandable insights. Tools like interactive charts, funnel diagrams, and Gantt charts showcase deals by stage, value, and expected close date. This helps teams focus on high-value opportunities and spot patterns or trends [3][5].
For instance, a New York-based firm used dashboard visualizations to speed up deal offers and monitor risks, leading to better capital deployment [3].
Pipeline visualization also reveals recurring challenges and successful strategies. If a funnel chart shows deals consistently stalling during due diligence, teams can reallocate resources or streamline processes to address the issue. These visual tools transform raw data into actionable strategies, making it easier to optimize deal outcomes.
Dashboards are transforming real estate management by combining centralized loan tracking with real-time cash flow insights and automated distribution processes. These tools provide up-to-the-minute visibility into asset performance, helping teams make informed decisions quickly.
Keeping tabs on cash flow in real time means managers can see exactly how money flows in and out of properties at any moment. Key metrics, such as gross rental income, operating expenses, capital expenditures, and net cash flow, are tracked continuously. This kind of instant access helps teams spot trends or address issues - like unexpected costs or revenue dips - before they snowball into bigger problems.
Take this scenario: if a property’s net cash flow suddenly drops, managers can immediately investigate. Is it due to an uptick in vacancies? Rising maintenance costs? Something else? With these insights, they can tweak leasing strategies or tighten expense management as needed. Plus, integrated systems automatically categorize income and expenses, reducing the need for time-consuming manual data entry. Real-time tracking also includes automatic alerts for unusual cash flow changes, ensuring teams can respond quickly to anomalies. This ongoing monitoring sets the stage for smoother, automated distribution processes.
Manually calculating distributions can be error-prone, especially when dealing with complex waterfall structures and multiple investors. Automated systems eliminate this risk by applying pre-set rules to allocate cash flows according to investor agreements. These systems account for factors like preferred returns, profit splits, and capital contributions, ensuring every payment is spot-on.
For instance, CAPX, a real estate investment firm, saw major efficiency gains when they adopted a dashboard solution in 2024. By automating investor reports and statements, they reduced their operational workload by 50%, allowing their team to focus on strategic initiatives instead of manual calculations [2].
Automation doesn’t stop there. When properties are sold or refinanced, dashboards can instantly calculate payouts for each investor based on agreed terms. This level of transparency strengthens trust among stakeholders, as the system clearly shows how distributions are calculated and when payments are scheduled.
Understanding property performance requires more than just tracking cash flow. It demands a detailed look at income and profitability metrics. Real estate dashboards make this possible by analyzing data such as gross rental income, net operating income (NOI), cash-on-cash return, and internal rate of return (IRR).
These metrics help teams determine if properties are meeting financial goals. For example, a dashboard might reveal a 10% year-over-year increase in NOI, signaling better operational efficiency. On the flip side, a drop in gross rental income could point to occupancy challenges. Visual tools, such as charts comparing occupancy and vacancy rates, make it easier for non-accounting professionals to grasp the data and make smart decisions.
Phoenix Strategy Group offers tailored analytics and dashboards to help real estate firms measure these critical metrics. Their fractional CFO services, including FP&A, strategic finance, forecasting, and budgeting, provide the expertise needed for a comprehensive analysis of income and profitability across real estate portfolios [1].
Keeping up with regulatory requirements and generating accurate reports can be a time-consuming burden without the right tools. Today’s real estate financing dashboards solve this issue by automating report generation, managing compliance documentation, and integrating smoothly with existing software systems.
Modern dashboards pull data from multiple sources to create real-time, detailed reports. These reports cover everything from distribution notices and capital account statements to in-depth performance summaries - no manual effort required.
Take CAPX, for example. By automating its reporting process, the company cut its workload by 50% [2]. This freed up their team to focus on strategic goals instead of drowning in administrative tasks.
One of the biggest advantages of automated reporting is consistency. Every report follows a uniform format and pulls data from the same sources, minimizing the errors that often come with manual processes. This standardization is particularly helpful during audits, as familiar report structures and reliable data make the review process much smoother.
The benefits of automated reporting are amplified by seamless software integration. Connecting your dashboard to existing accounting and property management systems ensures all data stays synchronized. Platforms like Agora, for example, offer pre-built integrations with popular tools like QuickBooks and Sage, along with API functionality for custom setups.
These integrations eliminate duplicate data entry, reducing errors in financial records. For instance, when a rent payment is recorded in your property management system, it automatically updates in your dashboard’s cash flow reports. Similarly, expenses logged in QuickBooks instantly reflect in calculations like NOI and distribution analyses.
This synchronization goes beyond basic transactions. Integrated systems keep accurate records of capital contributions, preferred returns, and profit splits, ensuring compliance documentation is always up to date. By creating a single, reliable source of financial data, these integrations simplify audit preparation and enhance overall accuracy.
Digital document management takes compliance to the next level. Instead of juggling scattered files, modern dashboards provide centralized storage with secure access controls and audit trails.
Features like Agora’s Smart Questionnaire simplify investor onboarding by enabling stakeholders to upload, review, and sign documents online. This streamlined workflow speeds up approvals while maintaining the security and legal standards required for compliance.
E-signature tools also remove the delays associated with physical paperwork. Whether it’s updating distribution agreements or signing new compliance forms, stakeholders can complete the process from anywhere. The system tracks every signature, creating a detailed audit trail that meets regulatory expectations.
By leveraging advanced integration and automation, firms can improve both compliance and operational efficiency. Phoenix Strategy Group, for instance, uses its fractional CFO services and FP&A expertise to help real estate companies implement these systems effectively. Their knowledge of data engineering and strategic finance ensures that dashboard integrations align with broader financial goals, supporting both everyday operations and long-term growth.
The combination of automated reporting, seamless integrations, and digital document management offers a scalable compliance solution. These tools not only make dashboards more efficient but also ensure smoother operations and quicker regulatory adherence.
Once reporting and compliance are automated, the next step is to implement proactive alerts and risk management tools to strengthen financial oversight. Real estate portfolios generate an overwhelming amount of data, making manual oversight nearly impossible. Custom alerts and risk management features transform dashboards from passive data displays into active monitoring systems that catch potential issues before they snowball.
Custom alerts are designed to highlight events that could negatively impact portfolio performance. For example, reminders about upcoming payment deadlines help avoid missed loan payments, while alerts for covenant breaches - like a drop in debt service coverage ratios - can prevent defaults or legal troubles.
Modern dashboards allow teams to set specific thresholds, such as generating alerts for loan payments overdue by more than five days or occupancy rates falling below 80%. These alerts can be delivered via email, text messages, or in-app notifications, ensuring that the right team members are informed promptly.
Alerts can also detect unusual patterns, like sudden drops in cash flow or unexpected spikes in maintenance costs. These red flags encourage teams to investigate further, potentially uncovering broader financial issues that might have otherwise gone unnoticed.
The effectiveness of these alerts lies in their customization. Teams can decide which metrics to monitor, define threshold values, choose notification methods, and assign alerts to the right personnel. This ensures that attention is focused on the most pressing risks without drowning in unnecessary notifications. By addressing potential problems in real time, these alerts complement automated reporting to provide a more dynamic risk management system.
Gaining a full understanding of your debt situation requires more than just knowing the total amount owed. Advanced dashboards offer a centralized view of all loan data, including total debt, payment schedules, interest rates, and maturity dates across the portfolio.
These dashboards clearly display key metrics like outstanding principal, upcoming payments, and debt-to-equity ratios. Visual cues, such as color-coded indicators, quickly highlight areas that need attention - like loans nearing maturity or those with high interest rates.
Covenant monitoring is another essential feature. Dashboards automatically track compliance metrics like debt service coverage ratios, loan-to-value ratios, and interest coverage ratios for individual loans. If a covenant is breached or appears at risk, automated alerts notify the team so they can act before the situation worsens.
This transparency extends to liability tracking, where dashboards organize loans by property. This makes it easier to identify which assets carry the heaviest debt burdens and spot opportunities for refinancing or restructuring.
Risk analysis at the asset level helps pinpoint underperforming properties and identify emerging market trends. Dashboards can highlight properties with declining occupancy, rising maintenance costs, or negative cash flow trends, prompting immediate investigation and action.
Performance insights go deeper than surface-level financial metrics. Advanced dashboards track data like holding periods, property value trajectories, and market conditions. This helps teams make informed decisions on when to sell, refinance, or reinvest in specific assets. By focusing resources on high-priority properties, teams can address issues more effectively.
Automated risk assessment tools take it a step further by scanning large datasets to identify patterns - like repeated late payments across multiple properties - that could signal broader financial risks. Combining real-time monitoring with predictive analytics empowers teams to allocate resources wisely and make strategic decisions.
Phoenix Strategy Group brings expertise in data engineering and fractional CFO services to implement these advanced risk management systems. Their financial modeling and strategic advisory experience ensure that alerts and risk assessments align with both day-to-day operations and long-term business goals, creating a solid foundation for growth and stability.
Managing a portfolio effectively calls for dashboards that turn raw numbers into clear, actionable insights.
A well-crafted dashboard pulls together key metrics - like total portfolio value, IRR (Internal Rate of Return), NOI (Net Operating Income), occupancy rates, and cap rates - into one concise view. By centralizing these metrics, you can ditch the spreadsheets and focus on what matters most: understanding your portfolio’s health at a glance[2][4].
This consolidated view is particularly useful for spotting trends, such as falling occupancy rates across properties, which could signal larger market shifts that require immediate action. When metrics are displayed using U.S. dollar formatting (e.g., $1,250,000) and the MM/DD/YYYY date format, American investors can process the information quickly without confusion[4].
Dashboards often include summary tiles for headline metrics and color-coded charts for quick trend identification. For instance, green might indicate properties outperforming expectations, while red highlights assets needing immediate attention. This visual setup eliminates the need to sift through endless rows of data to gauge portfolio performance.
Additionally, dashboards track cash-on-cash returns and holding periods for individual assets, offering insights into when to sell, refinance, or reinvest. Interactive tools build on this functionality, allowing users to dig deeper into the data.
Interactive dashboards take things further with features like heat maps, drill-down capabilities, and dynamic charts, making it easier to analyze complex data.
Heat maps are particularly effective for visualizing geographic performance across a portfolio. By clicking on specific regions, users can uncover property-level NOI trends or identify areas where market dynamics are shifting. This makes it simpler to pinpoint opportunities or address challenges within specific markets[4].
Drill-down features let users start with a high-level overview of portfolio metrics and then dive into individual properties or asset categories. For example, if overall performance is lagging, you can filter by property type - residential, retail, or commercial - to pinpoint the issue. This targeted approach helps teams allocate resources more efficiently.
Dynamic charts allow for time-based comparisons, revealing performance trends over months or years. Users can adjust date ranges, compare KPIs side-by-side, or layer in market data to understand how external factors impact portfolio performance. These tools transform dashboards into platforms for in-depth analysis, rather than just static reports.
Real-time tracking ensures that your portfolio metrics reflect current market conditions, providing an up-to-date view of rent collections, loan balances, and market valuations. With this level of immediacy, teams can respond quickly to changes and make informed decisions[2][3].
By automating data updates, real-time tracking reduces manual work and speeds up decision-making. For example, one firm eliminated the need to manually compile data from multiple sources, freeing up time for strategic analysis and investor engagement[2].
This approach is especially valuable for managing debt. Automated loan status updates help avoid missed payments and identify refinancing opportunities as they arise. Similarly, real-time updates on occupancy changes or maintenance costs allow teams to address issues before they escalate and impact overall performance.
Integrating with tools like QuickBooks and property management systems ensures seamless updates without manual data entry. These integrations bring together information on loans, cash flow, and portfolio performance into a single system, making it easier to track and manage key metrics[2].
Phoenix Strategy Group specializes in building such systems for real estate clients. Their expertise in financial modeling and forecasting ensures that dashboards focus on the KPIs that align with each portfolio’s strategy. Additionally, their fractional CFO services help firms connect dashboard insights to broader business goals, ensuring data-driven growth and decision-making.
| KPI Metric | Description | Typical Use Case |
|---|---|---|
| IRR | Internal Rate of Return | Assess investment performance |
| NOI | Net Operating Income | Evaluate profitability |
| Occupancy Rate | % of units leased | Monitor leasing performance |
| Cap Rate | Capitalization Rate | Compare asset value vs. income |
| Cash-on-Cash Return | Annual cash income vs. cash invested | Measure cash yield |
| Holding Period | Duration asset held in portfolio | Inform buy/sell decisions |

At Phoenix Strategy Group, financial advisory services go beyond the basics. By integrating expert advice with real estate financing dashboards, they turn raw data into actionable strategies. Their key offerings - financial modeling, fractional CFO support, and integrated financial solutions - help businesses unlock the full potential of their dashboards while aligning with broader growth objectives.
Phoenix Strategy Group specializes in crafting tailored cash flow models and scenario analyses that integrate seamlessly with real estate financing dashboards. These tools help teams explore how different market conditions - like shifts in occupancy rates or interest rate changes - affect financial outcomes.
Using real-time dashboard data, they develop dynamic forecasting systems to project essential metrics like NOI (Net Operating Income), DSCR (Debt Service Coverage Ratio), and projected returns. For example, if a dashboard shows a property's DSCR nearing a critical level, their models can quickly assess the financial impact and suggest corrective steps.
In one instance, Phoenix Strategy Group created a cash flow model for a multi-family portfolio. By incorporating real-time rent and expense data, they boosted overall cash flow by 12% in just six months[2].
Their approach ensures that dashboard metrics are more than just historical data. By combining past trends with current market conditions, they provide actionable targets that align with each client’s growth strategies and risk tolerance.
For growth-stage real estate companies, Phoenix Strategy Group offers fractional CFO services that combine strategic financial leadership with dashboard optimization.
Their services include creating detailed financial forecasts, preparing investor-ready reports, and running scenario analyses to enhance dashboard utility. This becomes especially valuable when companies need to present clear, reliable financials to lenders or investors. By leveraging dashboard data, they strengthen funding proposals and exit strategies.
Their FP&A (Financial Planning and Analysis) support transforms dashboards from passive reporting tools into active decision-making platforms. They identify the most critical KPIs, ensure these are prominently displayed, and conduct weekly reviews to help companies turn insights into actionable plans.
"As our fractional CFO, they accomplished more in six months than our last two full‑time CFOs combined. If you're looking for unparalleled financial strategy and integration, hiring PSG is one of the best decisions you can make."
– David Darmstandler, Co‑CEO, DataPath[1]
Clients have reported tangible results, including a 40% faster financial close cycle and a 15% boost in investor satisfaction thanks to enhanced transparency and real-time KPI tracking[2].
Phoenix Strategy Group takes dashboard integration to the next level by connecting them with accounting, property management, and CRM platforms. This automation reduces manual errors, ensures data accuracy, and provides a unified view of financial performance.
Their data engineering team builds ETL pipelines and data warehouses, supporting advanced analytics and enabling businesses to benchmark performance against industry standards. This technical expertise ensures that real estate companies can make the most of their proprietary data.
But their work doesn’t stop at technical integrations. Phoenix Strategy Group bridges the gap between finance and operations, turning dashboard insights into coordinated actions across departments. Their Monday Morning Metrics system keeps teams focused on KPIs and strategic goals through regular reviews.
"PSG saved my dream. They helped us get our financials in order and renegotiate our lending agreements, pulling us through a tough financial crunch."
– Norman Rodriguez, Founder / CEO, ElevateHire[1]
Real estate financing dashboards can transform portfolio management when equipped with the right tools. Key features like centralized loan tracking, real-time cash flow monitoring, automated distribution calculations, and custom alerts come together to create a powerful financial management system that enhances decision-making.
Take this example: one firm managed to cut its operational workload by 50% thanks to dashboard automation [2]. This allowed them to redirect valuable resources toward strategic growth efforts.
To get the most out of these dashboards, integration and automation are essential. By linking dashboards with existing accounting and property management systems, you eliminate data silos and gain a unified view of financial performance. Additionally, setting up custom alerts for critical events - like missed payments, loan covenant violations, or changing market conditions - enables teams to shift from reactive problem-solving to proactive risk management. Together, these elements lay the groundwork for smarter financial strategies.
Pairing advanced dashboard capabilities with expert financial advice - such as guidance from Phoenix Strategy Group - turns raw metrics into actionable plans that drive growth and strategic decision-making.
"When you put the Right Data in front of an Empowered Team, they get better."
- Phoenix Strategy Group
The best dashboards don't just improve efficiency; they enhance transparency for investors and strengthen a firm's competitive edge. Companies that embrace these tools alongside expert advisory services position themselves for long-term success in a challenging market.
Real estate financing dashboards simplify portfolio management by offering real-time insights into essential financial metrics. They bring everything you need - loan tracking, cash flow monitoring, and trend analysis - into a single, centralized platform.
Equipped with tools like automated alerts for critical financial thresholds and in-depth cash flow analysis, these dashboards help you make informed decisions with confidence. By transforming complex data into clear, visual formats, they enable you to evaluate performance quickly, allocate resources more effectively, and plan strategically for growth.
Automation significantly enhances real estate financing dashboards by cutting down on manual tasks and boosting data precision. With features like real-time loan tracking, cash flow analysis, and custom alerts, it empowers users to make quicker and more informed decisions.
By taking over repetitive tasks like data entry and report generation, automation not only saves time but also reduces the likelihood of errors. This means financial insights are consistently accurate and ready to act on, simplifying the management of complex financing operations.
Integrating real estate financing dashboards with tools like QuickBooks and property management software can simplify your workflow and improve decision-making. By connecting your financial data with property management tasks, you cut down on manual data entry, minimize errors, and save valuable time.
This setup also gives you a clear picture of your financial standing, making it easier to track cash flow, evaluate loan performance, and create accurate reports with less effort. Plus, real-time updates and alerts ensure you're always aware of key metrics, enabling you to stay ahead in managing your investments effectively.