Published on
April 2, 2026


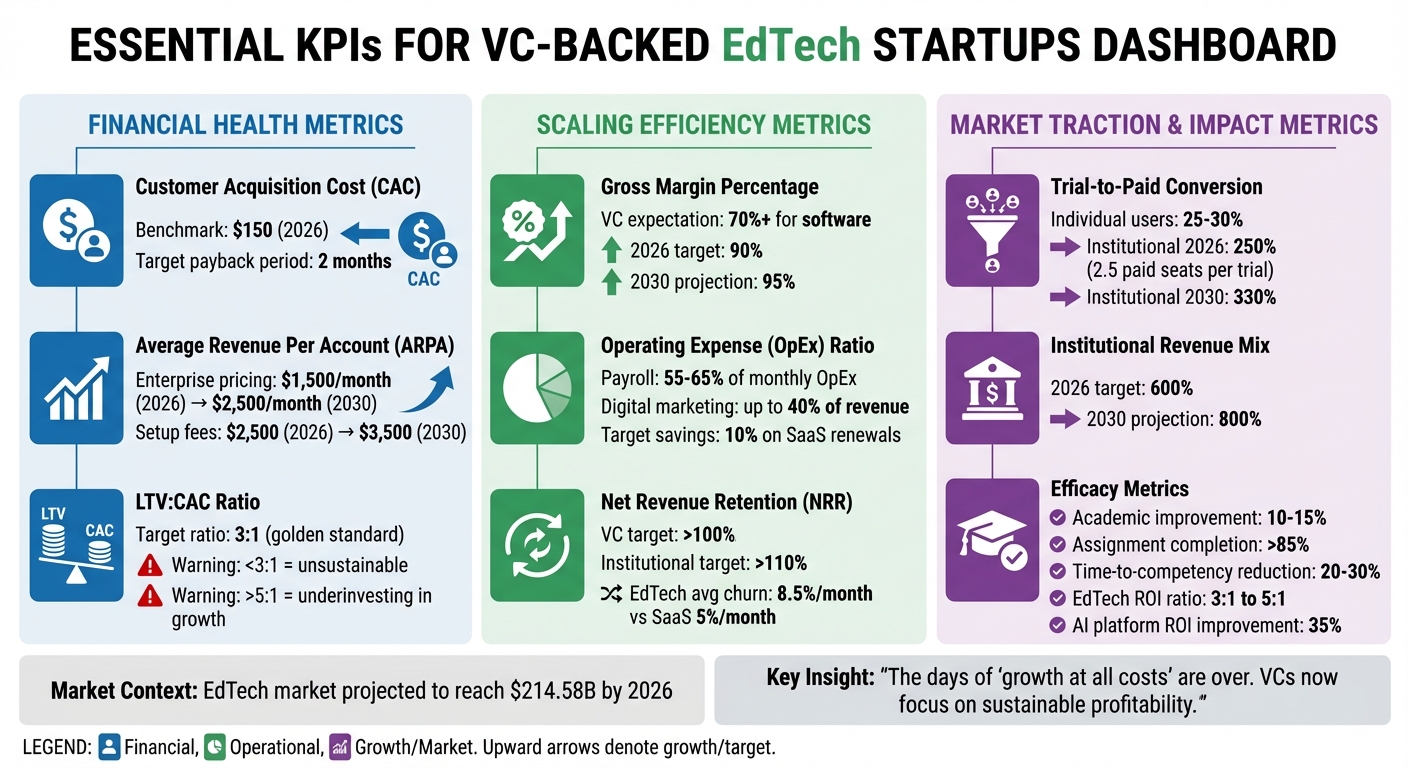
Key Performance Indicators (KPIs) are essential for VC-backed EdTech startups to measure progress, attract investors, and secure funding. With the EdTech market projected to hit $214.58 billion by 2026, having clear, measurable KPIs is no longer optional - it’s a must. Investors now prioritize metrics that show financial health, scalability, and educational impact.
Here’s what matters most:
Tracking KPIs consistently, using the right tools, and aligning them with your growth stage can build investor confidence and set your startup up for long-term success.
Essential KPIs for VC-Backed EdTech Startups: Financial, Operational & Growth Metrics
When it comes to attracting investors, financial KPIs are the heartbeat of decision-making, often managed by a fractional CFO. For venture capital-backed EdTech startups, three metrics stand out: Customer Acquisition Cost (CAC), Average Revenue Per Account (ARPA), and Lifetime Value (LTV) (along with its ratio to CAC). These figures paint a clear picture of your business’s financial health and its ability to scale profitably.
CAC tells you how much it costs to bring in a single paying customer. To calculate it, divide your total sales and marketing expenses - everything from ad spend to salaries - by the number of new paying customers during the same period [1]. For EdTech startups, the benchmark CAC for 2026 is $150 [1].
Keeping a close eye on CAC each month can help you spot inefficiencies in your sales funnel or onboarding process. For example, startups that take longer than 14 days to onboard trial users often experience higher churn rates [1]. One way to combat this is by focusing on high-value institutional plans, which start at $1,500 per month. These plans distribute acquisition costs across multiple users, effectively reducing your per-user CAC [1].
It’s also smart to break down CAC by customer type to see which channels are delivering the best return on investment (ROI) [1]. Tracking your CAC payback period is another crucial step - aim to recover acquisition costs within two months [1]. Once you have a handle on CAC, the next step is to evaluate ARPA to ensure your pricing strategy is driving recurring revenue.
ARPA measures how much revenue each customer account generates on average every month. To find it, divide your Total Monthly Recurring Revenue (MRR) by the total number of paying accounts [1].
EdTech startups can increase ARPA by adjusting pricing and encouraging customers to move to higher-tier plans. Many successful companies focus on transitioning mid-tier customers to enterprise-level agreements, such as district-wide contracts, which not only boost ARPA but also reduce support costs [1]. By 2030, enterprise subscription pricing is expected to climb from $1,500 to $2,500 per month, with one-time setup fees around $2,500 [1].
But ARPA isn’t just about the size of the initial contract - it’s also tied to how customers use your product. Metrics like Daily Active Users (DAU) and feature adoption within large organizations are becoming key drivers of revenue growth [1]. Managing ARPA effectively strengthens your revenue streams and bolsters your case for long-term profitability.
LTV estimates how much gross profit a customer generates over the course of their relationship with your company. The LTV:CAC ratio, meanwhile, compares this lifetime value to your acquisition cost. For venture-backed EdTech startups, a 3:1 ratio is the sweet spot - it signals that your sales and marketing spend is sustainable [1][2][3][5].
"The 3:1 ratio is a golden standard. If the CAC is high, you are wasting too much money to bring in customers." - Ksenia Novikova, Head of Operations, F1V [5]
Falling below the 3:1 threshold can indicate unsustainable unit economics, which might scare off investors or lead to reduced valuations. On the flip side, a ratio exceeding 5:1 could mean you’re not investing enough in growth [2].
To improve LTV, focus on making your product indispensable. Features like adaptive learning engines can boost engagement, while maintaining a Net Revenue Retention (NRR) above 110% - through upsells and low churn - can significantly enhance LTV [1]. With the average monthly churn for EdTech platforms sitting at 8.5%, compared to 5% for general SaaS, retention strategies are critical to improving LTV and building investor trust [4].
Together, these KPIs provide a clear snapshot of your startup’s financial health and scalability - key factors that investors look for when deciding whether to fund your growth.
Once your financial foundation is in place, operational metrics take center stage in driving efficient growth. These KPIs help determine whether your business is scaling profitably or burning through resources. For VC-backed EdTech startups, three metrics are especially crucial: Gross Margin Percentage, Operating Expense (OpEx) Ratio, and Net Revenue Retention (NRR). Let’s unpack how each one contributes to scalable growth.
Gross margin measures the percentage of revenue left after covering the direct costs of delivering your product, such as cloud hosting and content royalties. For software-based EdTech companies, venture capitalists typically look for gross margins of 70% or higher [3]. This reflects a scalable technology model, not a service business masquerading as software.
"For software-based solutions, VCs expect gross margins of 70% or higher. This proves your solution is not a service business disguised as a tech product." – Developers.dev [3]
Future projections for EdTech software businesses show gross margins starting around 90% in 2026 and potentially reaching 95% by 2030 [6]. Achieving these benchmarks requires tight control over variable costs. For example, in 2026, cloud hosting could consume 60% of revenue, while content royalties might take up the remaining 40% [6]. Without disciplined cost management, profitability can stagnate [6].
To improve gross margins, focus on securing Institutional Enterprise deals. These contracts typically offer higher per-user revenue and include setup fees, which are expected to rise from $2,500 in 2026 to $3,500 by 2030 [6]. Additionally, negotiating vendor discounts - like 20% savings through multi-year commitments - or transitioning to microservices architecture can reduce infrastructure costs and improve scalability [3][6].
The OpEx ratio tracks how much you're spending on operating costs - such as payroll, marketing, and sales commissions - relative to revenue. Early-stage EdTech companies often see payroll consuming 55% to 65% of monthly operating expenses, driven by heavy investment in engineering for proprietary learning platforms [7].
Digital marketing and sales commissions can also take significant chunks, with advertising claiming up to 40% of revenue and commissions reaching 50% [7]. As revenue grows, fixed costs like payroll should shrink as a percentage of overall expenses, while variable costs like marketing and infrastructure may claim a larger share [7].
To keep OpEx under control:
Stress-testing financials with scenarios assuming a 25%–30% shortfall in sales targets can help ensure your OpEx ratio remains sustainable, even during slower onboarding periods [7]. A lean cost structure strengthens scalability and supports long-term growth.
NRR gauges whether revenue from existing customers - via upsells and expansions - outpaces losses from churn. For subscription-based EdTech companies, VCs prioritize NRR above 100%, as it demonstrates the ability to grow without relying solely on acquiring new customers [3].
To calculate NRR: Start with your monthly recurring revenue (MRR), add expansion revenue (upgrades), subtract contraction revenue (downgrades) and churn, then divide by the starting MRR.
EdTech faces a unique challenge, with platforms losing an average of 8.5% of subscribers monthly, compared to the 5% churn rate typical for general SaaS products [4]. Effective retention strategies are critical. The first week of onboarding is crucial, accounting for 80% of long-term retention. Personalized learning paths, streaks, badges, and milestone celebrations can significantly boost engagement - students who see visual progress are three times more likely to stick around [4].
To push NRR above 100%:
A high NRR signals a "sticky" product that retains users and justifies higher valuations. Together with strong gross margins and a disciplined OpEx ratio, these KPIs demonstrate efficient scaling - critical for attracting investors and securing future funding rounds.
Once you've built a solid financial and operational foundation, the next step is to evaluate how your product resonates in the market and impacts learning outcomes. For VC-backed EdTech startups, three critical KPIs help measure this: Trial-to-Paid Conversion Rate, Institutional Revenue Mix Percentage, and Efficacy and Product-Market-Efficacy Fit Metrics. These metrics go beyond user acquisition, focusing on how effectively you convert users into paying customers while delivering measurable educational results. This set of KPIs shifts the spotlight onto market traction and outcomes.
This metric reveals how well your product communicates its value during the trial phase. In EdTech, conversion is typically measured by the number of paid seats per trial account rather than simply counting customers [1].
For individual users, a healthy conversion rate ranges between 25% and 30% [5]. For platforms targeting institutional clients, the benchmark for 2026 is 250%, meaning each trial account produces an average of 2.5 paid seats. By 2030, this target is expected to rise to 330% [1]. This reflects the potential of a single institutional trial - like one initiated by a district administrator - to result in multiple paid seats.
"Retention is also a strong indicator of product-market fit." – Vista Point Advisors [11]
To boost conversion rates, ensure trials are set up by administrators to secure high-level buy-in [1]. Create urgency by offering incentives, such as a 10% discount on annual contracts signed within 48 hours of the trial ending [1]. During the trial, set clear, time-bound goals to showcase value - like how real-time data insights can enhance student outcomes within two weeks [1]. Adding gamification features, such as badges or rewards during onboarding, can also improve engagement and conversions [1][5].
Sales strategies should prioritize multi-seat, multi-year institutional contracts [1]. This approach not only improves conversion rates but also enhances revenue quality, setting the stage for sustainable growth. The next metric focuses on income from institutional clients.
The institutional revenue mix measures the percentage of total revenue derived from large clients like K–12 districts, universities, or corporate training programs compared to smaller accounts or individual learners [1]. For VC-backed EdTech companies, a shift toward institutional clients is essential for scalability. These contracts offer better unit economics, lower service costs, and more predictable multi-year revenue streams [1].
By 2026, high-growth EdTech startups should aim for an institutional revenue mix of 600%, with projections reaching 800% by 2030 [1]. Institutional plans often start at $1,500 per month, with subscription prices expected to rise to $2,500 by 2030. One-time setup fees are typically around $2,500 [1].
This focus on institutional revenue directly supports improvements in ARPA (Average Revenue Per Account) and scalability. Targeting areas with high user density, such as specific zip codes or districts, can reduce deployment and support costs [1]. Offering premium features - like AI-powered adaptive learning tools - within institutional plans can also increase contract values [1]. These higher prices are easier to justify when you can demonstrate how features like real-time data analytics improve student outcomes [1][10].
Institutions that assess EdTech ROI across learning outcomes, operational efficiency, and financial returns report 40% higher satisfaction with their technology investments [10]. Using frameworks like the Kirkpatrick Model or Total Economic Impact (TEI) can help demonstrate value and secure renewal contracts [10]. Additionally, tracking CAC (Customer Acquisition Cost) and ARPA separately for K–12, Higher Ed, and Corporate segments can uncover the most efficient growth opportunities [1].
For EdTech startups, proving "learning ROI" is non-negotiable. Investors expect evidence that your platform genuinely enhances educational outcomes. This is crucial for maintaining strong valuations and ensuring long-term funding [9][10]. Without proof of impact, even the most polished tools risk being dismissed as just another digital product.
"Edtech key performance indicators (KPIs) are metrics that help edtech business leaders track and evaluate their progress towards their strategic goals... [and] enable edtech companies to demonstrate their impact and value proposition to their stakeholders, such as investors." – FasterCapital [9]
Key benchmarks include a 10%-15% improvement in academic performance, over 85% assignment completion rates, and a 20%-30% reduction in time-to-competency [10]. AI-powered tools often report an average ROI improvement of 35% compared to traditional platforms [10].
"Successful institutions typically see EdTech ROI ratios between 3:1 and 5:1 when implementing comprehensive measurement frameworks that capture both operational efficiencies and learning outcome improvements." – Evelyn Learning [10]
To validate efficacy, use controlled comparison groups and longitudinal studies to isolate the impact of your technology on learning outcomes [10]. Collect at least two semesters' worth of pre-implementation data to establish a baseline for ROI measurement [10]. Monitoring Daily Active Users (DAU) among institutional clients is also critical, as low engagement often signals future churn risk [1].
Third-party validation, student progression data, and evidence-based frameworks help turn efficacy claims into measurable results. For instance, showing that your platform reduces grading time by 60%-80% or significantly improves student retention demonstrates that you're not just selling software - you’re delivering outcomes [10].
Tracking KPIs effectively starts with consistency in how metrics are defined across your organization. For example, terms like "active user" must have a clear, shared meaning to ensure everyone is on the same page. Choose KPIs that align with your offerings and document the exact calculations for each one.
Equally important is having the right technical infrastructure. Tools such as Google Analytics, Mixpanel, or Amplitude can automate the data collection process and provide real-time insights into critical areas like user acquisition, retention, and conversion. Diving deeper by breaking down these metrics by product lines, customer groups, or regions can help you spot strengths and weaknesses across your business.
"By measuring and optimizing these metrics, you can identify your strengths and weaknesses, test and validate your hypotheses, and make data-driven decisions to scale your business." – FasterCapital [8]
Quantitative metrics should be paired with qualitative insights from sources like surveys, interviews, and social media. This combination offers deeper context, particularly when assessing engagement metrics such as session duration, usage frequency, and completion rates. When you also track financial KPIs alongside these engagement metrics, you gain a more complete picture of your business's overall health, laying the groundwork for expert KPI management.

Phoenix Strategy Group provides the tools and expertise to streamline KPI tracking and reporting. They specialize in building financial systems that enable accurate tracking, offering fractional CFO services for strategic guidance without the cost of a full-time hire. Their FP&A systems integrate financial models, linking revenue forecasts with operational metrics for better alignment.
Their "Monday Morning Metrics" service delivers weekly KPI reports, ensuring leadership stays informed on performance trends. Real-time data synchronization keeps dashboards up-to-date - especially crucial during fundraising when investors demand immediate insights into metrics like CAC, LTV ratios, and revenue retention. Phoenix Strategy Group also helps identify the most relevant KPIs for your specific stage and market, while their data engineering team connects systems like CRMs and learning platforms into a single, cohesive view of performance.
Set a regular reporting schedule that matches your business needs. Weekly reviews help maintain focus on short-term goals, while monthly reports provide the big-picture perspective investors expect. Dashboards should not only display current metrics but also highlight trends and deviations from targets, allowing you to address potential problems early.
Segment your data to uncover detailed insights. For instance, track Customer Acquisition Cost (CAC) and Average Revenue Per Account (ARPA) separately for customer groups like K–12, Higher Ed, or Corporate clients. Calculate your Customer Retention Rate (CRR) by dividing the number of customers at the end of a period by the number at the start. Monitor your LTV/CAC ratio to gauge sustainability, and break Monthly Recurring Revenue (MRR) into categories like New, Expansion, Contraction, and Churn to see how your revenue streams are shifting [8].
Finally, blend quantitative data with qualitative feedback. Use surveys, ratings, interviews, and social media to understand not just what is happening in your business but also why it’s happening. This comprehensive approach helps you pinpoint actionable steps for improvement.
The shift from "growth at all costs" to a focus on sustainable profitability has reshaped how venture capitalists assess EdTech startups. Today, key performance indicators (KPIs) must demonstrate that your business model, product value, and unit economics are built for the long haul. As one industry analysis noted:
"The days of 'growth at all costs' are over. VCs are now focused on a sustainable path to profitability" [3].
This shift isn’t just about scaling smartly - it’s about earning and keeping investor trust.
To meet these expectations, your KPI strategy should reflect both financial health and educational impact. Metrics like maintaining an LTV:CAC ratio of at least 3:1, achieving gross margins above 70%, and ensuring a 90-day retention rate of 40% or more showcase the efficiency investors now demand [3]. But numbers alone aren’t enough - measurable learning outcomes must back them up. The startups securing funding today are those that can prove their solutions genuinely help students succeed [12].
"A product that is merely 'used' is not fundable; a product that is 'loved' and 'retained' is." – Developers.dev [3]
Regularly tracking clear, actionable KPIs builds investor confidence. It starts with defining the right metrics, implementing tools to capture real-time data, and analyzing that data in ways that reveal meaningful insights. Whether you're gearing up for a Series A round or fine-tuning for profitability, this disciplined approach ensures your team stays focused and your investors stay reassured.
The EdTech space requires startups to balance purpose with profitability. As outlined in this guide, every metric - from customer acquisition costs to educational efficacy - plays a role in shaping the strategies that lead to long-term success. By choosing KPIs that align with your current stage, tracking them consistently, and using the insights to optimize, you’re not just preparing for the next fundraising round - you’re building a business that can truly make an impact on education. Robust KPI tracking isn’t just a tool; it’s a cornerstone for growth and sustainability.
At the seed stage, the most important KPIs highlight early signals of product-market fit and how users are engaging with the product. Metrics like user acquisition, retention rates, and initial revenue help gauge market interest and the potential for growth.
By the time a company reaches Series A, the focus expands to include metrics that demonstrate scalability. These include revenue growth, customer retention, gross margins, and operational efficiency (such as Customer Lifetime Value (CLV) and Customer Acquisition Cost (CAC)). Together, these figures paint a picture of sustainable growth and a clear path toward profitability.
To show the impact of learning in a way that resonates with investors, you need to rely on frameworks that evaluate key learning outcomes. This includes metrics like student performance, skill acquisition, retention rates, and graduation rates. Pair these with operational and financial data - such as revenue growth and customer retention - to highlight both educational success and business viability. Investors are drawn to data that clearly demonstrates measurable benefits, efficiency, and the potential for growth over time.
The fastest way to set up dependable KPI dashboards is by leveraging automated data integration and tools that support real-time updates. Opt for platforms like Power BI, Tableau, or Google Data Studio - these can connect seamlessly to various data sources. By integrating systems like your product database, CRM, and financial tools, you’ll ensure consistent data flow, cut down on manual work, and gain real-time insights to improve decision-making and streamline communication.