Published on
April 2, 2026


Unit economics is about understanding whether your business profits from each customer. The two key metrics are Lifetime Value (LTV) - the total profit a customer brings - and Customer Acquisition Cost (CAC) - the cost to acquire them. A healthy LTV:CAC ratio is 3:1 or higher, meaning you earn at least $3 for every $1 spent acquiring a customer. If your ratio is below this, you're losing money with each customer.
To improve:
Understanding and balancing these metrics ensures growth without burning cash.
Getting the Lifetime Value (LTV) right is essential for balancing customer value with acquisition costs, especially for growth-stage companies.
Lifetime Value (LTV) represents the total gross profit a customer generates after subtracting direct costs like hosting, customer support, and implementation. As one analysis explains:
"LTV is not revenue - it is the gross profit generated after deducting the direct costs of serving the customer (hosting, customer success, implementation, and support)."[1]
Key factors that influence LTV include Average Revenue Per User (ARPU) or Monthly Recurring Revenue (MRR), customer lifespan (how long someone remains a customer), churn rate (the percentage of customers who leave), and gross margin (revenue minus the cost of goods sold). For non-subscription businesses, metrics like purchase frequency and Average Order Value (AOV) replace recurring revenue figures. Advanced models might even include referral value - revenue brought in by customers who refer others.
The right formula depends on your business model. Here’s how it breaks down:
One major mistake is confusing revenue with gross profit. For example, a company with 40% gross margins will have half the LTV of a competitor with 80% margins, even if their Average Contract Value is the same.[1] Misjudging LTV this way can lead to overspending on customer acquisition, under the false impression that higher Customer Acquisition Costs (CAC) are sustainable.
Another frequent error is underestimating churn’s impact. Since churn is the denominator in LTV formulas, even small miscalculations can throw off results. For instance, reducing annual churn from 20% to 10% doubles LTV for the same revenue per customer.[1] A 5% improvement in annual churn - from 15% to 10% - for a customer with a $24,000 annual contract value and 70% margins increases LTV from $112,000 to $168,000, a 50% jump.[1]
Lastly, growth-stage companies often make the mistake of relying on outdated estimates. While early-stage startups might use projected retention rates, companies at Series A and beyond should work with actual cohort data from at least 30+ customers. Failing to update calculations with real-world data can lead to poor decisions in pricing, sales strategies, and expansion plans.
Once LTV is nailed down and these common pitfalls are avoided, the next step is calculating CAC to complete the unit economics picture.
Understanding how to calculate Customer Acquisition Cost (CAC) is crucial for evaluating whether your growth strategies are sustainable or if you're overspending to gain new customers.
Customer Acquisition Cost (CAC) reflects the total cost of acquiring one new customer. It’s a key metric for assessing the efficiency of your marketing and sales efforts. To calculate it, you divide your total acquisition expenses by the number of new customers gained. This metric helps you understand whether your growth is profitable or just depleting resources. As Brian Balfour aptly points out:
"Average CAC is almost always useless." [3]
Blended CAC - calculated by dividing total spend by all new customers - can be misleading. It often hides the real cost of paid channels, making paid acquisition appear 40% to 60% cheaper than it actually is.[4] For growth-stage companies, it’s smarter to separate paid CAC (focusing solely on paid channel costs and their associated customers) from blended CAC. Paid CAC should guide scaling decisions, while blended CAC is more appropriate for high-level reporting to stakeholders.[4]
The formula itself is straightforward: divide total sales and marketing expenses by the number of new customers acquired. However, the complexity lies in determining which costs to include.
A complete CAC calculation should account for all relevant expenses, such as marketing and sales team salaries, commissions, software tools, agency fees, and even R&D costs tied to customer acquisition. For Product-Led Growth (PLG) companies, R&D costs related to acquisition must be factored in as well.
A common error is basing CAC thresholds on gross margin, which overlooks variable costs like fulfillment, shipping surcharges, payment processing fees, and returns. Instead, use Contribution Margin 2 (CM2) - gross margin minus those variable costs - as the benchmark. Saras Analytics explains:
"If you are using gross margin to set your CAC threshold, you are overspending on every customer you acquire." [4]
For instance, if your gross margin is 70% but drops to 50% when CM2 is applied, your CAC must stay below that 50% mark to ensure profitability. Additionally, monitor the CAC payback period. Top-performing SaaS companies typically recover their CAC within 5–7 months, with anything under 12 months considered healthy.[5]
Reducing CAC while maintaining growth requires fine-tuning your strategies across different areas like channels, targeting, and sales processes. Start by breaking down CAC by customer type (e.g., Enterprise vs. SMB), acquisition channel (e.g., paid ads, referrals, content marketing), and geography. This segmentation helps identify profitable segments and areas that need improvement.[3]
Organic channels, such as SEO, content marketing, and referrals, often deliver lower CAC over time, though they require upfront investment. Paid channels, on the other hand, can yield faster results but often face rising marginal CAC as high-intent audiences become saturated.[4] If your marginal CAC is increasing while Average Order Value (AOV) remains flat or declines, it’s a sign of audience saturation.[4]
Improving sales efficiency is another way to cut CAC. This can involve better lead qualification, shorter sales cycles, and higher conversion rates. Companies that combine low CAC with high Net Dollar Retention (NDR) achieve median growth rates of 200%, compared to just 35% for those struggling with these metrics.[2] Additionally, recalculating CAC monthly ensures you stay on top of fluctuating costs like shipping rates, returns, and audience saturation.[4]
As Saras Analytics puts it:
"LTV is a promise. Payback period is what your bank account actually experiences." [4]
The next step is to explore how CAC interacts with Lifetime Value (LTV) through the LTV:CAC ratio.
LTV:CAC Ratio Benchmarks and Business Health Indicators
The LTV:CAC ratio helps determine whether your business model generates value or destroys it. By directly linking customer acquisition costs to profitability, this metric shows how much lifetime value you create for every dollar spent on acquiring a customer. For companies in the growth stage, this ratio is a critical indicator of whether scaling revenue will lead to a sustainable business or simply burn through capital faster [1].
At its core, the LTV:CAC ratio calculates the lifetime profit earned for each dollar spent on acquiring a customer. For instance, if you spend $100 to acquire a customer who generates $300 in lifetime gross profit, your ratio is 3:1. This metric is particularly important for Series B investors assessing whether your business model can sustain long-term growth [1].
Unlike basic revenue metrics, the LTV:CAC ratio factors in gross margin rather than just revenue. For example, a company with 40% margins must spend far less on acquisition to maintain a healthy ratio compared to a company with 80% margins. This difference explains why SaaS companies, which generally have low variable costs, can afford higher acquisition spending compared to industries like e-commerce or AI applications, which often face significant fulfillment or operational costs [1].
To gauge your business health, compare your ratio against established benchmarks.
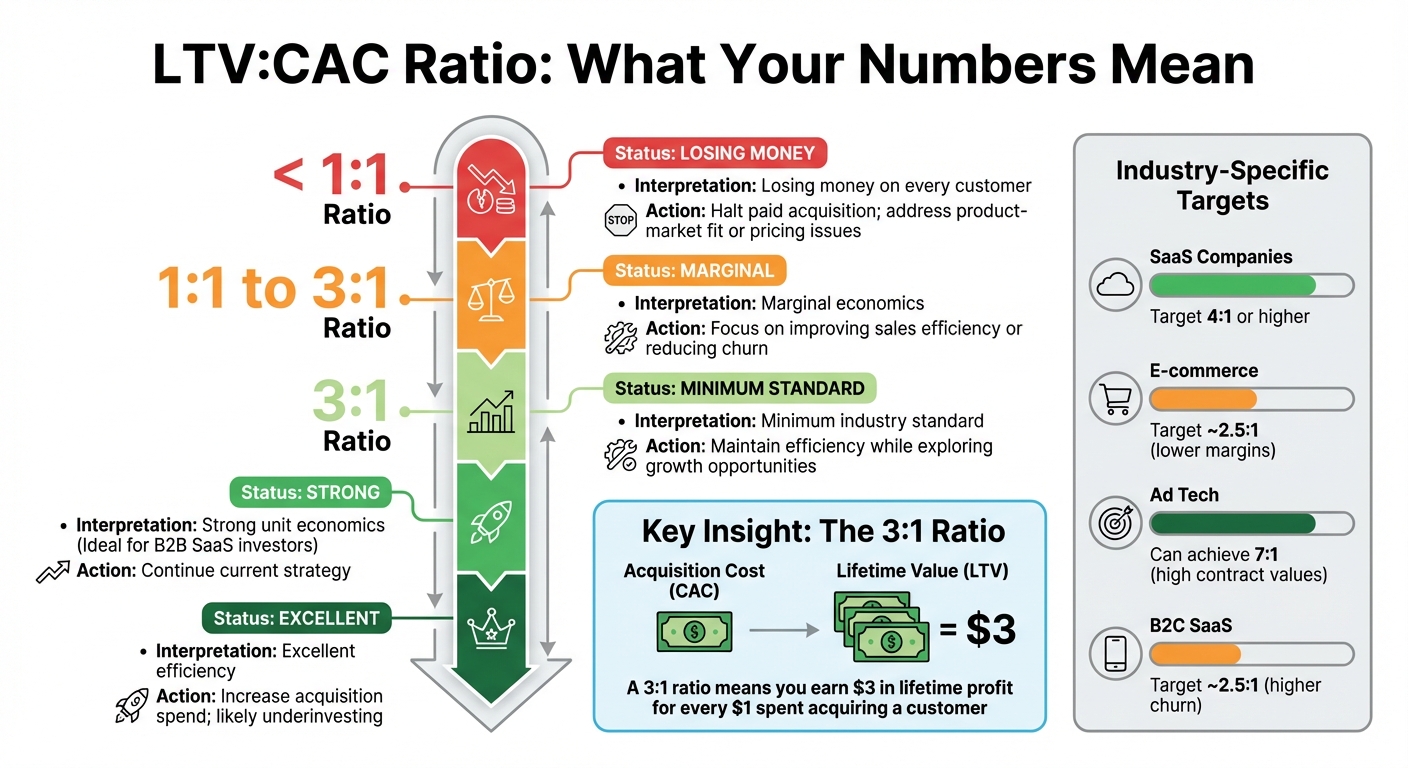
A commonly accepted benchmark for a healthy business model is a ratio of 3:1 [1]. Ratios below this threshold indicate that acquiring customers is destroying value, while a ratio above 5:1 might suggest you're being overly cautious and could invest more aggressively in sales and marketing to capture additional market share [1].
| Ratio Range | Interpretation | Recommended Action |
|---|---|---|
| < 1:1 | Losing money on every customer | Halt paid acquisition; address product-market fit or pricing issues [6] |
| 1:1 to 3:1 | Marginal economics | Focus on improving sales efficiency or reducing churn [6] |
| 3:1 | Minimum industry standard | Maintain efficiency while exploring growth opportunities [1][6] |
| 4:1 | Strong unit economics | Ideal for B2B SaaS investors [6] |
| > 5:1 | Excellent efficiency | Increase acquisition spend; likely underinvesting [1][6] |
Different industries and business models target varying ratios depending on their gross margins. For example, SaaS companies often aim for a 4:1 ratio or higher, while e-commerce businesses with lower margins typically target closer to 2.5:1. Ad tech companies, which often have high contract values and sticky integrations, can achieve ratios as high as 7:1. Meanwhile, B2C SaaS companies with higher churn rates generally land around 2.5:1 [1][6].
These benchmarks can guide you on where to focus your efforts for improvement.
To improve your LTV:CAC ratio, you can either increase the lifetime value of your customers (LTV) or lower your customer acquisition costs (CAC). Reducing churn is one of the most effective ways to boost LTV - even a small 2% reduction in monthly churn can lead to a 40–70% increase in LTV [6].
To increase LTV, consider moving upmarket to secure higher Average Contract Values (ACV), expanding your product offerings, or creating deeper integrations to encourage retention [1]. You can also implement usage-based pricing or upsell premium tiers to drive additional revenue from existing customers without needing to acquire new ones [6].
On the flip side, lowering CAC involves improving sales efficiency. This can be achieved by refining lead qualification processes, investing in cost-effective channels like content marketing and SEO, or narrowing your focus to your Ideal Customer Profile (ICP) [6].
The best approach depends on your specific business challenges. If you struggle with high churn, prioritize retention strategies. If your ratio exceeds 5:1, consider scaling up acquisition efforts to capture more market share.
Balancing LTV (Lifetime Value) and CAC (Customer Acquisition Cost) is all about fine-tuning the right elements based on where your business is and what you're aiming to achieve. Strong unit economics aren't just nice to have - they can be a game-changer. Companies with solid ratios are 2.5x more likely to secure follow-up funding rounds[7].
Think of unit economics as your strategic guide instead of just numbers on a spreadsheet[7][10]. If your ratio is off, you're essentially losing money with every customer. Keeping these metrics in check is crucial for sustainable growth. Below, we’ll explore specific ways to boost LTV and cut CAC.
The first step to increasing LTV is to maximize the value you provide to your customers. One effective tactic is value-based pricing, where you align your pricing model with how customers perceive the value of your product. Businesses that adopt this approach tend to grow 10-15% faster than those that don’t[7].
Take Slack, for example. They discovered that enterprise clients had an LTV that was 5-7x higher than smaller businesses. By introducing enterprise-specific pricing plans with advanced features, they successfully increased their overall LTV[7].
Customer segmentation is another powerful tool. B2B companies that use segment-based pricing often achieve 30-50% higher LTV compared to those with a one-size-fits-all strategy[7]. A great example is Adobe, which analyzed customer usage patterns during its shift to a subscription model. This allowed them to optimize their Creative Cloud tiers to better fit customer needs, boosting LTV[7].
Expansion revenue - through upselling, cross-selling, and add-on services - can also drive growth without the high costs of acquiring new customers[8][10]. HubSpot has mastered this by continuously analyzing its unit economics, enabling them to raise their Average Revenue Per User (ARPU) by over 40% while maintaining growth[7].
Efficiency improvements can also play a role. Enhancing customer support or automating processes can reduce the cost of serving each customer, which positively impacts the gross margin used in LTV calculations[8][9]. Even small gains in retention rates can significantly lengthen customer lifetimes and increase overall LTV[8].
On the flip side, reducing CAC is just as important. Lower acquisition costs improve cash flow and free up resources for reinvestment. One of the quickest ways to achieve this is by shortening your payback period. Aim for a CAC payback period of less than 12 months for better cash efficiency[7][8]. In SaaS, a typical target is 12–18 months[7][8].
"Your CAC payback period is directly linked to your cash efficiency and runway. The shorter your payback period, the more flexibility you have to reinvest in growth."
- Patrick Campbell, CEO, ProfitWell[7]
Refining your marketing and sales targeting is another effective strategy. Focus on channels and customer segments that have historically shown higher LTV[8][9]. Additionally, keeping an eye on support costs relative to revenue can help you identify areas where your unit economics are underperforming[8].
Automation is another key lever. Automating parts of your sales process - like lead qualification or follow-ups - reduces the need for human involvement, cutting costs and allowing your team to concentrate on high-value opportunities[9].
If your unit economics are out of balance, you’ll need to recalibrate. The right focus depends on your current challenges. For example, if churn is high, boosting LTV should be your top priority. On the other hand, if your unit economics are already strong, reducing CAC can help you scale faster.
Here’s a quick breakdown of strategies:
| Strategy | Focus Area | Primary Benefit | Potential Trade-off |
|---|---|---|---|
| LTV Optimization | Retention, Pricing, Upselling | Increases long-term profitability and stability | May require significant investment in product or customer success |
| CAC Reduction | Marketing Efficiency, Automation | Improves short-term cash flow and payback | Could slow top-of-funnel growth if key channels are cut |
"The most successful SaaS companies continuously monitor their unit economics and adjust their growth strategies accordingly."
- David Skok, Partner, Matrix Partners[7]
Your cash position and runway should guide your decision. If you’re burning through capital, reducing CAC can provide immediate relief. If you have a solid runway but face retention issues, working on LTV will build a more stable foundation. Many companies find that addressing both areas - adjusting the focus quarterly based on performance - leads to the best results over time.
Understanding unit economics goes beyond crunching numbers in a spreadsheet. Phoenix Strategy Group partners with growth-stage companies to create financial systems that track LTV (Lifetime Value) and CAC (Customer Acquisition Cost) in real time. They combine bookkeeping, FP&A (Financial Planning & Analysis), and data engineering into a seamless framework. Using cohort-based retention analysis, they ensure LTV projections are grounded in actual customer behavior, not just assumptions[11]. This approach delivers actionable financial insights.
A common mistake many companies make is underestimating CAC by only considering direct performance marketing expenses. Phoenix Strategy Group uses fully loaded CAC attribution, factoring in salaries, tools, agencies, and overhead, to provide a complete picture of acquisition costs[11][7]. They also analyze metrics by acquisition channel and customer tier, helping identify scenarios where efficient organic channels might mask underperforming paid ones[11][7].
Phoenix Strategy Group's financial modeling tools go beyond static reports. Their Integrated Financial Model employs CAC Yield Modeling, which calculates monthly revenue as a percentage of Cohort CAC (CCAC). This gives businesses a clear ROI perspective across different pricing models[12].
They also use simulators and impact tables to explore how variables like churn, gross margin, or ARPU (Average Revenue Per User) influence long-term stability. Their payback period forecasting ensures that acquisition costs are recovered within target timelines, enabling data-driven strategic planning[11][7].
Phoenix Strategy Group offers fractional CFO and M&A advisory services to help businesses scale while maintaining a 3:1 LTV:CAC ratio[11][7]. Their expertise supports the development of financial models that are crucial for fundraising, as companies with strong unit economics are 2.5x more likely to secure follow-up funding rounds[7].
Whether you're gearing up for a funding round or planning an exit, Phoenix Strategy Group provides the tools and guidance to keep your unit economics aligned. Their systems integrate seamlessly with your operations, offering weekly KPIs and real-time data synchronization. This ensures you can make informed decisions without waiting for end-of-month reports.
Unit economics is all about understanding profitability at the customer level. It compares Lifetime Value (LTV) - the total revenue a customer generates over their lifetime - with Customer Acquisition Cost (CAC) - the expense of bringing that customer on board. A strong LTV:CAC ratio is 3:1 or higher, which means every dollar spent on acquiring a customer brings in at least three dollars in revenue. This balance is critical for sustainable growth, maintaining healthy cash flow, and appealing to investors. On the other hand, a ratio below 1:1 indicates a loss on each customer, which can be a red flag for the business.
Now that you’ve got a handle on the basics, here’s how to apply them:
Start by calculating your LTV and CAC. Use the following formulas:
For example, let’s say your monthly Average Revenue Per Account (ARPA) is $100, with a gross margin of 80%, and a churn rate of 5%. Your LTV would be:
($100 × 0.8) / 0.05 = $1,600
If your CAC is $400, your LTV:CAC ratio would be 4:1 - a solid indicator of profitability.
If your ratio falls short of the 3:1 benchmark, focus on two key areas:
Dive deeper into customer cohorts and acquisition channels to uncover opportunities for improving profitability. The goal? Achieve a minimum 3:1 LTV:CAC ratio and ensure your CAC payback period is under 12 months.
For more personalized support, consider working with Phoenix Strategy Group. They offer services like unit economics audits, financial modeling, and FP&A assistance tailored for growth-stage businesses. With their expertise, you can create scalable financial models, prepare for fundraising, and make smarter investment decisions.
You should use contribution margin instead of gross margin when calculating LTV and CAC. Why? Contribution margin factors in profitability after deducting variable costs, giving you a clearer picture of your unit economics and growth potential. It’s a more precise way to evaluate your business's financial health and scalability.
Paid CAC focuses specifically on the efficiency of your paid marketing efforts, such as ads or sponsored content. By isolating these costs, you can fine-tune and improve the performance of individual paid channels with precision.
On the other hand, Blended CAC takes into account both paid and organic acquisition costs. This metric provides a more comprehensive view of how efficiently you're acquiring customers across all channels combined.
Here’s how they differ in application:
Striking the right balance between these two metrics is key to ensuring sustainable growth while keeping your customer acquisition aligned with long-term value (LTV) goals.
A "good" payback period varies based on your growth strategy and cash flow priorities. For SaaS businesses or companies in the growth stage, a timeframe of 12 to 18 months is often considered a healthy balance. It reflects efficient customer acquisition while maintaining steady cash flow.
If your goal is to recover cash quickly, a shorter payback period (under 12 months) might be ideal. On the other hand, a longer payback period can still make sense if your customers have a high lifetime value (LTV), as this supports sustained growth over time.
Ultimately, your target payback period should align with your industry standards, current growth stage, and overall financial objectives.