Published on
April 16, 2026


Unit economics is the key to scaling SaaS businesses efficiently. It breaks down revenue and costs per customer, helping you measure profitability and growth potential. For SaaS, the most critical metrics include:
By tracking these metrics, SaaS companies can avoid hidden inefficiencies, improve financial health, and attract investors. For example, a $500 CAC and $1,800 LTV yield a 3.6:1 ratio, indicating sustainable growth. However, exceeding 5:1 may signal under-investment in customer acquisition.
Key Industry Benchmarks (2025 Data):
For success, focus on reducing churn, improving ARPU, and maintaining gross margins above 70%. These metrics are not just numbers - they guide decisions on spending, growth, and profitability.
Grasping these core metrics is essential for evaluating SaaS unit economics and ensuring sustainable growth.
CAC calculates the total sales and marketing expenses divided by the number of new customers gained during the same period. This includes everything - sales team salaries, ad spend on platforms like Google Ads, tools like HubSpot or Salesforce, commissions, and event costs.
For example, if your SaaS business spends $100,000 on sales and marketing in Q1 and acquires 200 customers, your CAC is $500 per customer. This figure helps assess whether your acquisition strategy is cost-effective or draining resources. For growth-stage companies, a CAC under $400 for mid-market SaaS is considered a healthy benchmark.
A common mistake is overlooking deferred costs like content marketing amortization or failing to account for the ramp-up period for new sales hires, which can skew CAC by 20-30%. Tracking CAC monthly and segmenting it by acquisition channel - such as paid versus organic - can reveal which methods provide the best return. Additionally, accurate customer value tracking depends on precise LTV calculations.
LTV estimates the total revenue a single customer generates over their relationship with your business. The standard formula is: (Average Revenue Per User × Gross Margin) / Churn Rate. Alternatively, you can calculate it as ARPU × Customer Lifetime, where customer lifetime is 1 divided by churn rate.
For instance, if your SaaS business has a $100 monthly ARPU, an 80% gross margin, and a 5% monthly churn rate, your LTV would be ($100 × 0.8) / 0.05 = $1,600. Gross margin, which is revenue minus costs like hosting and support, is crucial because it reflects true profitability. Margins below 70% can significantly lower LTV, even with high ARPU.
To improve forecasting, update LTV calculations quarterly using cohort analysis instead of aggregate data. Breaking down LTV by customer tier can provide more precise insights for planning growth and managing cash flow. Balancing LTV with CAC is key to establishing a solid LTV:CAC ratio.
A strong LTV:CAC ratio is 3:1 or higher, meaning the lifetime value of a customer should be at least three times the cost to acquire them. This ratio ensures you recover acquisition costs, handle upfront losses, and still have funds to fuel growth. Falling below 3:1 can lead to cash flow issues, while top-performing SaaS companies often achieve ratios of 5:1 or more.
For example, if your LTV is $1,800 and your CAC is $500, your ratio is 3.6:1 - indicating a sustainable path for growth. This ratio also aligns with a 1-2 year payback period, leaving room to reinvest in scaling efforts.
Other key metrics to monitor include:
High churn can drastically reduce LTV by shortening customer lifetimes, while a long payback period can undermine the viability of your LTV:CAC ratio. For instance, a $400 CAC paired with a $50 monthly net ARPU results in an 8-month payback period, which supports sustainable scaling efforts.
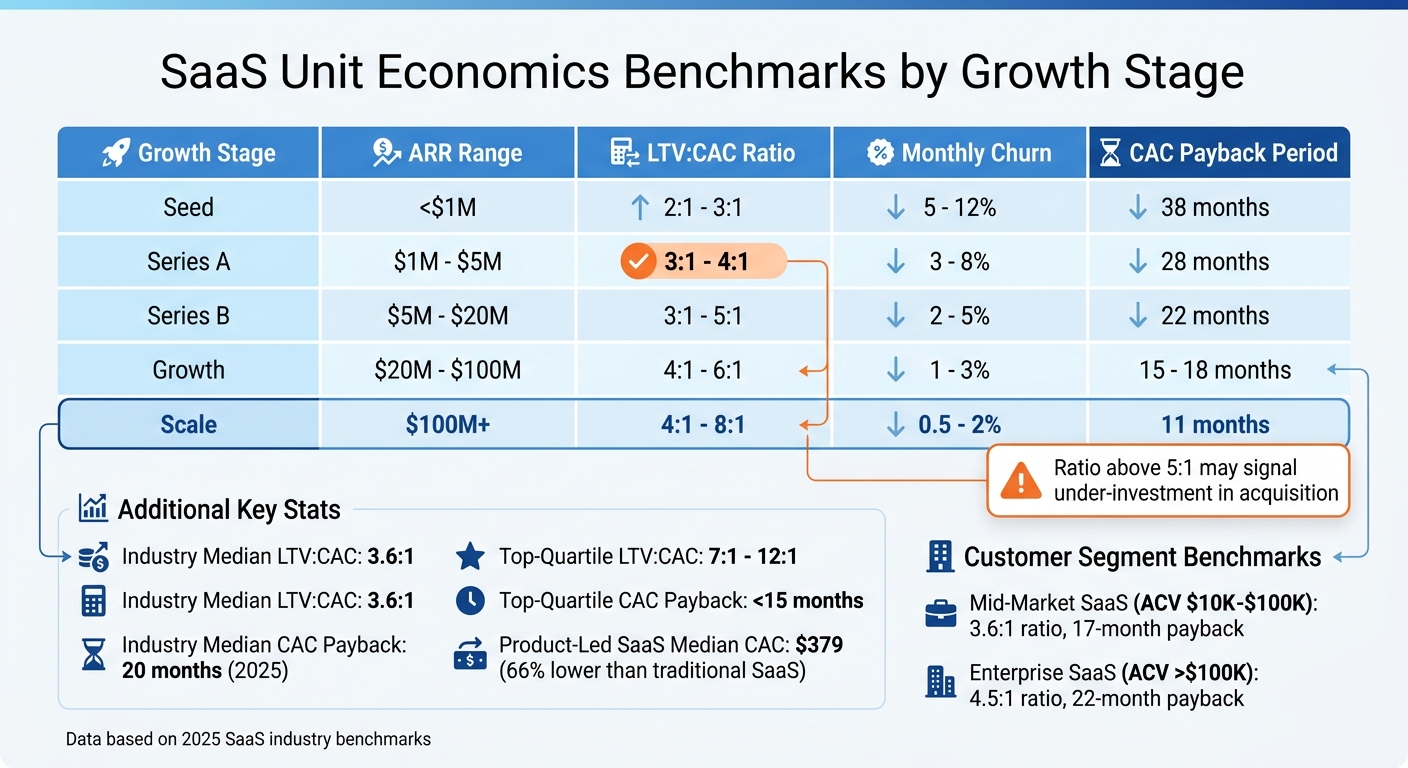
SaaS Unit Economics Benchmarks by Growth Stage: LTV:CAC, Churn & Payback Periods
Understanding industry benchmarks can help you evaluate where your SaaS unit economics currently stand and identify areas for improvement. Across the SaaS industry, the median LTV:CAC ratio is 3.6:1, while the median CAC payback period has improved to 20 months in 2025, down from 22 months in 2024 [2]. However, these benchmarks can vary significantly depending on the growth stage and customer segment.
For early-stage SaaS companies, the numbers can be particularly telling. About 38% of these businesses fail to meet the 3:1 LTV:CAC ratio, a critical metric for long-term success [3]. Falling below this threshold often signals financial inefficiencies [3]. Additionally, the median CAC across all SaaS verticals is $702, though this figure fluctuates depending on the specific vertical and go-to-market strategies [3]. Below, we'll dive into benchmarks segmented by growth stage and customer type to provide actionable insights for scaling your business effectively.
Your company's ARR (Annual Recurring Revenue) and maturity level should guide your target benchmarks. For instance, growth-stage companies with ARR between $20 million and $100 million often aim for an LTV:CAC ratio between 4:1 and 6:1, coupled with a monthly churn rate of 1% to 3% [1].
| ARR Range | LTV:CAC Ratio | Monthly Churn | CAC Payback (Median) |
|---|---|---|---|
| Seed (<$1M) | 2:1 - 3:1 | 5 - 12% | 38 months |
| Series A ($1M - $5M) | 3:1 - 4:1 | 3 - 8% | 28 months |
| Series B ($5M - $20M) | 3:1 - 5:1 | 2 - 5% | 22 months |
| Growth ($20M - $100M) | 4:1 - 6:1 | 1 - 3% | 15 - 18 months |
| Scale ($100M+) | 4:1 - 8:1 | 0.5 - 2% | 11 months |
These benchmarks emphasize the importance of tailoring your strategy based on your ARR range and customer base. For example, mid-market SaaS companies (with ACV between $10,000 and $100,000) typically achieve a median LTV:CAC ratio of 3.6:1 and a 17-month payback period. On the other hand, enterprise-level companies (ACV exceeding $100,000) often reach a 4.5:1 ratio with a 22-month payback [2]. Product-led SaaS businesses enjoy a significant advantage, with a median CAC of $379 - 66% lower than the $1,120 median for other SaaS models [3]. Comparing your metrics against these benchmarks can help pinpoint areas for adjustment.
Top-quartile SaaS companies achieve LTV:CAC ratios between 7:1 and 12:1, with CAC payback periods under 15 months [2][3]. For companies with ARR between $50 million and $100 million, top performers can reduce their payback period to just 8 months, compared to the median of 15 months [3].
Another key differentiator is Net Revenue Retention (NRR). Top-quartile companies boast NRR of 122% or higher, with the very best exceeding 130% [3]. Companies achieving 130%+ NRR often secure valuation multiples of 20–30× ARR, compared to 6–10× for those below 110% [3]. This metric highlights the compounding value of retaining and expanding revenue from existing customers, as they typically contribute more revenue in subsequent years.
However, it's worth noting that an LTV:CAC ratio above 5:1 isn't always a good sign. According to the SaaStr Annual Benchmark 2025:
A ratio above 5:1 signals under-investment in acquisition relative to available market, not excellence [3].
If your metrics significantly exceed benchmarks, it could indicate missed opportunities to capture additional market share. Balancing top-quartile performance with industry averages can help ensure you're making the right investments for sustainable growth and profitability.
When it comes to understanding profitability, break-even analysis takes the insights from unit economics and zeroes in on when acquiring a customer starts to pay off. For many startups, navigating these complex financial models is a core benefit of fractional CFO services.
For SaaS companies, this is typically measured using the Customer Acquisition Cost (CAC) Payback Period. This metric tells you how many months it takes to recover the cost of acquiring a customer through the revenue they bring in [5]. In other words, it's the point when a customer begins to generate profit.
Here’s a general guideline for CAC payback periods based on company size:
Customer segmentation also plays a role here. For instance, B2B Enterprise SaaS companies often hit payback within 18 months, thanks to longer contracts and stronger retention rates. Meanwhile, B2B SMBs aim for payback in under 12 months, as they tend to face higher customer turnover [5].
Profitability can also be evaluated through metrics like:
Aiming for a Lifetime Value to Customer Acquisition Cost (LTV:CAC) ratio of at least 3:1 is a proven way to speed up profitability [5]. To achieve this, focus on:
Phoenix Strategy Group takes the unit economics benchmarks discussed earlier and transforms them into actionable strategies through focused FP&A and data engineering. Their goal? To turn raw data into meaningful growth opportunities.
Phoenix Strategy Group enables SaaS companies to dig deeper into their metrics, focusing on the numbers that truly matter for growth. Their FP&A team tailors metric optimization to your company’s growth stage, ensuring attention is placed on actionable indicators like conversion rates and Customer Acquisition Cost (CAC) rather than irrelevant data points [6].
Scaling too soon can wreak havoc on unit economics. In fact, around 70% of startups fail because they scale prematurely, often before their unit economics are sound [7]. Phoenix Strategy Group’s cohort analyses help identify the root causes of customer churn, addressing critical issues early [6].
Their data engineering services are designed to integrate seamlessly with your current systems. This allows for real-time synchronization of financial data, enabling you to track key metrics such as LTV:CAC and Net Dollar Retention. With these insights at your fingertips, you can make informed decisions about resource allocation, pricing strategies, and marketing investments - all essential for improving unit economics [6].
While refining operational metrics is vital, managing cash flow and preparing for strategic moves like mergers or acquisitions are equally important for long-term success.
Even the strongest unit economics won’t matter if your cash reserves run dry before you hit profitability. To prevent this, Phoenix Strategy Group employs 13-week cash flow forecasts, providing visibility into capital trends and helping anticipate financial fluctuations [6]. This proactive approach ensures a balance between growth investments and efficient CAC payback.
For companies eyeing acquisitions or IPOs, Phoenix Strategy Group aligns GAAP-compliant reporting with broader growth goals. This alignment highlights strengths such as high returns on invested capital and robust Net Dollar Retention, making your business more appealing to investors or potential buyers [6]. Their M&A advisory services further ensure that your unit economics present a compelling case to stakeholders [6].
For SaaS companies in their growth stage, tracking unit economics isn’t just a nice-to-have - it’s the backbone of scaling sustainably. By keeping a close eye on these metrics, businesses can pinpoint inefficiencies early and align their strategies with long-term goals. As Jørgen Wibe aptly put it:
In 2026, durability - not velocity - is the ultimate growth benchmark for SaaS companies [4].
Prioritizing capital efficiency demands that founders rely on solid data rather than wishful thinking. Key metrics like maintaining a 3:1 LTV:CAC ratio (or aiming for the elite 4:1), achieving net revenue retention above 110%, and understanding revenue streams are not just numbers - they’re tools for making smarter, proactive decisions. These insights also boost investor confidence, especially during critical stages like Series A funding [4].
With expertise in FP&A, data engineering, and cash flow forecasting, Phoenix Strategy Group helps SaaS companies go beyond tracking metrics - they help optimize them. Whether you’re gearing up for fundraising, planning an acquisition, or building a stronger, more resilient business, aligning your unit economics with industry standards sets the stage for sustainable growth. In the competitive SaaS world of 2026, the companies that prioritize efficiency and adapt quickly will come out ahead.
To calculate LTV (Lifetime Value) when churn rates change, you need to tweak the basic formula: LTV = ARPU / churn rate. Instead of using a static churn rate, update it to reflect current or projected values.
If churn fluctuates, try segmenting customers or time periods. Then, calculate a weighted average churn rate based on these segments. This method helps your LTV calculation stay aligned with retention patterns and provides a more accurate picture over time.
An LTV:CAC ratio greater than 5:1 can actually be a red flag. While it may seem like a strong indicator of profitability, it could point to underinvestment in growth. This might mean the business is missing out on opportunities to scale and expand effectively.
Improving marketing and sales efficiency is the fastest way to shorten CAC payback while keeping growth on track. To achieve this, concentrate on optimizing acquisition channels, simplifying sales workflows, encouraging referrals, and strengthening customer retention. These approaches not only help control costs but also support steady revenue growth.