Published on
May 28, 2026


When running a subscription business, tracking the right metrics is essential to understand growth, retention, and profitability. Here's a quick summary of the 9 key metrics you need to monitor:
These metrics help you identify revenue trends, assess customer retention, and ensure growth strategies are financially sound. Use this list to build a consistent reporting process, prioritize improvements, and align your business for long-term success.

This checklist is designed to help you track nine key metrics every month. Following it consistently ensures you're staying on top of the numbers that matter most for your subscription business.
Grouping your metrics into categories simplifies reporting and helps teams focus on the areas that drive results. Here's a straightforward three-category framework that works well for most subscription models:
| Category | Metrics Included | Purpose |
|---|---|---|
| Revenue | MRR, ARR, NRR, ARPU | Measures overall growth and expansion efficiency |
| Customer | Churn Rate, Retention Rate, Trial Conversion | Reflects customer satisfaction and product-market fit |
| Efficiency | CAC, LTV:CAC, Payback Period | Evaluates the sustainability and ROI of your growth efforts |
This layered approach makes it easier to diagnose issues. Start with revenue metrics (like MRR and ARR) to gauge performance, then look at customer metrics (such as churn and retention) to understand why changes are happening. Finally, efficiency metrics (like CAC and LTV:CAC) reveal whether your growth strategy is paying off [2].
"I see a lot of people fail in subscription businesses by spending a lot of time on how to drive down acquisition costs, but not a lot of time on how to increase lifetime value." - Mike Salguero, Founder, ButcherBox [4]
Once you've organized your metrics, set a schedule to review them regularly. This ensures you're catching problems early and making data-driven decisions.
Not all metrics need the same level of attention. Revenue metrics like MRR and ARR should be reviewed monthly - they're critical indicators of growth and are often included in board and management reports [7]. On the other hand, customer retention and efficiency metrics (such as CAC and LTV:CAC) are better suited for quarterly reviews, as it takes time for customer data to reveal trends [7].
To stay ahead of issues, use automated dashboards that refresh daily. These can help you quickly spot churn spikes or cash collection problems [6]. As your business grows, consider monitoring high-impact metrics like churn and MRR movement on a weekly basis [5]. Assigning ownership of this process - typically to Fractional CFO services or Revenue Operations - ensures consistency in how metrics are defined and tracked as your business evolves [6]. This accountability is key to uncovering actionable insights.
| Review Frequency | Metrics to Cover |
|---|---|
| Daily / Weekly | Churn alerts, MRR movement, cash collections |
| Monthly | MRR, ARR, Logo Retention, Churn Rate |
| Quarterly | NRR, GRR, CAC, LTV:CAC, Cohort Analysis |
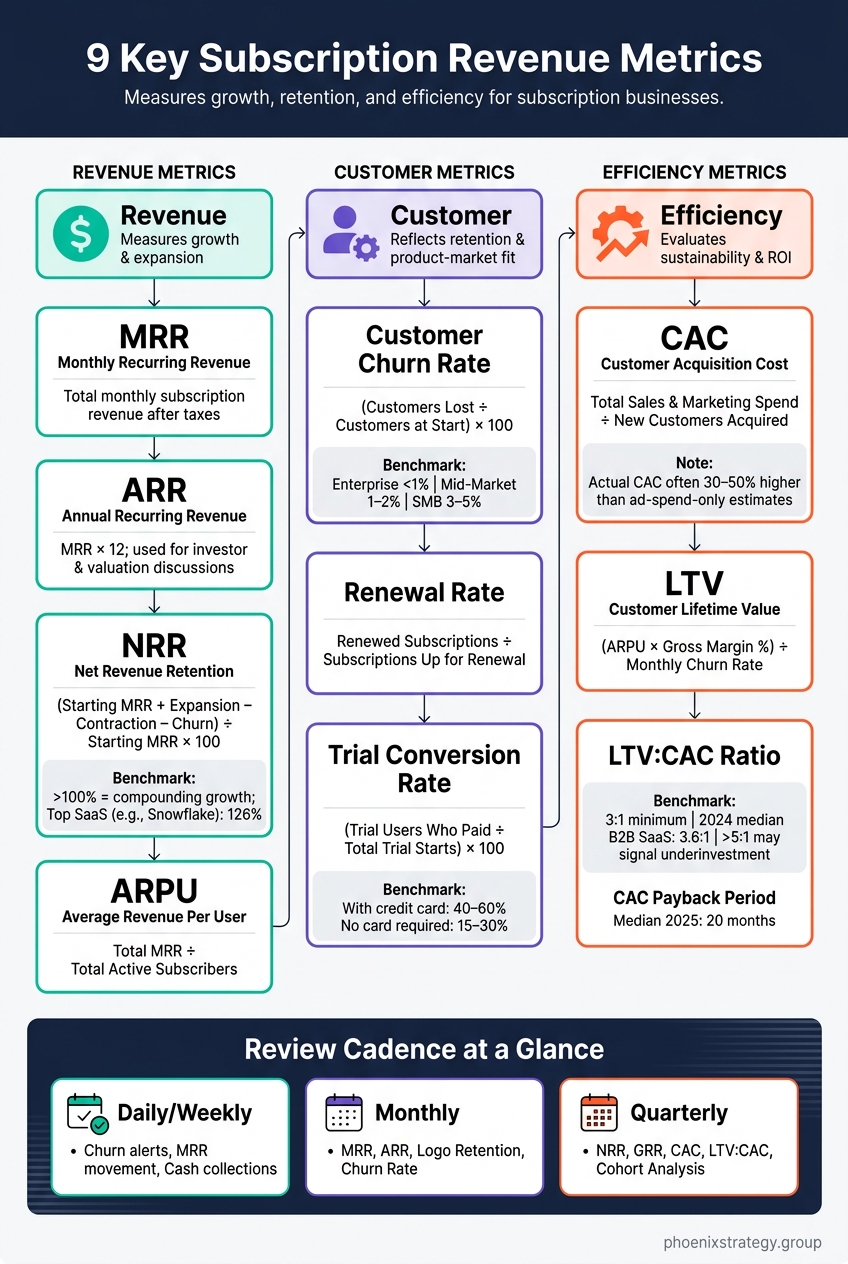
9 Key Subscription Metrics: Categories, Formulas & Benchmarks
"SaaS metrics are a chain, not a checklist. MRR and ARR show you what your revenue is. LTV and CAC show you whether acquiring that revenue is sustainable." - The SaaS Library [3]
Here are nine essential metrics for evaluating subscription revenue performance. Each one plays a unique role in understanding growth, retention, and sustainability.
MRR represents the total monthly subscription revenue after taxes, excluding any one-time fees.
Breaking MRR into categories can provide deeper insights into growth patterns. These categories include:
This breakdown helps identify whether growth is genuine or simply masking customer churn issues [2].
ARR, calculated as MRR × 12, provides a yearly view of predictable revenue.
ARR is a critical metric for long-term planning, investor discussions, and company valuations [3]. It’s particularly useful when modeling growth scenarios or preparing for funding conversations. ARR helps you anchor discussions and evaluate performance over time.
Customer churn rate measures the percentage of customers lost during a specific period:
Churn Rate = (Customers lost ÷ Customers at start of period) × 100
Benchmarks for churn vary by market segment: enterprise (under 1%), mid-market (1–2%), and SMB (3–5%) [2]. To address churn effectively, distinguish between:
While churn rate tracks customer loss, revenue churn focuses on the financial impact.
NRR measures revenue changes from existing customers, factoring in expansions, contractions, and cancellations:
NRR = (Starting MRR + Expansion − Contraction − Churn) ÷ Starting MRR × 100
An NRR above 100% indicates that your customer base is growing revenue-wise, even without acquiring new customers. Companies with NRR over 100% see median year-over-year growth of 48%, compared to much slower growth in companies with lower NRR [3]. Top SaaS companies, like Snowflake, often report NRR between 110% and 125% - Snowflake reached 126% in January 2025 due to its usage-based pricing model [2].
"If I could only look at one metric in a subscription business, it would be net revenue retention. It answers the most important question: 'If I stopped acquiring new customers tomorrow, would my business still grow?'" - Dan Layfield, Growth at Codecademy [2]
LTV estimates the total gross profit a customer generates throughout their relationship with your business:
LTV = (ARPU × Gross Margin %) ÷ Monthly Churn Rate
Using gross margin instead of revenue ensures accuracy. For example, if your ARPU is $100, gross margin is 75%, and churn is 2.5%, your LTV is $3,000 - not $4,000. This difference significantly impacts how much you can afford to spend on customer acquisition [3].
CAC = Total Sales & Marketing Spend ÷ New Customers Acquired
When calculating CAC, include all related costs, such as salaries, commissions, software, and overhead. Many teams discover their actual CAC is 30–50% higher than ad-spend-only estimates [3]. A precise CAC calculation ensures your unit economics reflect reality.
LTV:CAC = Gross-Margin LTV ÷ Full CAC
This ratio is a key indicator of sustainability. A ratio of 3:1 is the minimum threshold for healthy growth. In 2024, the median for private B2B SaaS companies was 3.6:1 [3]. A ratio below 3:1 suggests that additional marketing spend may harm profitability, while a ratio above 5:1 could indicate underinvestment in growth.
Pay close attention to the CAC payback period, which measures how long it takes to recoup acquisition costs. The median payback period for private B2B SaaS companies increased to 20 months in 2025, compared to the historical range of 12–14 months [3]. A healthy ratio paired with a long payback period could signal cash flow challenges.
"LTV:CAC tells you if the unit economics work eventually. Payback period tells you if you have the cash to get there." - Dan Layfield, Growth at Codecademy [2]
ARPU = Total MRR ÷ Total Active Subscribers
ARPU reflects your pricing strategy's effectiveness. Tracking ARPU over time shows whether customers are moving to higher-value plans or being pushed toward lower-value ones. For budgeting, use net ARPU - gross ARPU minus fees like App Store commissions (15–30%) - to understand the revenue that actually reaches your business [8].
Segment ARPU by plan tier, acquisition channel, or customer cohort to identify profitable segments and opportunities for pricing adjustments.
These metrics measure how well your business turns interest into revenue:
Trial conversion rates depend on the trial structure. Requiring a credit card typically results in 40–60% conversion rates, while no-card trials see 15–30% [1][2]. When calculating, exclude stale signups and deduct refunds from your totals to keep numbers accurate [8].
Low trial conversion rates often suggest onboarding issues. If users don’t quickly experience the product’s value, they’re unlikely to convert. Together, these metrics provide actionable insights to refine your strategy and drive growth.
Tracking these nine metrics is just the beginning. The real challenge - and value - comes from turning those numbers into decisions that guide your daily operations and align with your financial reporting.
A solid metrics system starts with clean, consistent data. Begin by identifying where each metric originates: billing platforms for MRR and churn, CRM systems for acquisition costs, and product analytics for trial conversions.
One common issue is metric drift - when the same metric is interpreted differently by various teams. To avoid this, create a centralized metrics dictionary. For example, clearly separate MRR from one-time fees and define ARR in contrast to similar metrics like Booked Annual Contract Value (ACV). These distinctions are especially critical when preparing reports for investors or gearing up for a funding round.
"Snapshot metrics lie. A single blended churn rate across the entire subscriber base is an average that conceals the actual retention curve." - Swell Team [1]
If your ARR is below $500,000, spreadsheets might suffice. But once you surpass that point, manual tracking quickly becomes unmanageable due to complications like mid-cycle upgrades, prorated refunds, and failed payment retries. At this stage, adopting an automated billing platform or data warehouse isn’t just helpful - it’s essential [1].
Once your data is standardized, the next step is establishing a consistent reporting system to utilize this clarity.
A reporting system only works if it sticks to a predictable schedule. At a minimum, update your KPI dashboard monthly. As your business grows, consider tracking fast-moving metrics - like MRR changes, collections, and churn - on a weekly basis [5].
Organize your reports into layers for better focus. Use scoreboard metrics (MRR, ARR, NRR) to show overall performance, lever metrics (churn rate, LTV, ARPU) to explain the "why", and input metrics (CAC, payback period, trial conversion) to measure efficiency. This structure ensures leadership stays focused on what matters, rather than getting lost in excessive data.
"Most subscription businesses track 30 metrics and act on 3. That's the actual problem - not a missing metric nobody has heard of, but a dashboard that gives you information without direction." - Dan Layfield, Former Growth Lead, Codecademy [2]
Cohort analysis is another must-have for your monthly reporting. By grouping subscribers based on their signup month, you can uncover the true retention curve - something a blended average can’t reveal. For instance, direct-to-consumer businesses often experience sharp drop-offs between months 2 and 4, which only cohort analysis can highlight [1].
By sticking to a structured reporting cycle, you ensure your key metrics consistently inform the strategic actions discussed earlier.
Once your automated reports reveal trends, a financial advisor can help turn those metrics into actionable strategies. Subscription-based revenue often goes beyond what standard P&L statements can capture.
This is where a financial advisor experienced in subscription models can make a difference. Phoenix Strategy Group specializes in helping growth-stage companies integrate billing and accounting data, develop financial models tailored to recurring revenue, and produce board-ready reports. Their Monday Morning Metrics system and Integrated Financial Model provide leadership with a clear, real-time view of the numbers driving key decisions - without the headaches of manual reconciliation.
If your company is preparing for a fundraise or exit, having a financial advisor align your subscription analytics with your General Ledger is critical. Any discrepancies between dashboard metrics and actual revenue can quickly undermine your credibility during due diligence.
Tracking the right metrics can help you identify where your revenue stands strong and where it might be slipping through the cracks. Metrics like MRR (Monthly Recurring Revenue) and ARR (Annual Recurring Revenue) give you a snapshot of what you’ve built, while churn and net revenue retention reveal how well you’re holding onto it. On the other hand, LTV (Lifetime Value), CAC (Customer Acquisition Cost), and their ratio help you evaluate the sustainability of your growth. Finally, ARPU (Average Revenue Per User) and conversion rates highlight areas where you can focus your next strategic efforts.
Benchmarks provide a reality check. For example, the median B2B SaaS NRR is projected to hit 82% in 2025, which falls short of the 100% threshold that distinguishes businesses with compounding growth from those constantly scrambling to replace lost customers. Additionally, the median LTV:CAC ratio is 3.6:1 as of 2024, and the CAC payback period hovers around 20 months [3]. These numbers give you a baseline to measure your performance against.
By using these metrics, you can make both immediate tactical adjustments and informed long-term decisions.
Once you’ve gained clarity on these metrics, the next step is to ensure your reporting process is consistent and efficient. Start by establishing clear definitions for each metric and setting up a regular reporting schedule. Fast-moving indicators like MRR and churn should be reviewed weekly, while deeper analyses, such as cohort performance, can be tackled monthly. This consistency will help you uncover trends and patterns that might otherwise go unnoticed.
If you’re preparing for funding rounds or planning an exit, aligning your metrics with your General Ledger is a must. This is where Phoenix Strategy Group can step in. They specialize in helping growth-stage businesses reconcile subscription data with financial statements, ensuring your reports are ready for investors and stakeholders. This alignment not only simplifies your reporting but also positions your business for its next big leap forward.
Monthly Recurring Revenue (MRR) and Annual Recurring Revenue (ARR) both measure subscription-based income, but they operate on different timeframes.
Neither metric includes one-time charges, like setup fees, as the focus is on consistent, repeatable income streams. MRR is especially useful for tracking short-term trends and changes, while ARR is better suited for long-term planning, forecasting, and keeping investors informed.
Calculating lifetime value (LTV) using a fixed churn rate often overlooks the effect of monthly fluctuations. A better approach is cohort analysis. This involves grouping subscribers based on their start month and tracking how much revenue each group generates over time. By doing this, you can see how churn rates and revenue growth change month by month. It’s a more accurate way to estimate LTV since it captures the differences in behavior between early and later months, rather than relying on generalized averages.
If your Net Revenue Retention (NRR) is below 100%, it means you're losing more revenue from existing customers than you're gaining. This could indicate your customer base is shrinking. To pinpoint the problem, start by examining your Gross Revenue Retention (GRR). This will help you identify whether the issue lies with customer churn or downgrades.
Phoenix Strategy Group specializes in integrating cohort-level retention data into financial models, making it easier to detect these risks early. To turn things around, prioritize enhancing your core product and refining your expansion strategies. The goal? Deliver more value to your current customers and boost retention.