Published on
January 9, 2026

Clean energy projects succeed when their financial and environmental metrics align. Here's what matters most:
Each option has unique strengths, from cost savings to local impact. Whether you're an investor, policymaker, or developer, understanding these dynamics helps you make informed decisions.
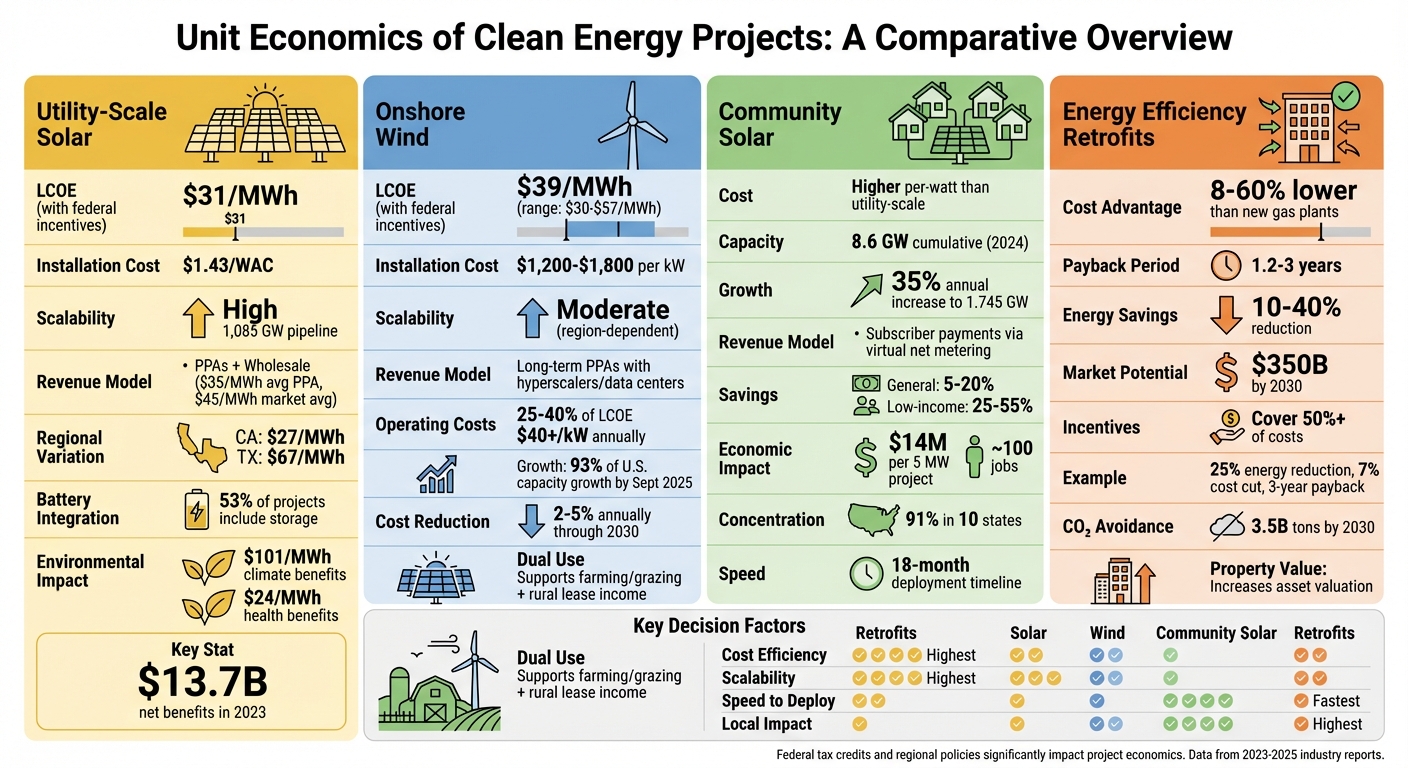
Clean Energy Project Types: Cost, Scalability, and Impact Comparison
Utility-scale solar projects generate revenue primarily through Power Purchase Agreements (PPAs) and wholesale market sales. PPAs provide a steady, long-term income, with an average price of $35/MWh in 2023 [2]. Interestingly, while production costs have declined, PPA prices have risen since 2021 [2]. Regional variations play a key role here - prices in the western U.S. typically range from $20-$30/MWh, while other regions see rates between $30-$40/MWh [3].
Wholesale revenue comes from two components: energy value and capacity value [2]. In 2023, the national average market value reached $45/MWh. However, this varies significantly by location - California’s CAISO market averaged $27/MWh due to oversupply during peak solar hours, while Texas’s ERCOT market saw average values as high as $67/MWh [2]. Projects launched in 2022 earned, on average, $15/MWh more than their generation costs in 2023 [2].
Adding battery storage has been a game-changer. It enables shifting electricity delivery to higher-priced evening hours, increasing revenue potential. This trend is reflected in the fact that 53% of the 1,085 GW of solar capacity in interconnection queues at the end of 2023 included battery storage. In California’s CAISO market, this figure skyrocketed to 98% [2].
These revenue trends highlight the growing financial appeal of utility-scale solar projects.
The cost of building utility-scale solar projects continues to decline. In 2023, the capacity-weighted average installed cost dropped to $1.43/WAC, an 8% reduction from the previous year [2]. Since 2010, installation costs have fallen by 75%, with an average annual decline of 10% [2].
One key factor driving efficiency is the widespread adoption of single-axis tracking systems, which were installed in 94% of new projects in 2022. While these systems come with higher upfront costs, they significantly boost energy production, achieving a median capacity factor of 24% [2][3].
Lower installation costs directly improve the financial viability of these projects.
Utility-scale solar's Levelized Cost of Energy (LCOE) stood at $46/MWh in 2023 before accounting for incentives. Federal tax credits reduce this figure to $31/MWh - a 32% discount compared to the $45/MWh national market average [2].
Beyond electricity production, utility-scale solar delivers broader economic benefits. When public health improvements ($24/MWh) and avoided climate damages ($101/MWh) are considered, the industry generated $13.7 billion in net benefits for the U.S. in 2023 [2]. The addition of 18.5 GWAC of new capacity that year pushed the nation’s cumulative total to over 80.2 GWAC [2].
The environmental benefits of utility-scale solar are substantial. Reduced air pollution contributes $24/MWh in public health benefits, while avoiding global climate damages adds $101/MWh [2]. These factors enhance the overall value of solar energy, showing how it delivers returns far beyond just electricity.
Onshore wind projects, much like utility-scale solar, are built on a foundation of long-term contracts and cost improvements, making them financially appealing. These projects often rely on Power Purchase Agreements (PPAs) with hyperscalers and data centers, ensuring stable pricing and reducing risks for investors [8][10]. The demand for low-carbon energy is surging, especially with the rapid growth of AI infrastructure. By 2026, global wind and solar capacity is projected to hit 4,000 GW, surpassing coal and gas-fired power for the first time [10].
"The economics of renewable power are just too good to ignore, and this helps to insulate the sector from geopolitical volatility."
- Albert Cheung, Deputy CEO, BloombergNEF [6]
To maximize revenue, developers are turning to strategies like asset repowering and integrating battery storage, which extends the lifespan of projects and enables energy arbitrage and grid services [8]. Additionally, tax credit monetization plays a critical role. Projects that begin construction by the end of 2025 can lock in tax credits for four years, offering some protection as phaseouts approach [8].
While revenue mechanisms provide stability, keeping costs under control is equally crucial to maintain competitive economics.
Wind turbines dominate the cost structure, making up about 70% of the total project expenses [11]. Typically, utility-scale onshore wind installations cost between $1,200 and $1,800 per kW, while commercial turbines (2–3 MW) range from $2.6 million to $4 million each [11][12]. Other capital costs include foundations, electrical systems, and labor for installation. Over a turbine's lifetime, operating costs represent 25% to 40% of the Levelized Cost of Energy (LCOE), with land-based wind farms incurring annual maintenance costs exceeding $40 per kW as of 2023 [11][12].
Larger turbines offer better economics by reducing the cost per megawatt of capacity. Fewer turbines are needed to achieve the same output, which lowers infrastructure costs like foundations and roads [11]. Although supply chain disruptions caused turbine prices to spike between 2020 and 2023, the market steadied in 2024 and 2025. Experts predict gradual cost reductions of 2% to 5% annually through 2030 [11].
With these costs in mind, financial performance metrics like LCOE are key to understanding overall returns.
The average LCOE for onshore wind is about $39/MWh, though it varies from $30 to $57/MWh depending on site conditions and financing [12]. However, LCOE alone doesn’t tell the full story. The Levelized Avoided Cost of Electricity (LACE) provides a more complete picture by measuring the cost savings when wind energy replaces traditional power generation [1]. Dividing LACE by LCOE gives the Value-Cost Ratio, which helps assess whether a project delivers more value than it costs. A ratio above 1 indicates strong economic competitiveness. This metric is especially useful for comparing onshore wind with solar and energy storage across 25 U.S. regions [1].
Onshore wind projects are increasingly judged not just for their carbon-cutting potential but also for the benefits they bring to local communities.
"In 2026, the projects that move fastest will be those that combine resilience with a compelling local story: cleaner air, stable bills, visible economic benefits."
- Maciej Kolaczkowski, Manager, Advanced Energy Solutions Industry, World Economic Forum [7]
Tax credit strategies, like safe-harboring, remain vital as phaseouts could increase costs by 32% to 63% [8]. Even with these challenges, renewables are proving to be the more affordable option - over 90% of new renewable projects are cheaper than fossil fuels. By September 2025, renewables accounted for 93% of U.S. capacity growth [8][9]. Beyond their financial appeal, onshore wind projects continue to strengthen their case by delivering cleaner energy and tangible local economic benefits.
Community solar operates differently from traditional utility-scale solar projects. Instead of relying on a single long-term Power Purchase Agreement (PPA), it generates revenue through decentralized payments from subscribers [15]. This model is supported by virtual net metering, a policy that credits subscribers on their utility bills for energy produced at an off-site solar installation [14]. For participants, this often translates into annual electricity bill savings of 5% to 20%, making it an appealing option for renters and condo owners who can't install rooftop solar panels [14]. In certain states, low- to moderate-income participants enjoy even greater savings, ranging from 25% to 55% [17]. While project owners benefit from federal tax credits and cash incentives, these financial advantages are generally not passed directly to subscribers [14][15]. These revenue mechanics also influence the overall cost structure of community solar projects.
Community solar projects face unique cost challenges compared to utility-scale installations. For example, while utility-scale solar averaged $1.43 per watt AC in 2023 [2], community solar projects often incur higher per-watt costs. This is largely due to additional administrative and soft costs, which don't scale as efficiently in smaller projects [17]. Factors like permitting, compliance, and ongoing subscriber management further drive up expenses. Unlike utility-scale projects, which typically serve a single off-taker, community solar requires continuous management of multiple subscribers, adding to operational costs [17]. Despite these hurdles, the sector is growing rapidly. By 2024, the U.S. had 8.6 GW of cumulative installed capacity, with annual installations rising 35% to 1.745 GW. However, this growth is heavily concentrated, with 91% of capacity located in just 10 states [17].
Community solar projects contribute significantly to local economies. A typical 5 MW installation can create about 100 jobs and generate roughly $14 million in local economic activity [16]. Scaling up to 750 MW could result in an economic impact of approximately $2.1 billion [16]. Partnerships between corporations and solar developers are also accelerating growth. For example, in May 2025, Nexamp and Chipotle announced plans to develop a 75 MW community solar portfolio across 15 new solar farms, illustrating how corporate collaboration is fueling deployment [17]. These financial metrics underscore the distinct economic benefits community solar brings compared to larger-scale installations.
Beyond its economic contributions, community solar delivers notable environmental and social benefits. It’s increasingly seen as a tool for equity. For instance, New Mexico's Community Solar Act requires that 30% of each project serve low-income households, while Colorado mandates savings of 25% to 55% for low- to moderate-income participants [17]. In August 2024, Alaska joined the movement when Governor Mike Dunleavy signed SB-152 into law, setting standards for community solar programs and requiring utilities to make them accessible to residents [17].
Jeff Cramer, CEO of the Coalition for Community Solar Access, captures the significance of this approach:
"This is the energy policy equivalent of finding a $100 bill on the sidewalk - if you're a governor or a legislator and you walk past it, you're doing your state a disservice."
- Jeff Cramer [16]
Community solar also stands out for its speed. As Cramer points out:
"Community solar is fast, cost-effective, and it works. We don't have 10 years to build our way out of this energy crunch. In some cases, we have 18 months, and community solar fits the timeline" [16].
These projects not only address pressing energy needs but also create opportunities for broader participation in the clean energy transition.
Energy efficiency retrofits don’t generate power - they save it. By cutting future energy consumption (often called "negawatts") and sidestepping costs tied to new infrastructure and fuel, these retrofits create value in a unique way [18]. Clean energy portfolios that incorporate efficiency measures can be procured at 8% to 60% lower net costs compared to building new gas-fired power plants [18].
They also bolster grid reliability by easing peak demand and delaying expensive infrastructure upgrades - an increasingly important benefit as renewables, with their intermittent nature, continue to grow [18][13]. The market potential here is massive: replacing over half of retiring thermal capacity with clean portfolios could open up a $350 billion market by 2030 [18]. These factors combine to make retrofits a financially attractive option.
The cost dynamics of retrofits stand in sharp contrast to those of new energy generation projects. While solar and wind installations demand hefty upfront investments in panels and turbines, retrofits focus on relatively smaller-scale upgrades like LED lighting, HVAC systems, pipe insulation, and variable-speed pumps [19]. Incentive programs often cover more than 50% of these costs [19].
Take, for example, the 2024-2025 retrofit at Rosemead Place, a 131-unit multifamily complex managed by Mashcole Property Management in partnership with Green Econome. The project included upgrades such as 96% efficient tankless water heaters, improved pipe insulation, LED lighting installations, and a variable-speed pool pump. The gross cost of $134,048 was significantly reduced by $76,148 in incentives from the SoCalREN Multifamily Program, bringing the net cost to just $57,900 [19].
The payback periods for these projects are often short, typically ranging from 1.2 to 3 years [19]. For instance, manufacturing facilities have achieved payback periods as brief as 1.2 years with upgrades like LED lighting and HVAC controls [19]. The key to maximizing returns lies in bundling measures with varying payback timelines to create an overall favorable return [20].
Retrofits deliver measurable performance gains, but not in the traditional sense of kilowatt-hours generated. Instead, success is tracked through energy savings percentages and increases in property value. The Rosemead Place retrofit, for example, achieved a 25% reduction in energy usage and a 7% cut in energy costs, all with a 3-year payback period. This project also boosted the property’s valuation by $351,399 on a $57,900 net investment [19].
Comprehensive retrofit programs typically yield energy savings of 10% to 40% [20]. Beyond the financial benefits, the environmental impact is impressive: clean portfolios that include efficiency measures could avoid 3.5 billion tons of CO2 emissions by 2030 [18]. Unlike utility-scale solar projects, which are often evaluated using the levelized cost of energy (LCOE), retrofits are judged based on immediate cost savings and their ability to enhance asset value [13][19].
The benefits of retrofits extend far beyond financial metrics. These projects enhance building comfort, reduce maintenance expenses, and lower utility bills for both residents and businesses. On a larger scale, the avoided emissions - 3.5 billion tons of CO2 by 2030 - make a meaningful contribution to global climate objectives [18]. As noted by Mark Dyson, Jamil Farbes, and Alex Engel from RMI:
"Clean energy portfolios can often be procured at significant net cost savings, with lower risk and zero carbon and air emissions, compared to building a new gas plant." [18]
Retrofits also play a critical role in strengthening grid resilience. By reducing energy demand close to the point of consumption, they minimize transmission and distribution losses. This localized approach provides the flexibility needed to better integrate renewable energy sources, which can be unpredictable [13]. Andrew Lever, Director of Energy Transition at the Carbon Trust, underscores this point:
"Power systems can be run predominantly by renewable energy providing continuous power from a diversity of generation sources and that story needs to be told." [13]
Different clean energy project types come with their own set of financial and operational considerations. Understanding these nuances is crucial for investors and developers aiming to align projects with their goals and limitations.
| Project Type | Cost Efficiency | Scalability | Risk Profile | Environmental & Social Impact |
|---|---|---|---|---|
| Utility-Scale Solar | High (LCOE at $31/MWh with federal incentives; costs are decreasing) [2] | High (1,085 GW pipeline, though only ~10% historically reaches completion) [2][4] | High (Predictable pricing but faces interconnection delays and market cannibalization risks) [2] | High (Zero emissions; delivers ~$24/MWh in public health benefits and ~$101/MWh in reduced climate damages; land-intensive) [2][4] |
| Onshore Wind | High (Cost-effective operations) [21] | Moderate (Limited by regional wind availability) [21] | Moderate (Impacted by wind variability and wildlife concerns) [21] | High (Supports dual land use like farming or grazing; provides lease income for rural landowners) [21] |
| Community Solar | Moderate (Higher per-watt costs than utility-scale projects) [2][5] | Moderate (Distributed deployment avoids major transmission challenges) [2][5] | Low to Moderate (Faces grid integration issues and state policy risks) [5] | High (Improves local electricity access, reduces consumer rates, and strengthens grid reliability) [18] |
| Energy Efficiency Retrofits | Very High (Avoids generation costs; 8–60% lower net costs than new gas-fired plants) [18] | High (Applicable across diverse building types) [18] | Moderate (Complex implementation may require careful planning for optimal returns) | High (Can prevent up to 3.5 billion tons of CO₂ emissions by 2030 while delivering savings and better building comfort) [18] |
Here’s a quick breakdown of these trade-offs. Utility-scale solar boasts low costs but faces challenges like interconnection delays, with only about 10% of projects advancing to full operation [2][4]. Onshore wind offers cost-effective energy and supports dual land use, but its viability depends on regional wind availability [21]. Community solar, though more expensive per watt, enhances local energy access and bolsters grid stability [2][5]. Meanwhile, energy efficiency retrofits stand out for their ability to bypass new generation needs altogether, cutting costs by 8–60% compared to gas-fired plants while reducing emissions and improving building conditions [18]. Each approach requires careful consideration to match specific priorities and objectives.
The best clean energy investments depend on your goals. Utility-scale solar paired with battery storage shows strong financial performance. For instance, in ERCOT, solar costs averaged $67/MWh, compared to $27/MWh in CAISO. Projects completed in 2022 earned an additional $15/MWh above their costs, with federal tax credits further reducing the levelized cost of energy (LCOE) from $46/MWh to $31/MWh[2].
For those prioritizing both financial returns and environmental impact, utility-scale solar offers substantial benefits. It delivers $101/MWh in avoided climate damages and $24/MWh in public health improvements, generating $13.7 billion in net value in 2023. Energy efficiency retrofits are another impactful option, potentially reducing construction costs by 8–60% and preventing up to 3.5 billion tons of CO₂ emissions by 2030[2][18].
If community benefits are your focus, community solar stands out. It improves local electricity access and strengthens grid reliability, all without requiring extensive transmission upgrades.
Hybrid systems are also gaining traction. Over half (53%) of the 1,085 GW currently in interconnection queues are paired with batteries[2]. These systems help mitigate value deflation in markets with high renewable penetration and optimize energy generation during peak pricing periods. However, it's worth noting that only about 10% of projects in these queues ultimately reach completion[2].
Federal tax credits, including the Production Tax Credit (PTC) and Investment Tax Credit (ITC) introduced through the Inflation Reduction Act of 2022, play a crucial role in reducing the costs associated with building and operating clean energy projects. These incentives significantly cut the levelized cost of electricity (LCOE) - a key measure of a project's cost-effectiveness - by several cents per kilowatt-hour. In many cases, this makes clean energy projects far more appealing to investors.
The PTC is designed to benefit wind and other energy generation technologies that produce electricity consistently over time. On the other hand, the ITC is geared toward solar and energy storage systems. For instance, a solar-plus-storage project with an initial LCOE of $0.07/kWh could see that drop to $0.05/kWh thanks to the ITC. Similarly, a wind project might reduce its LCOE from $0.045/kWh to $0.035/kWh with the help of the PTC. These reductions not only improve financial metrics like the internal rate of return but also shorten the payback period, making such projects significantly more attractive to potential investors.
Companies like Phoenix Strategy Group specialize in helping clean energy firms integrate these tax credits into their financial strategies. By doing so, they assist businesses in securing funding, improving project economics, and setting the stage for long-term success in the U.S. clean energy market.
When assessing utility-scale solar projects, a handful of financial metrics are essential for gauging their potential success. These include the installed capital cost (expressed in dollars per watt, $/W), operations and maintenance (O&M) costs, and the capacity factor, which measures how efficiently the system generates energy over time.
Equally important are the levelized cost of energy (LCOE) - the average cost to produce energy throughout the system's lifespan - and the power purchase agreement (PPA) price, which outlines the agreed-upon rate for selling the electricity produced. A project's financial health is often evaluated through its net market value, using indicators like the internal rate of return (IRR) or the payback period. Together, these metrics offer a clear snapshot of the economic performance and future potential of the project.
Community solar projects bring a host of economic and environmental advantages to local areas. By constructing and managing shared solar arrays, developers create employment opportunities for local contractors, electricians, and engineers. These projects also contribute to the community's financial health by generating property and sales tax revenue, which can be used to support vital services like schools, road maintenance, and public infrastructure. On top of that, the renewable energy produced helps lower utility bills for participating households and businesses, leaving more money in their pockets for other local expenditures.
What sets community solar apart from traditional rooftop systems is its accessibility. There’s no need for individual installations, which makes it a great option for renters, people living in multi-family buildings, or homeowners whose roofs aren’t suitable for solar panels. Instead, participants subscribe to a share of the solar array’s energy output, reaping the benefits of lower energy costs and reduced environmental impact - without any upfront costs. This inclusive approach not only makes solar energy more widely available but also bolsters grid stability, creates new clean energy jobs, and enhances the local energy network.