Published on
February 23, 2026


Banking-as-a-Service (BaaS) enables non-financial companies to offer banking products by partnering with sponsor banks and BaaS platforms. This model thrives on interchange revenue, lending margins, and subscription fees, creating a multi-layered ecosystem. By 2026, this market could generate $51 billion in new revenue, driven by the Durbin Amendment's higher interchange fees for smaller banks. However, profitability depends on balancing costs, revenue splits, and scaling efficiently.
This ecosystem offers rapid market entry for fintechs but demands precise execution to maintain profitability as scale increases.
BaaS Cost Structure Comparison: Banks vs Distributors
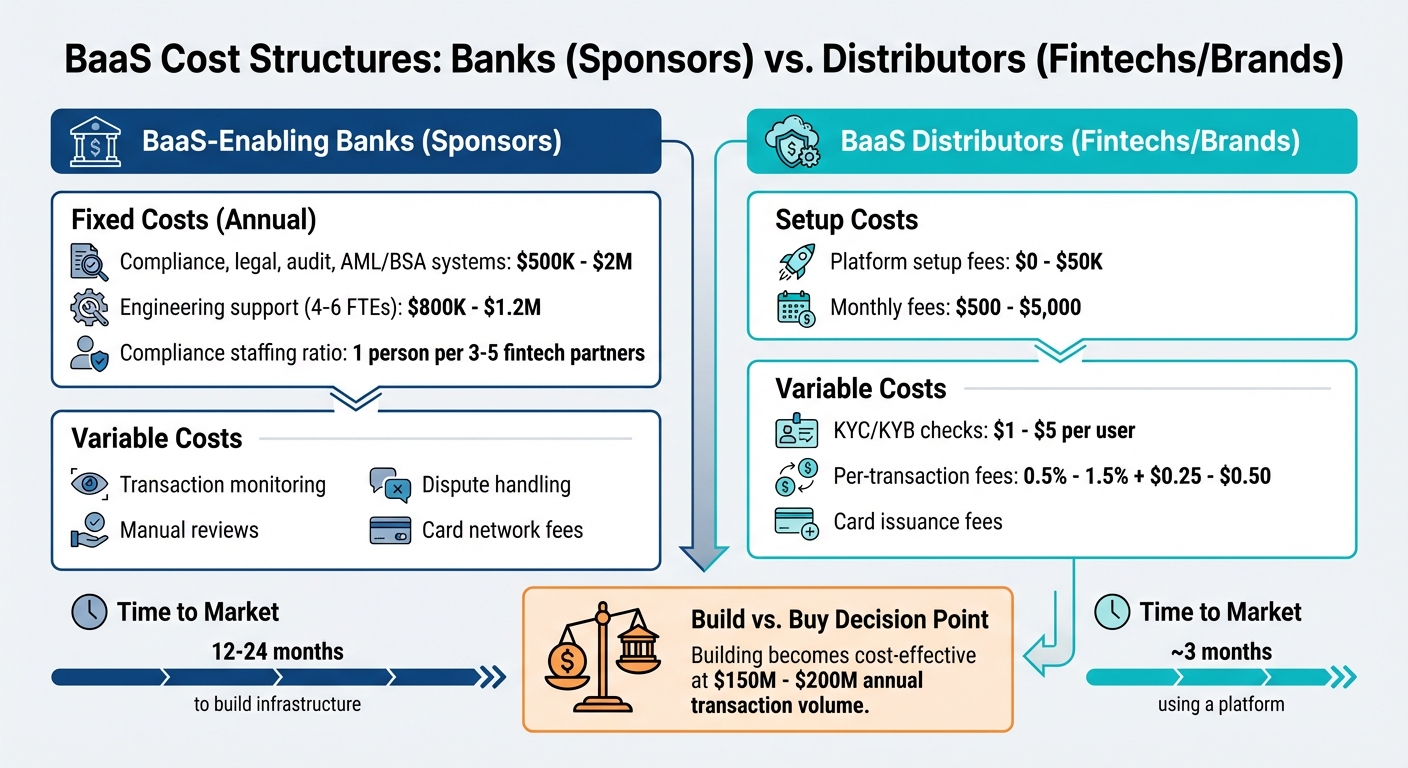
Let’s dive into how costs stack up for BaaS banks versus distributors, building on the revenue dynamics we explored earlier. While BaaS banks deal with hefty fixed costs, distributors face variable, transaction-based expenses.
Sponsor banks handle significant fixed costs tied to compliance. For instance, legal, audit, and AML/BSA systems can cost anywhere from $500,000 to $2 million annually. On top of that, engineering support for 4–6 full-time employees adds another $800,000 to $1.2 million per year [9]. Banks also require dedicated AML/BSA monitoring systems, partner data warehouses, and compliance teams, typically staffed at a ratio of one person for every three to five fintech partners [8]. As Teri Hodgett, Chief Risk Officer at Sunrise Banks, puts it:
"Your overhead cost is going to increase if you want to do it correctly" [8].
Distributors, on the other hand, deal with variable costs like platform setup fees (ranging from $0 to $50,000), monthly fees ($500 to $5,000), KYC/KYB checks ($1 to $5 per user), and per-transaction fees (0.5%–1.5% plus $0.25–$0.50) [9]. One major advantage for distributors is speed: they can launch in as little as 3 months, compared to the 12–24 months it takes for banks to build their infrastructure [1][9]. For most distributors, the "build vs. buy" decision leans toward buying - at least until they hit $150 million to $200 million in annual transaction volume [9].
Here’s a quick breakdown of costs:
| Cost Category | BaaS-Enabling Bank (Sponsor) | BaaS Distributor (Fintech/Brand) |
|---|---|---|
| Primary Fixed Costs | Compliance/risk staff, AML systems, data warehouses, regulatory licenses | Integration engineering, monthly subscription |
| Primary Variable Costs | Transaction monitoring, dispute handling, manual reviews, card network fees | Per-transaction fees, KYC/KYB checks, card issuance fees |
| Time to Market | 12–24 months to build infrastructure | About 3 months using a platform |
These differences in cost structures provide key insights into how BaaS profitability is shaped by operational choices and scale.
Banking-as-a-Service (BaaS) generates revenue from three main sources: interchange fees, lending margins, and subscription fees. How these earnings are divided depends on whether the provider partners directly with a bank or operates through a platform. Let’s break down each revenue stream and its effect on profitability.
Interchange fees play a central role in BaaS revenue. These fees are distributed across several stakeholders in a typical B2B transaction: fintech distributors often receive about 1.05%, BaaS platforms collect 0.50%, card networks take 0.50%, program managers earn 0.25%, and issuing banks claim approximately 0.20% [3]. Sacra Research explains this dynamic:
"As transaction volume increases, the bottom of the stack is compressed. The top of the stack - the fintech companies using BaaS products - takes the majority of the interchange."
– Sacra Research [3]
This arrangement is influenced by the "Durbin-exempt" status, which applies to banks holding less than $10 billion in assets. These smaller banks can charge nearly double the interchange fees compared to larger institutions [3][7].
Lending margins offer another revenue stream with higher profit potential, albeit with added credit risk. Traditional banks typically achieve a net interest margin (NIM) of 3%–4% [6]. BaaS lending can push these margins even higher. For instance, Toast launched Toast Capital in 2019 to provide flexible loans to restaurants. By 2023, this initiative was driving $14 million in annual revenue [1]. Similarly, SoFi’s 2023 10-K filing revealed that its lending segment reached a 60% contribution profit, far surpassing the 20%–30% contribution profit of its technology platform segment [10].
Subscription and platform fees create a steady income stream, particularly for embedded finance clients with fewer transactions. Many BaaS providers charge between $1 and $5 per active account per month or offer flat-rate subscriptions [4][1]. This model is especially effective when non-financial brands integrate banking services. For example, Thread Bank’s collaboration with Roofstock has attracted thousands of new business customers, with embedded accounts achieving an LTV four times higher than standard accounts [12].
Revenue division also depends on the go-to-market strategy. Bank-direct models take longer to implement - up to 2 years - but allow fintechs to retain more interchange revenue since there’s no intermediary [13]. On the other hand, platform-mediated models can launch in as little as 3 months, though they require sharing 0.12%–0.50% of interchange fees with the BaaS provider [3][13]. The potential for growth in this market is immense: embedded finance transaction value hit $2.6 trillion in 2021 and is projected to surpass $7 trillion by 2026 [11][1]. Additionally, card payments currently make up just 2% of the $125 trillion global B2B payments market [3], signaling room for expansion.
These revenue models highlight the trade-offs between speed to market and long-term profitability, requiring careful strategy from operators navigating this growing industry.
After examining cost structures and revenue models, profitability metrics show how these elements come together in practice. For Banking-as-a-Service (BaaS) operations, profitability goes beyond standard banking measures. A solid BaaS business should maintain an LTV:CAC ratio of at least 3:1 - meaning every customer should generate three times more lifetime value than the cost to acquire them. If the ratio falls below 1:1, the business is losing money on each new customer[14][18]. Top-performing companies often exceed this benchmark, while targeting a CAC payback period of under 12 months (though 12–18 months is still acceptable)[14].
Margin compression is another critical factor. As fintech partners grow, they gain leverage to negotiate better terms, often reducing the BaaS platform’s share of interchange revenue. For instance, in 2020, Marqeta faced this challenge when Square - responsible for 70% of its net revenue - secured better terms, lowering Marqeta's take rate from approximately 0.7% in 2019 to 0.5% in 2020[3]. Monitoring contribution profit is essential to understanding true operating margins.
Cost efficiency becomes increasingly important as platforms scale. A clear example comes from March 2020 when Drift noticed rising cloud costs due to a surge in free-tier chatbot users. By redesigning their feature, they cut operating costs by 80%, saving over $3 million annually[17]. As Keith MacKenzie from CloudZero aptly noted:
"Increasing the number of users is only good news if each new user can be served profitably"[17].
Additionally, BaaS providers should aim for revenue per employee exceeding $200,000 by year two and strive to keep fraud losses below 8 basis points of gross payment volume[19].
Traditional banking metrics still hold relevance for BaaS-enabled banks. For example, a 1% Return on Assets (ROA) - indicating $1 of profit for every $100 in assets - remains a key efficiency measure[16]. That said, asset-light BaaS models often achieve higher ROA than traditional mid-size banks[15]. Furthermore, B2B transactions typically carry higher interchange rates (around 2.5%) compared to consumer debit transactions (about 1.35%), helping offset margin pressures[3][4].
Together, these benchmarks provide a comprehensive view of BaaS profitability, complementing earlier discussions on costs and revenue. Phoenix Strategy Group supports growth-stage BaaS companies in fine-tuning these metrics through detailed profitability analysis at the product and customer level. Their expertise in unit cost intelligence and pricing adjustments helps uncover the most lucrative features and customer segments - essential for mitigating margin compression and ensuring sustainable growth as transaction volumes rise.
Banking-as-a-Service (BaaS) comes with clear benefits and challenges for both sponsor banks and distributors. Sponsor banks can tap into asset-light revenue streams by leveraging their regulatory licenses and infrastructure without needing to invest in physical branches. Smaller banks, especially those with assets under $10 billion, enjoy an additional advantage through the Durbin Amendment exemption, which allows them to charge nearly double the interchange fees compared to larger banks [3]. To illustrate the potential, community banks involved in BaaS saw median deposit growth of 2.2% in Q2 2023, while non-BaaS community banks experienced a 0.8% decline during the same period [2]. However, this opportunity comes with a significant downside: regulatory scrutiny. By May 2024, 13 BaaS banks had faced enforcement actions from federal regulators for inadequate oversight of their fintech partners [11]. Jason Wessling, President and CEO of Pacific West Bank, emphasized the stakes:
"We can outsource the technology but not the compliance responsibilities" [11].
On the other side, distributors, whether fintechs or non-financial brands, benefit from faster market entry and dramatically lower customer acquisition costs (CAC). Instead of the typical $100–$200 CAC, BaaS reduces this range to just $5–$35, cutting costs by up to 95%. Launch timelines also shrink from as long as two years to as little as three months [2][5][1]. For platforms with a million customers purchasing financial products, BaaS can generate revenue between $5 million and $13 million [5]. However, this model does have its challenges. Distributors rely heavily on stable bank partners and face higher per-transaction fees, which can lead to margin compression as they scale.
| Feature | Sponsor Banks | Distributors (Fintechs/Brands) |
|---|---|---|
| Cost Efficiency | Asset-light revenue; utilizes existing licenses | 95% lower CAC; avoids the cost of obtaining a banking license |
| Revenue Potential | Durbin-exempt interchange; deposit growth | Interchange split (1.5–3%); increased customer LTV |
| Scalability | High; can support multiple partners via APIs | Rapid; launch in 3 months vs. 2 years |
| Primary Disadvantage | High compliance/tech overhead; regulatory risk | Higher per-transaction fees; dependency on bank/middleware |
As platforms grow, the decision between building proprietary infrastructure and continuing with BaaS becomes crucial. Large-scale platforms often find that developing their own infrastructure becomes more cost-efficient over time, leading to higher churn rates for BaaS providers [3]. For BaaS to succeed, both banks and distributors need to fully commit. Banks must establish specialized risk management teams, while distributors should prioritize features that encourage long-term customer retention instead of solely chasing interchange revenue.
Keeping a close eye on unit economics is a must for sponsor banks and fintech distributors working within the Banking-as-a-Service (BaaS) ecosystem. Dan Kang, CFO of Mercury, captures the importance of this focus perfectly:
"Topline growth can look impressive while unit economics quietly signal trouble" [20].
While impressive revenue growth might grab attention, it can also overshadow deeper issues, like shrinking margins - a challenge that only grows as platforms scale [3][10].
As we’ve explored through discussions on cost structures, revenue streams, and profitability metrics, the ability to execute with precision is key. Sponsor banks face the tricky task of balancing asset-light revenue models with increasing compliance costs. Meanwhile, fintech distributors must decide if a comprehensive platform or modular solutions better align with their long-term goals. With issuing bank take rates dropping from 0.20% to as low as 0.02% at scale [3], there’s little room for missteps.
To tackle these challenges, expert advisory services - like those provided by Phoenix Strategy Group - play a critical role. They help growth-stage companies refine their unit economics by focusing on pricing strategies, customer segmentation, and revenue diversification. Using tools like FP&A, data engineering, and M&A advisory, Phoenix Strategy Group helps businesses optimize their financial models for sustainable growth.
Ultimately, mastering contribution profit - not just gross margin - sets companies apart. Those who can execute strategically on unit economics will be well-positioned to seize the growing opportunities in the BaaS market as it continues to evolve.
Creating a Banking-as-a-Service (BaaS) platform in-house can make sense for fintechs with the right mix of expertise, resources, and a strong need for tailored solutions. By building their own platform, companies gain greater control over features, regulatory compliance, and system integration. This approach is particularly useful for businesses aiming to support unique workflows or highly specialized products.
That said, this path comes with its own challenges. Developing a BaaS platform requires navigating long development timelines, meeting stringent regulatory requirements, and committing to ongoing maintenance. It’s a demanding process, best suited for fintechs that need a level of customization beyond what pre-built solutions can offer.
Banks that fall under the Durbin exemption can charge interchange fees that exceed the regulated cap. This provides a financial advantage, increasing profitability for banks engaged in Banking-as-a-Service (BaaS). However, the downside is that these higher fees might eat into the cost savings merchants and consumers typically expect, which could impact their overall experience.
Key metrics for evaluating BaaS unit economics include customer lifetime value (LTV), customer acquisition cost (CAC), and the payback period. These figures reveal essential insights: how much revenue a customer generates over their relationship with the business, the expense of acquiring that customer, and the time it takes to recoup those acquisition costs. Together, they provide a clear picture of profitability and operational efficiency.