Published on
February 18, 2026

Firmographics are like demographics for businesses. They help B2B sales teams focus on the right prospects by analyzing key company traits such as industry, size, revenue, and location. Here's why they matter:
Regularly update your ICP and data to keep your strategy effective. Firms that refresh their ICP quarterly see nearly 10% higher pipeline creation rates. By focusing on firmographics, you can close more deals and improve sales performance.
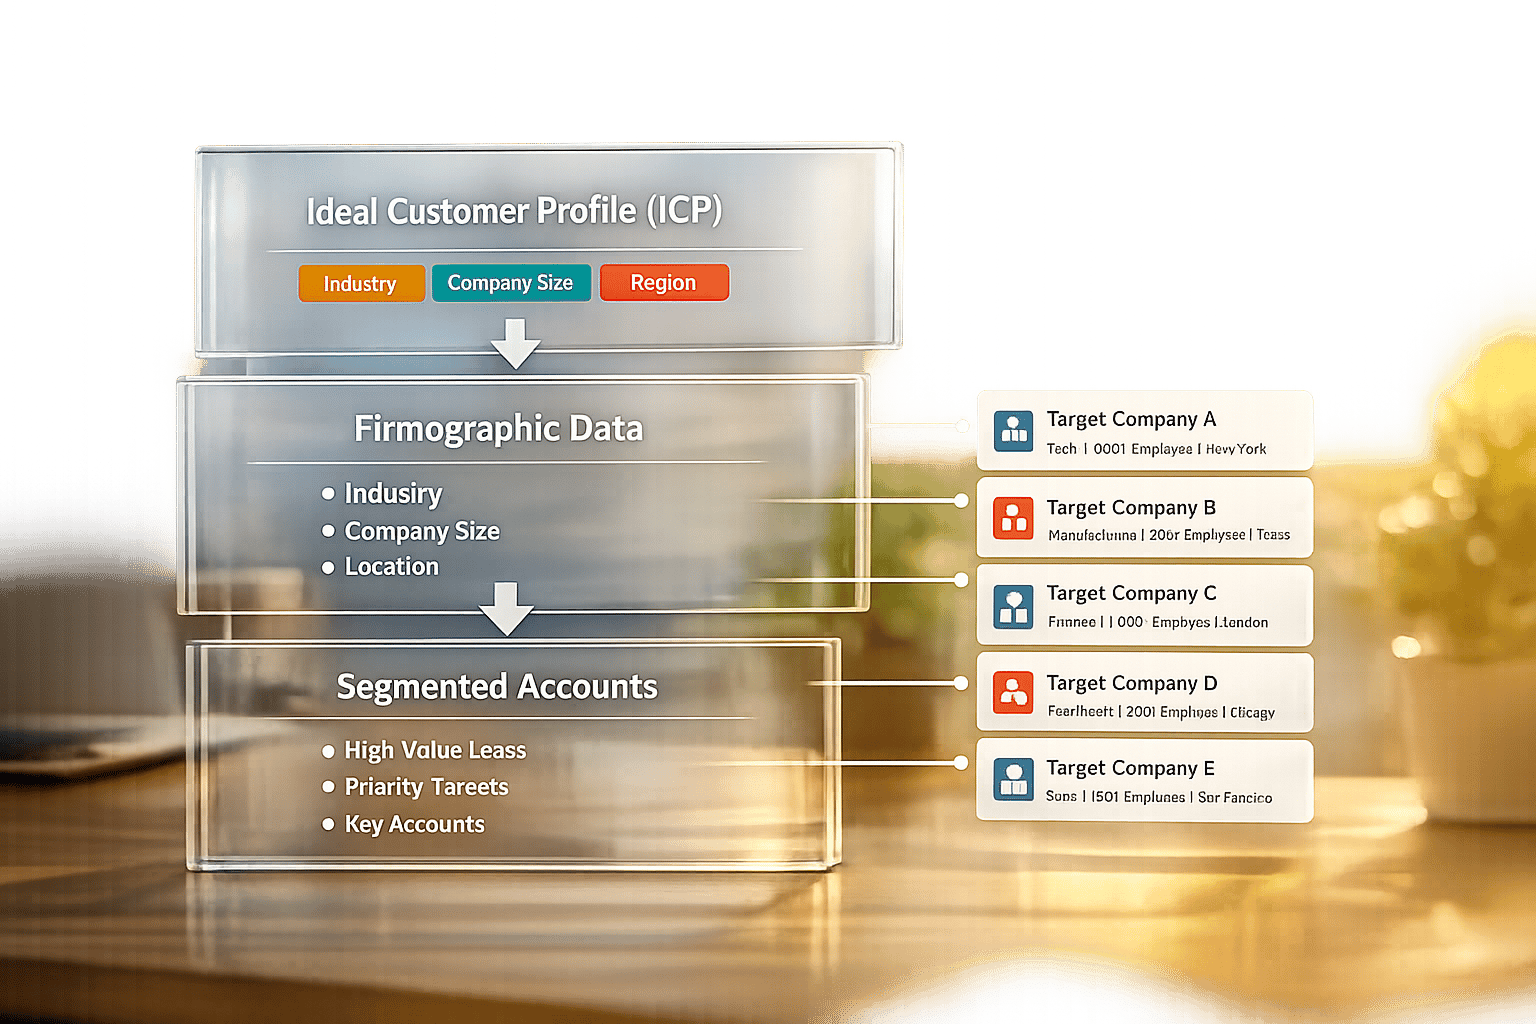
Firmographic attributes are essential for effective B2B targeting. These data points reveal a company's buying potential and readiness, helping businesses prioritize leads and optimize their sales efforts. The key attributes fall into three main categories: industry classification, company size and revenue, and geographic location. By focusing on these, sales teams can work smarter, not harder, aligning their efforts with prospects that fit their Ideal Customer Profile (ICP). In fact, companies that use at least 10 firmographic attributes to qualify leads have been shown to cut prospecting time by 40% [8].
Identifying a company's industry - whether it's SaaS, healthcare, manufacturing, or financial services - provides valuable insights into its challenges, regulatory environment, and buying patterns. For example:
This understanding allows for personalized messaging that resonates with the unique needs of each sector, ultimately improving conversion rates [8].
A great example of this approach is Veeva's 2025 partnership with MyOutreach. By replacing outdated vendor data with accurate, verified firmographic data, Veeva targeted 489 companies that matched their ICP. This shift enabled precise outreach tailored to each industry's needs, significantly boosting their campaign effectiveness [6].
A company's size and annual revenue offer insights into its complexity and purchasing power. These factors also shape the sales approach:
Revenue provides another critical layer of insight, helping sales teams determine whether a prospect can realistically afford their solution. On average, companies allocate 3.2% of their revenue to technology [8], offering a useful benchmark for budget expectations.
For instance, in 2025, a $300 million cybersecurity SaaS company used firmographic data to identify its most profitable segment: healthcare and finance companies with 200–1,000 employees. This "Regulated Mid-Market" segment had a 25% win rate and an average deal size of $180,000. By reallocating 25% of their marketing budget to this segment, the company increased their pipeline by 41% and shortened sales cycles by 18% within two quarters [2].
A company's location adds another dimension to firmographic data, influencing territory planning, compliance, and communication. This includes data on headquarters, regional offices, and overall operational footprint.
Geographic attributes affect time zones, language preferences, and local regulations. For instance, demand patterns can vary widely - what works in the Northeast might not resonate in the Southwest. Location data also helps sales teams localize their outreach and assign territories more effectively.
For growth-stage companies, geographic signals can highlight opportunities. Businesses expanding into new regions often require infrastructure and tools to support their growth, making location data a valuable indicator for timing sales outreach [7][4].
How to Use Firmographics for B2B Sales: 3-Step Process
Now that you’ve got a handle on the key firmographic attributes, it’s time to turn that knowledge into action. These three steps will help transform raw data into a focused sales strategy, ensuring you’re targeting the right accounts at just the right time.
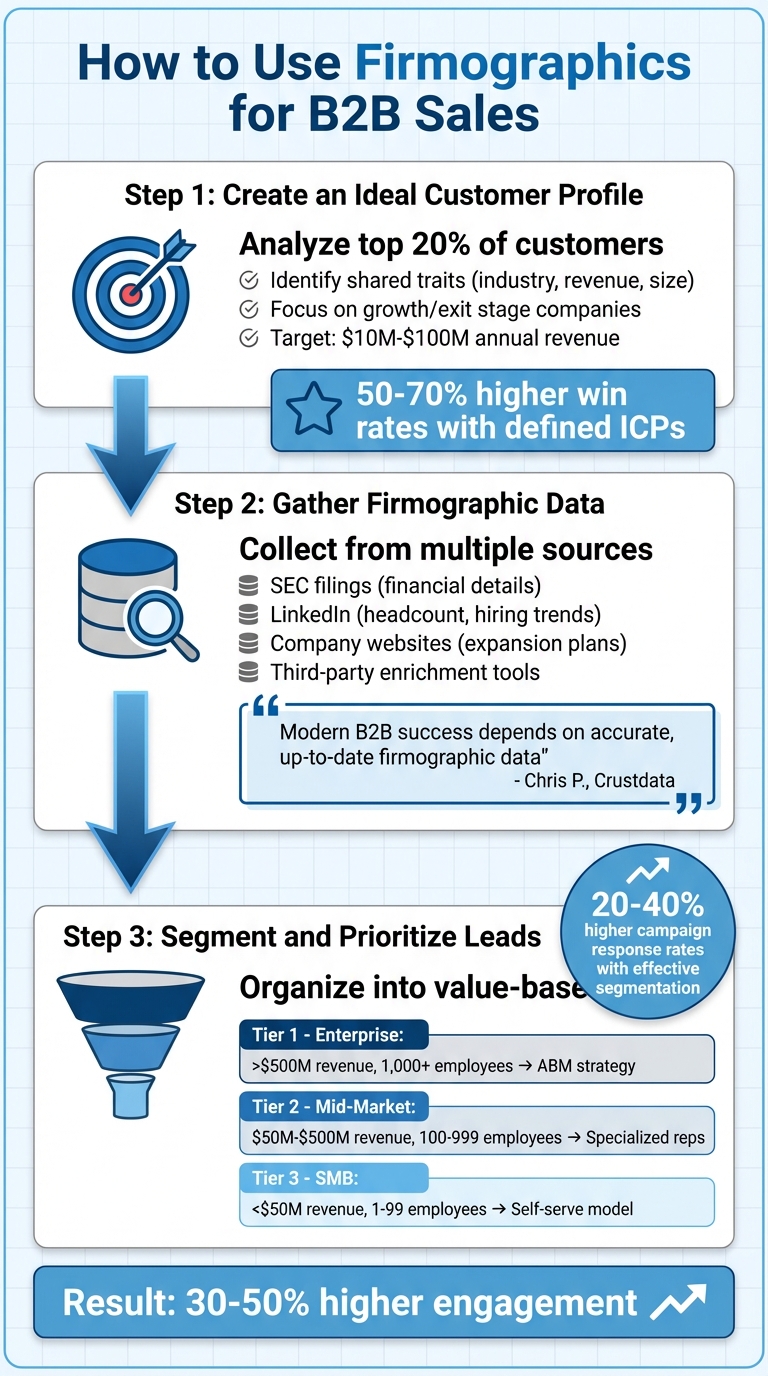
Start by analyzing the top 20% of your customers. Look for shared traits - like industry, revenue, and company size - that align with the firmographic attributes we discussed earlier. This method helps you zero in on what’s already working. For example, focus on commonalities such as industry verticals, revenue ranges, employee numbers, or growth stages [1].
If your service is something like fractional CFO support or M&A advisory, you might want to narrow your focus even further. Target companies in growth or exit stages, those with annual revenue between $10 million and $100 million, or businesses that recently secured funding [9][1]. Companies with well-defined ICPs often see win rates increase by 50-70%, compared to those casting a wider net [1].
Once you’ve nailed down your ICP, it’s time to gather the data you’ll need to start targeting effectively.
Accurate data is the cornerstone of precise targeting. To get a complete picture, pull information from multiple sources. For instance:
Third-party tools can make this process easier by enriching your CRM data automatically. However, don’t forget to manually verify critical information for high-value accounts. For example, check press releases or annual reports before committing to costly campaigns [1][2].
"Modern B2B success depends on having accurate, up-to-date firmographic data that allows precise targeting and personalization at scale." - Chris P., Writer, Crustdata [3]
Once your data is verified and ready to go, the next step is segmentation.
With your data in hand, organize your prospects into tiers based on their firmographic details and potential value. This segmentation ensures your sales strategy matches the complexity of each account. For example, enterprise-level deals may require senior reps and highly customized approaches, while smaller accounts can benefit from quicker, more transactional processes [1][10].
| Tier | Revenue Range | Employee Count | Sales Potential | Recommended Strategy |
|---|---|---|---|---|
| Tier 1: Enterprise | >$500M | 1,000+ | High (Large Deals) | Account-Based Marketing (ABM), custom pricing, senior rep assignment |
| Tier 2: Mid-Market | $50M - $500M | 100 - 999 | Medium | Standardized enterprise features, specialized mid-market reps |
| Tier 3: SMB | <$50M | 1 - 99 | Low (High Volume) | Self-serve models, automated nurture, transactional sales motion |
To take it a step further, integrate firmographics into your lead scoring model. For instance, assign extra points for prospects that align with your target industry or fall within your ideal revenue range. Adding 20 points for industry alignment and 15 points for revenue fit can help you prioritize high-value accounts [4][1]. Effective segmentation like this can boost campaign response rates by 20-40% and drive 30-50% higher engagement [9].
When working with segmented leads, firmographics take personalization to the next level. Generic outreach simply doesn’t cut it - it overlooks the unique challenges and priorities of each prospect. By tailoring your messaging based on factors like company size, stage, and industry, you demonstrate a deeper understanding of their world. In fact, by 2025, 60% of B2B sales organizations are expected to shift from intuition-based selling to data-driven approaches, making firmographic insights a key advantage [12].
The trick lies in aligning your pitch with the prospect’s operational priorities. For example, SMBs often value ease of use and quick implementation, while enterprise-level accounts focus on ROI, security, and long-term value [1][6]. Companies that embrace this data-driven personalization approach have reported 5-8x growth in ROI compared to using generic outreach strategies [11]. By addressing the specific growth challenges of each prospect, you’re not just selling a service - you’re offering a solution that feels tailor-made.
Growth-stage businesses, particularly those backed by venture capital, are often in rapid expansion mode. They’re hiring aggressively, entering new markets, or gearing up for the next funding round. These companies need tools that focus on agility, fast ROI, and seamless integration rather than long-term stability [2].
Let’s say you’re targeting a company that recently closed a Series B funding round and grew its workforce by 50% in six months. Your pitch could highlight how your fractional CFO services simplify cash flow forecasting and help prepare financial models for their next funding milestone. Companies showing signs of growth - like funding events, hiring surges, or new office launches - are often in "buy mode" and more receptive to solutions that support their scaling efforts [3][5]. On the other hand, bootstrapped or mature companies are likely to prioritize cost-efficiency and operational savings over rapid growth [1]. By tailoring your messaging to these distinct priorities, you can align your services with their immediate and long-term needs.
Firmographic insights also guide you in offering the right services for each prospect. Using vertical-specific proof points, such as ROI stats or case studies, can significantly increase engagement [1][3].
Service needs evolve with company size. For instance:
Once you’ve implemented firmographic targeting, it’s crucial to monitor how well it’s working. A key metric to watch is the win rate by segment - the percentage of closed deals within specific firmographic tiers like enterprise or SMB. Companies that build well-defined Ideal Customer Profiles (ICPs) using firmographic data often achieve win rates that are 50–70% higher compared to those targeting more broadly [1].
Another important metric is average deal size (ACV), which helps gauge whether your prospects have the purchasing power to meet your goals. By analyzing ACV across segments such as industry, revenue range, or employee count, you can uncover trends that guide better targeting. Similarly, sales cycle length can vary significantly by segment; enterprise deals, for instance, often take longer due to the involvement of larger, more complex buying committees [14][4].
You should also track funnel conversion rates at every stage. Measure how leads move from Marketing Qualified Lead (MQL) to Sales Accepted Lead (SAL), then to Sales Qualified Lead (SQL), and finally to Closed/Won. A strong SAL-to-SQL conversion rate indicates that your firmographic scoring is effectively filtering out low-potential leads. Interestingly, organizations that combine firmographic data with technographic and intent signals can see deal sizes grow by as much as 73% [1].
By analyzing these metrics, you can continually refine your ICP and improve your overall strategy.
Your Ideal Customer Profile isn’t set in stone - it should change as you collect and analyze new performance data. In fast-paced markets, refresh your ICP quarterly, or at least every six months [15][16]. A good starting point is conducting a lift analysis, which compares the performance of accounts that match specific firmographic traits to those that don’t. This can highlight high-performing segments to prioritize.
You should also establish a negative ICP to document segments that consistently underperform. For instance, if certain industries or smaller companies result in lower deal sizes, longer sales cycles, or higher churn, make a note of these patterns so your team can avoid chasing low-potential prospects [15][17].
Keeping your data clean and up-to-date is equally important. Data decay can undermine targeting accuracy, so regular validation and cleaning are essential.
"Start with outcomes - Optimize for win rate, ACV, cycle time, CAC/payback, and NRR - not leads." - The Pedowitz Group [15]
Finally, create feedback loops with your sales team. They can flag any inaccuracies in firmographic data, such as outdated revenue figures, incorrect employee counts, or misclassified industries. Use their input to refine your scoring models and cross-check data from multiple providers to maintain accuracy [1][13].
Firmographics help B2B sales teams zero in on the right accounts, making it easier to close deals. By building an Ideal Customer Profile (ICP) with key attributes like industry, company size, revenue, and location, teams can weed out low-value prospects and focus their efforts where they’ll have the greatest impact. This approach leads to noticeably higher win rates.
Here’s how to make it work: start by analyzing your best customers to define your ICP, collect accurate firmographic data from trusted sources, segment and prioritize leads based on how well they align with your profile, and customize your messaging to address the unique needs of each segment. For growth-stage companies, this means aligning sales strategies with the specific challenges and buying behaviors of businesses in similar stages of development.
This isn’t a one-and-done process. Markets shift, and data becomes outdated surprisingly quickly - about every year, in fact [1][7]. Teams that refresh their ICPs quarterly see a 9.7% higher pipeline creation rate compared to those that only update once a year [19]. Tracking metrics like win rates, deal sizes, and sales cycle lengths for each segment helps pinpoint what’s working and where adjustments are needed. This continuous improvement ties back to the initial steps of segmentation and ICP updates.
"Precision is the ultimate competitive advantage. Trying to sell your complex solution to every company that shows slight interest is a fast track to resource drain." - Author B2B [18]
Firmographics refer to a company’s outward characteristics, such as its industry, revenue, size, location, and organizational structure. These details are crucial for segmenting and targeting businesses effectively. On the other hand, technographics dive into the internal technologies and tools a company relies on, such as CRM systems, marketing platforms, or cloud service providers.
Intent data adds another layer by tracking signals that indicate interest or purchase intent. Often derived from online behavior, this data helps pinpoint prospects actively researching products or solutions.
When combined, these three data types - firmographics, technographics, and intent data - help sharpen B2B sales strategies, making outreach more focused and relevant.
To ensure firmographic data is accurate when sources provide conflicting information, it's crucial to cross-check details across multiple trustworthy sources. These might include company databases, official websites, or recently published reports. Always prioritize data that is both current and comes from reliable origins. Focus on verifying essential details like the company's industry, size, and location.
If inconsistencies remain after thorough research, reaching out to the company directly can help clear up any confusion. Taking these steps ensures precise targeting and smarter prioritization in your B2B sales efforts.
Key firmographic attributes for lead scoring include company size, industry, revenue, location, ownership structure, growth trajectory, and buying center presence. These elements are essential for identifying and prioritizing leads, ensuring sales teams focus their efforts on opportunities with the greatest potential.