Published on
June 7, 2026


AI is transforming financial planning and analysis (FP&A) by automating forecasts, improving accuracy by up to 25%, and reducing manual work by 82%. Yet, only 32–38% of teams currently use AI, though 65–70% of CFOs plan to invest in it soon. This article reviews 10 AI tools designed for U.S. finance teams, focusing on features, pricing, and integrations. Here's a quick overview:
These tools cater to various needs, from startups to enterprises, with options for fractional CFO services or self-service SaaS platforms. Clean data and human oversight remain critical for successful implementation.
Traditional FP&A processes often focused on analyzing past performance instead of predicting future trends. Now, modern AI tools are flipping the script. By pulling data from ERP, CRM, and HRIS systems, these tools create rolling, automatically updated forecasts that replace outdated annual budgets. This evolution introduces four transformative capabilities that are reshaping forecasting.
For growth-stage companies, these advancements pack a punch: Predictive forecasting leverages machine learning to pinpoint critical operational drivers - like churn rate, sales pipeline velocity, and revenue per sales rep - boosting revenue forecast accuracy by an impressive 20–30% [4]. Scenario planning allows businesses to quickly test assumptions, such as the impact of a 10% headcount reduction or a pricing adjustment, in just minutes instead of days. Anomaly detection steps in to identify unusual spending patterns or unexpected cash outflows in real time, well before they’re flagged in a quarterly review. And automation takes over time-consuming tasks like AP processing, month-end close, and budget-to-actuals reconciliation - freeing up to 45% of a finance professional's time [5].
"The bottleneck in most finance workflows is not analysis. It is the operational overhead that surrounds analysis... Agentic AI is the first category of software that can take on that overhead directly." - Aleph [6]
Startups, in particular, benefit immediately from these capabilities, especially in cash runway planning. However, there's a caveat: AI is only as effective as the data it relies on. As Alliance Group warns, "Automation built on top of a broken data foundation doesn't produce better forecasts. It produces faster wrong answers." [7]
Phoenix Strategy Group offers solutions by integrating real-time ERP dashboards with machine learning-driven cash risk models. These tools can identify six-week cash shortfalls, delivering both technical infrastructure and strategic insights - all without requiring additional headcount.
Aleph is reshaping the way FP&A teams handle traditional spreadsheet workflows by bringing AI into the mix. Unlike other platforms, Aleph keeps things simple by integrating directly with tools like Excel and Google Sheets, making it easier for teams to adapt. This AI-native FP&A platform takes a "spreadsheet-first" approach, allowing teams to stick with the tools they already know while automating complex data tasks. It serves as a central hub, pulling live data from systems like ERP, CRM, and HRIS through 150+ no-code connectors and delivering that information straight into familiar spreadsheet interfaces.
With AI Scan, Aleph quickly detects variances, pinpoints root causes, and explains financial changes in just seconds. For example, it can identify that 85% of a revenue drop is due to smaller deal sizes in a specific segment. It doesn’t stop there - automatic narrative generation turns raw numbers into polished, presentation-ready insights. The Aleph Agent adds another layer of convenience, enabling stakeholders to ask questions directly in Slack or Microsoft Teams and get instant, auditable responses.
The platform’s impact is clear in real-world use cases: Zapier reduced its reporting time by 80% by consolidating data from seven accounting systems [9]; Chess.com cut its month-end close cycles by 70% [9]; and Harvey slashed reconciliation tasks by 90% [9].
"Aleph added the output of at least one analyst without hiring anyone, and by the end of this year, it will be two." - Axel Amar, Sr. Director of FP&A [10]
Aleph’s pricing typically ranges from $20,000 to $40,000 annually for mid-market deployments, with first-year costs (including implementation) between $30,000 and $60,000 [9]. Most teams can get the platform up and running within 4–8 weeks, a much faster timeline compared to traditional systems. It's a great fit for mid-market companies (with $10M–$500M in revenue and 100–2,000 employees) looking to streamline fragmented data without giving up their tried-and-true spreadsheet workflows.
Datarails takes an Excel-centered approach, enhancing its capabilities far beyond standard FP&A tools. In March 2026, they introduced FinanceOS, a platform that integrates your existing Excel models with real-time financial data while supporting external AI tools like Claude, ChatGPT, and Microsoft Copilot.
"You no longer need traditional FP&A tools to build models or run analysis. AI engines like Claude in Excel can generate sophisticated financial models in seconds. But intelligence is no longer the limit - infrastructure is." - Didi Gurfinkel, CEO and Co-Founder, Datarails [11]
Datarails provides three specialized AI Finance Agents:
The platform includes 600+ pre-built connectors for systems like ERPs (NetSuite, SAP, QuickBooks), CRMs (Salesforce, HubSpot), and HRIS platforms. It consolidates data across more than 40 entities, with implementation timelines of 4–6 weeks for reporting and 3–4 weeks for budgeting and planning.
A standout feature of Datarails is its exclusive compatibility with Excel, maintaining enterprise-grade governance while allowing users to stick with their familiar workflows. This makes it an excellent choice for U.S. finance teams managing complex, multi-entity consolidations without needing to overhaul existing models.
Datarails uses a usage-based pricing model, aligning costs with the value delivered rather than charging per user. Typical annual contract values include:
The median annual contract value is $33,300, with discounts of 15–25% available for multi-year agreements [12].
Datarails is ideal for companies with 50 to 2,000+ employees across sectors like construction, manufacturing, technology, and retail. It’s particularly well-suited for teams tackling complex, multi-entity consolidations while relying on their established Excel models.
Planful is designed for mid-market to enterprise FP&A teams that have outgrown spreadsheets and need a more structured and collaborative planning tool. It's trusted by over 1,500 companies worldwide [17][19], offering AI capabilities that go far beyond basic automation. Let’s break down the features that make Planful stand out in the world of advanced forecasting.
At its core, Planful’s AI features include Predict: Projections and Predict: Signals. Predict: Projections uses machine learning to generate accurate forecasts based on three years of data, employing an ALGO mode that automatically selects the best model. Meanwhile, Predict: Signals works continuously to identify anomalies, broken formulas, and material variances, helping teams focus on what matters most [14][13][15].
"It's quite literally using signals, highlighting those variances to point out these are the variances you need to look at." - Robert Franz, Senior Reporting & Systems Analyst [13]
Planful integrates seamlessly with major ERP systems like Oracle NetSuite, SAP, Sage Intacct, Workday, and Microsoft Dynamics. It also connects with Salesforce and Microsoft Power BI [17][20]. Additionally, its Microsoft 365 add-in allows users to pull live data into Excel, Word, and PowerPoint with just one click. This feature is especially helpful for teams transitioning from spreadsheets. For example, Lauren Bissell, FP&A Manager at GSF, shared that Planful reduced 12 hours from every four-week close cycle and sped up quarterly business reviews by 50% [16]. These integrations simplify FP&A workflows, providing a clearer picture of costs and performance.
Planful’s pricing is modular and quote-based, with no public rates available. However, here’s a typical breakdown of annual costs [21]:
| Deployment Tier | Typical User Count | Estimated Annual Cost (USD) |
|---|---|---|
| Small/Mid-Market | 10–50 users | $50,000 – $150,000 |
| Mid-Market/Enterprise | 50–200 users | $150,000 – $350,000 |
| Large Enterprise | 200+ users | $350,000+ |
The Predict AI add-on costs an additional $13,000–$32,000 per year, and first-year implementation expenses can increase the total by 30%–100% [18][21]. Timing your purchase strategically - like negotiating in late Q3 or Q4 - can lead to discounts of up to 15%. Bundling extra modules, such as Workforce Planning, during the initial agreement can also cut incremental costs by 20%–30% [21].
Workday Adaptive Planning is designed for mid-sized to large enterprises, with over 7,000 teams currently using the platform [22]. Even for complex enterprise setups, the average deployment time is just 4.5 months [22].
The platform leverages AI to deliver precise forecasting tools. Its Predictive Forecaster uses historical data to automatically generate forecast versions, while the AutoFit algorithm evaluates models like ARIMA, Prophet, and LightGBM to select the most accurate one, removing the need for manual model selection. For teams looking to incorporate external factors - such as interest rates or market trends - Lever Sheets allow users to link up to three external data sources. This ensures forecasts are informed by both internal data and broader market dynamics.
The Planning Agent further enhances functionality by enabling users to run variance analyses and create "what-if" scenarios using plain-language prompts. No formulas or technical setups are required.
"The Planning Agent redefines our FP&A function. Now our leaders get instant, self-serve data access in plain English - for faster strategic decisions." - Group Head of Planning Cloud ERP, TX Group [2]
Workday Adaptive Planning integrates seamlessly with a range of systems, being ERP-agnostic. It works with any GL, CRM (like Salesforce), HCM, Snowflake, and Incorta. Its OfficeConnect feature allows live data syncing directly into Microsoft Excel, PowerPoint, Google Sheets, and Google Docs [23], making it especially handy for finance teams that rely on Office or Google Workspace tools. Additionally, all AI-generated outputs are governed under ISO 42001 standards, ensuring accountability and compliance.
Workday Adaptive Planning offers a quote-based pricing model tailored to an organization’s needs. It has two main packages: the core Workday Adaptive Planning for budgeting and forecasting, and Workday Adaptive Planning Close & Consolidation, which includes financial close capabilities. A 30-day free trial is available, complete with guided walkthroughs of the platform’s planning, reporting, and dashboard features [24]. Organizations can also purchase the platform through the AWS Marketplace, allowing them to use existing AWS spend commitments toward their subscription [24].
"With Workday Adaptive Planning, my team can complete a forecast cycle in 15–20% less time than before." - Vice President of Financial Planning and Analysis [22]
OneStream simplifies FP&A for mid-sized to large companies, especially those managing complex, multi-division operations. With over 1,800 companies worldwide using it, OneStream serves as a unified Corporate Performance Management (CPM) solution. It combines consolidation, planning, reporting, and analytics into one platform [1]. Its forecasting tools are particularly advanced, blending internal analytics with external data signals.
OneStream's SensibleAI™ portfolio is a standout feature. Here's what it offers:
These tools deliver tangible results, like a 25% boost in forecast accuracy and up to 85% faster forecasting cycles [1][25].
OneStream sets itself apart by integrating external data - like macroeconomic trends, weather patterns, and supply chain signals - directly into financial models. This ensures forecasts reflect real-world conditions. For example, Endeavour Energy experienced a significant improvement after implementing SensibleAI Forecast. Their forecast error margin dropped from 6% to 2%, resulting in $40 million in savings.
"Implementing SensibleAI Forecast improved our forecast error margin from 6% to 2%, translating to $40m in savings." - Rebecca Yu, Head of Commercial Finance, Endeavour Energy [25]
This ability to incorporate real-time external factors enhances the accuracy and practicality of OneStream's forecasts.
OneStream also excels in integration. It uses the Model Context Protocol (MCP) to securely connect with tools like Microsoft 365, Copilot, ChatGPT, and Claude [1]. It comes with a certified Power BI connector and allows drill-through from summary financials to transaction-level details [26][30]. Additionally, every AI-generated output includes traceable logic and audit trails, ensuring transparency and clarity [1][25].
OneStream's pricing is customized based on the organization's needs, with details typically shared during personalized demos. However, the average annual contract value is around $177,577, with costs reaching up to $290,000 per year for larger, more complex setups [29]. This makes it a strong choice for businesses transitioning from spreadsheets to a scalable, finance-managed platform.
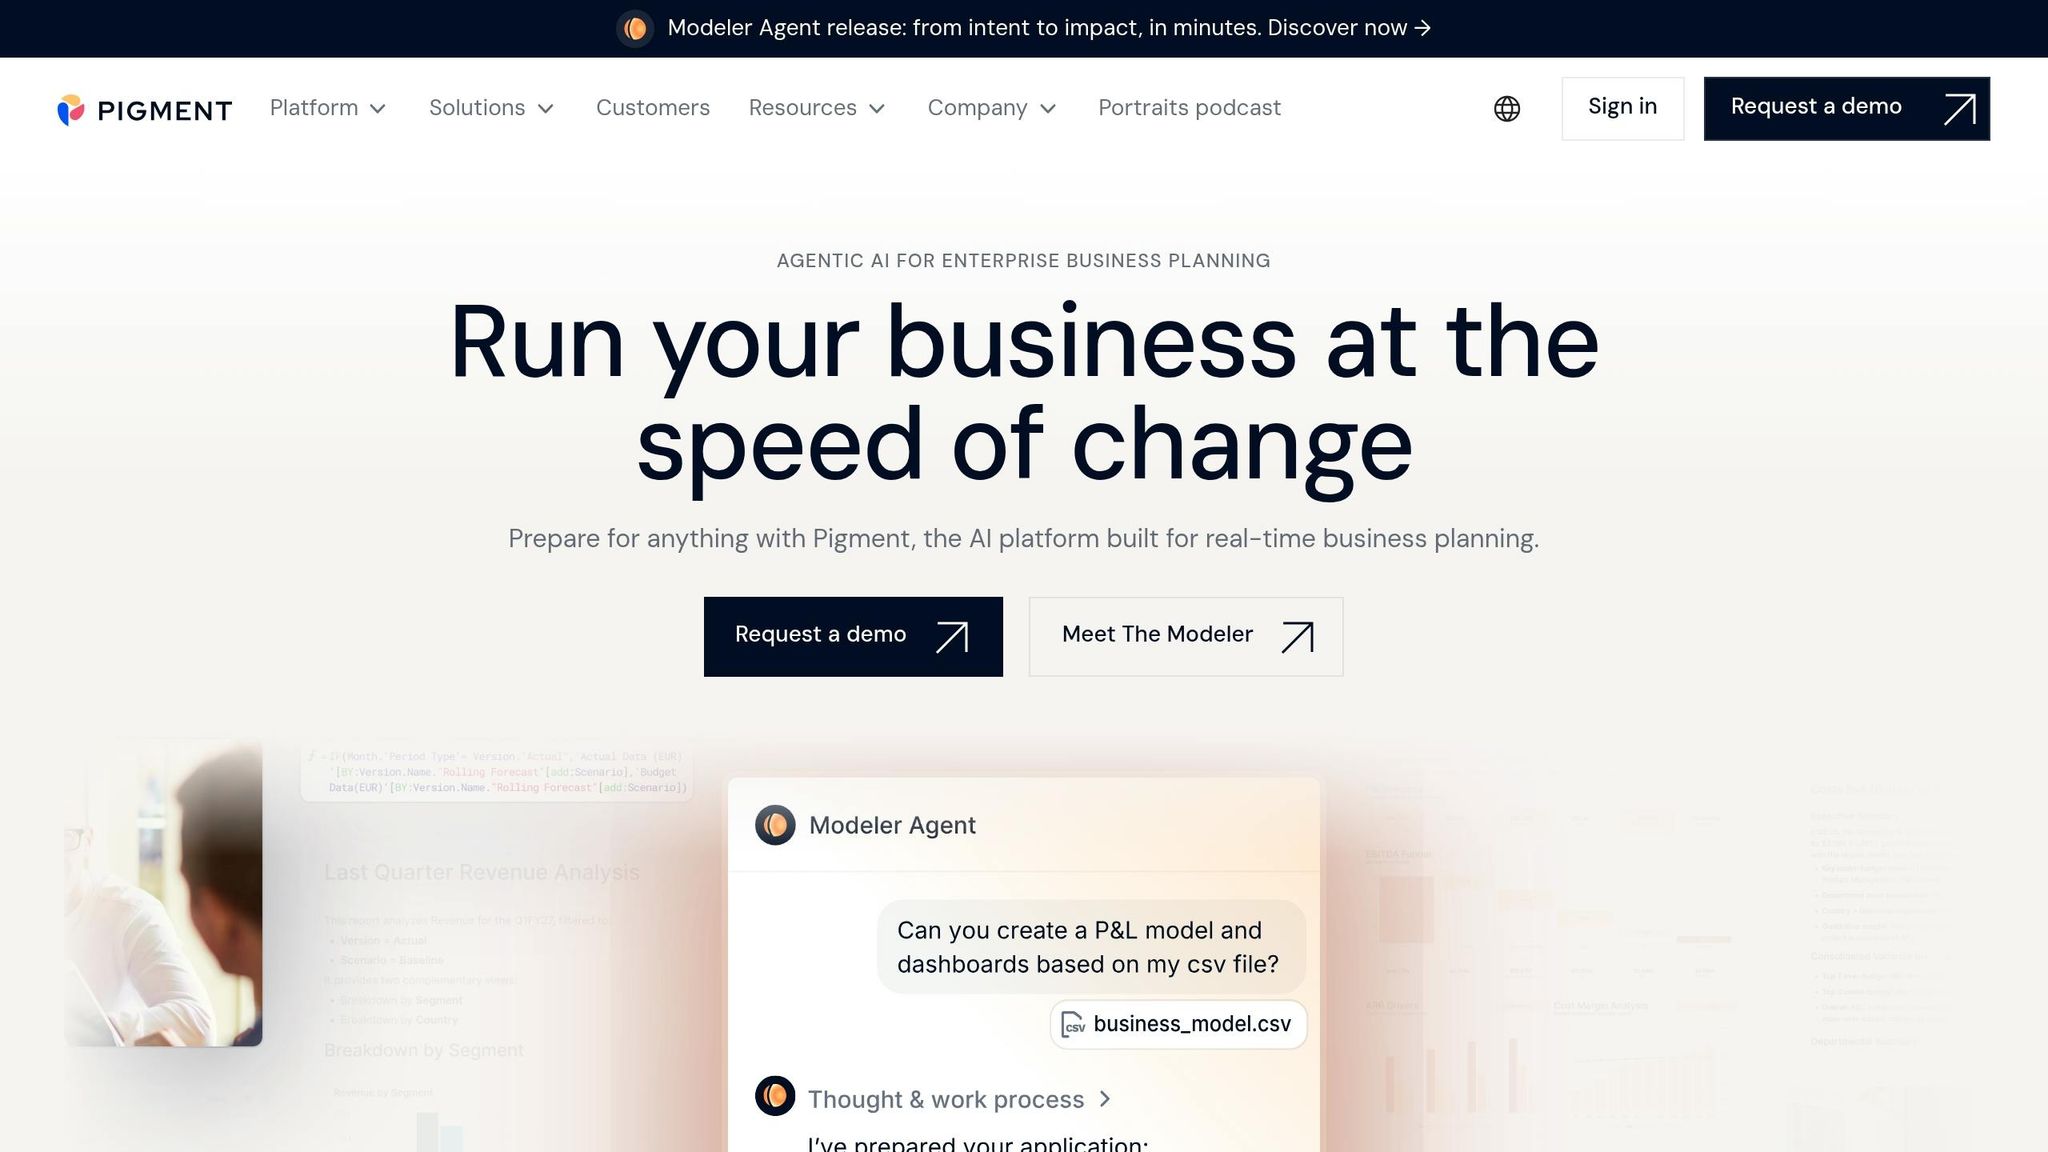
Pigment is designed for enterprise FP&A teams seeking a unified platform for connected planning across finance, sales, HR, and operations. Companies like Klarna and PVH have replaced over 100 manual spreadsheets with Pigment, enabling real-time scenario modeling and streamlined processes [36][37].
What sets Pigment apart is its Agentic AI Network, which simplifies and accelerates model creation. Here's how it works:
"The Modeler Agent has exceeded expectations. What used to take hours of designing, modeling and framework building can now be done in minutes." - Jack Silvert, Strategic Finance, Business Systems and Operations [33]
Pigment also excels at forecasting. Its Predictions feature leverages machine learning tools like Prophet for long-term trends and AutoETS for shorter-term data. It even integrates external factors such as marketing spend, promotions, and holidays to enhance accuracy. According to a Forrester study, Pigment delivers an average ROI of 306% over three years, reducing the time for financial forecasting updates from eight days to just four minutes [31][32].
Pigment connects with over 50 systems, making it highly adaptable to existing workflows. Supported integrations include:
Pigment doesn’t disclose pricing publicly, but typical costs align with its robust features. Mid-market teams generally pay between $30,000 and $60,000 annually, while enterprise deployments start above $100,000, with a median annual spend of $74,000 [38][39]. Implementation takes two to four months. This makes Pigment a great match for organizations with 1,000+ employees that need complex, cross-functional planning across multiple departments or regions.
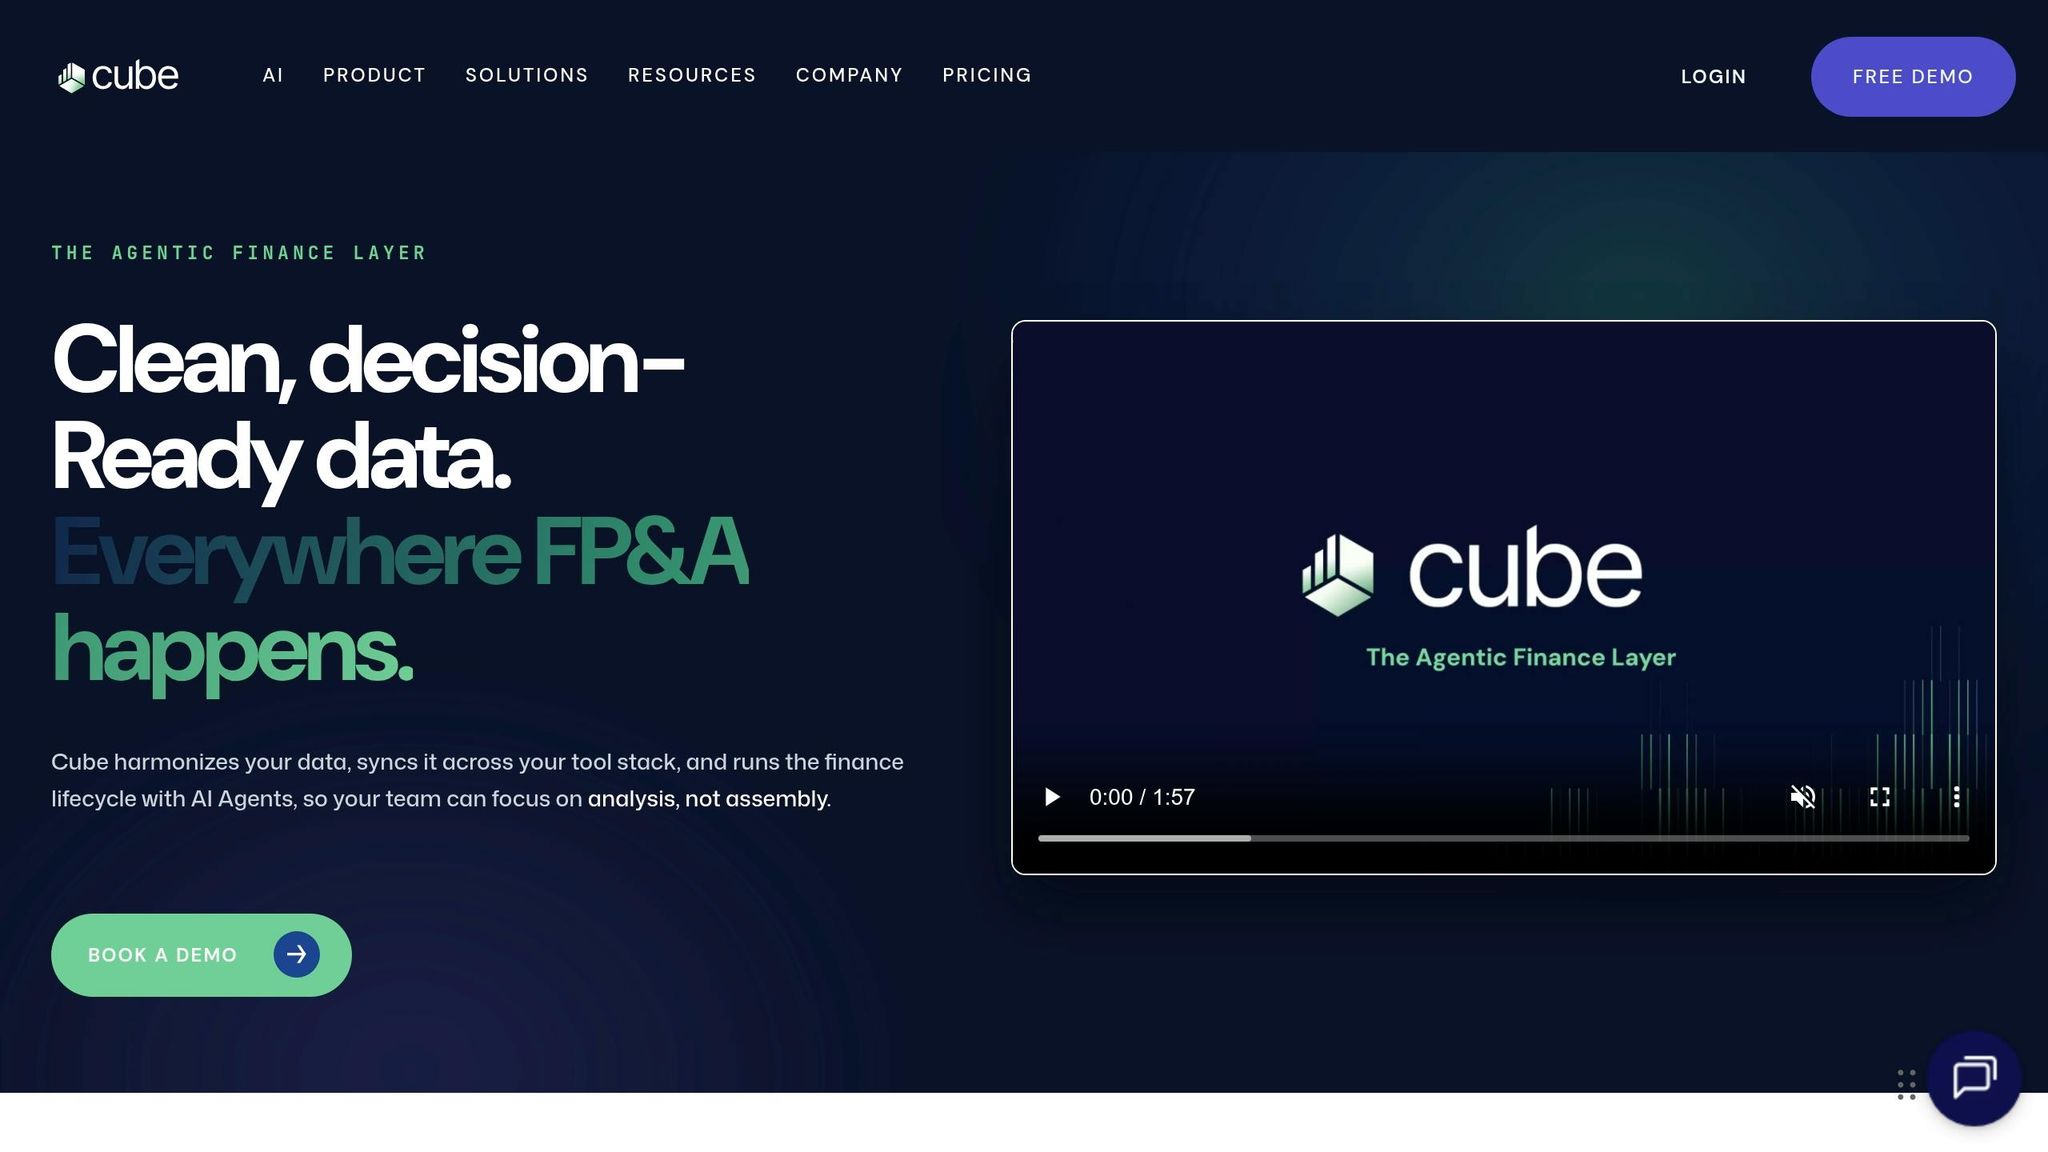
Cube is a great choice for mid-sized teams looking for a straightforward yet capable solution. It combines the familiarity of spreadsheets with the power of AI automation. Over 500 organizations, including Block, Wealthfront, and Cracker Barrel, trust Cube for their financial intelligence needs [41]. What makes Cube stand out? It keeps you working in Excel or Google Sheets while syncing your spreadsheets with a centralized data layer through its patented bi-directional sync. This setup preserves your existing workflow while introducing enterprise-level governance.
Cube's FP&Agent Suite features four specialized AI teams designed specifically for finance:
This approach reflects how AI is reshaping financial planning and analysis (FP&A). For example, Ryan Fanter, VP of Strategic Finance, noted that Cube helped reduce forecast variance from 15–20% to just 2–3% [40].
Cube's Trace to Truth architecture ensures every AI-driven output is linked directly to a General Ledger transaction. This eliminates the "black-box" problem, providing full transparency. Additionally, Cube can connect governed financial data to external AI tools like Claude, ChatGPT, Microsoft Copilot, and Gemini through its MCP Server. This means these tools use your actual cost formulas and hierarchies instead of generic data.
Cube seamlessly integrates with over 50 tools, covering the essential platforms used by mid-market finance teams:
| Integration Category | Supported Tools |
|---|---|
| ERP / GL | NetSuite, Sage Intacct, QuickBooks, Microsoft Dynamics, Xero, SAP |
| CRM | Salesforce, HubSpot, Pipedrive |
| HRIS | Workday, ADP, BambooHR, Rippling, Gusto |
| Data Warehouse | Snowflake, BigQuery, Amazon Redshift |
| AI Assistants | Claude, ChatGPT, Microsoft Copilot, Gemini |
| Collaboration | Slack, Microsoft Teams |
These integrations streamline workflows, making it easier to manage data across your finance stack.
Cube's pricing starts at $32,000 annually, with most deployments for mid-market teams ranging from $50,000 to $150,000 per year. Implementation typically takes 6–10 weeks [42][43]. It’s an excellent fit for companies with 50+ employees that need automated financial consolidation and AI-driven forecasting while maintaining their existing spreadsheet workflows.
"Now with Cube, we spend more than half our time on strategic work - partnering with the business instead of cleaning up the numbers." - James Mann, CFO [3]
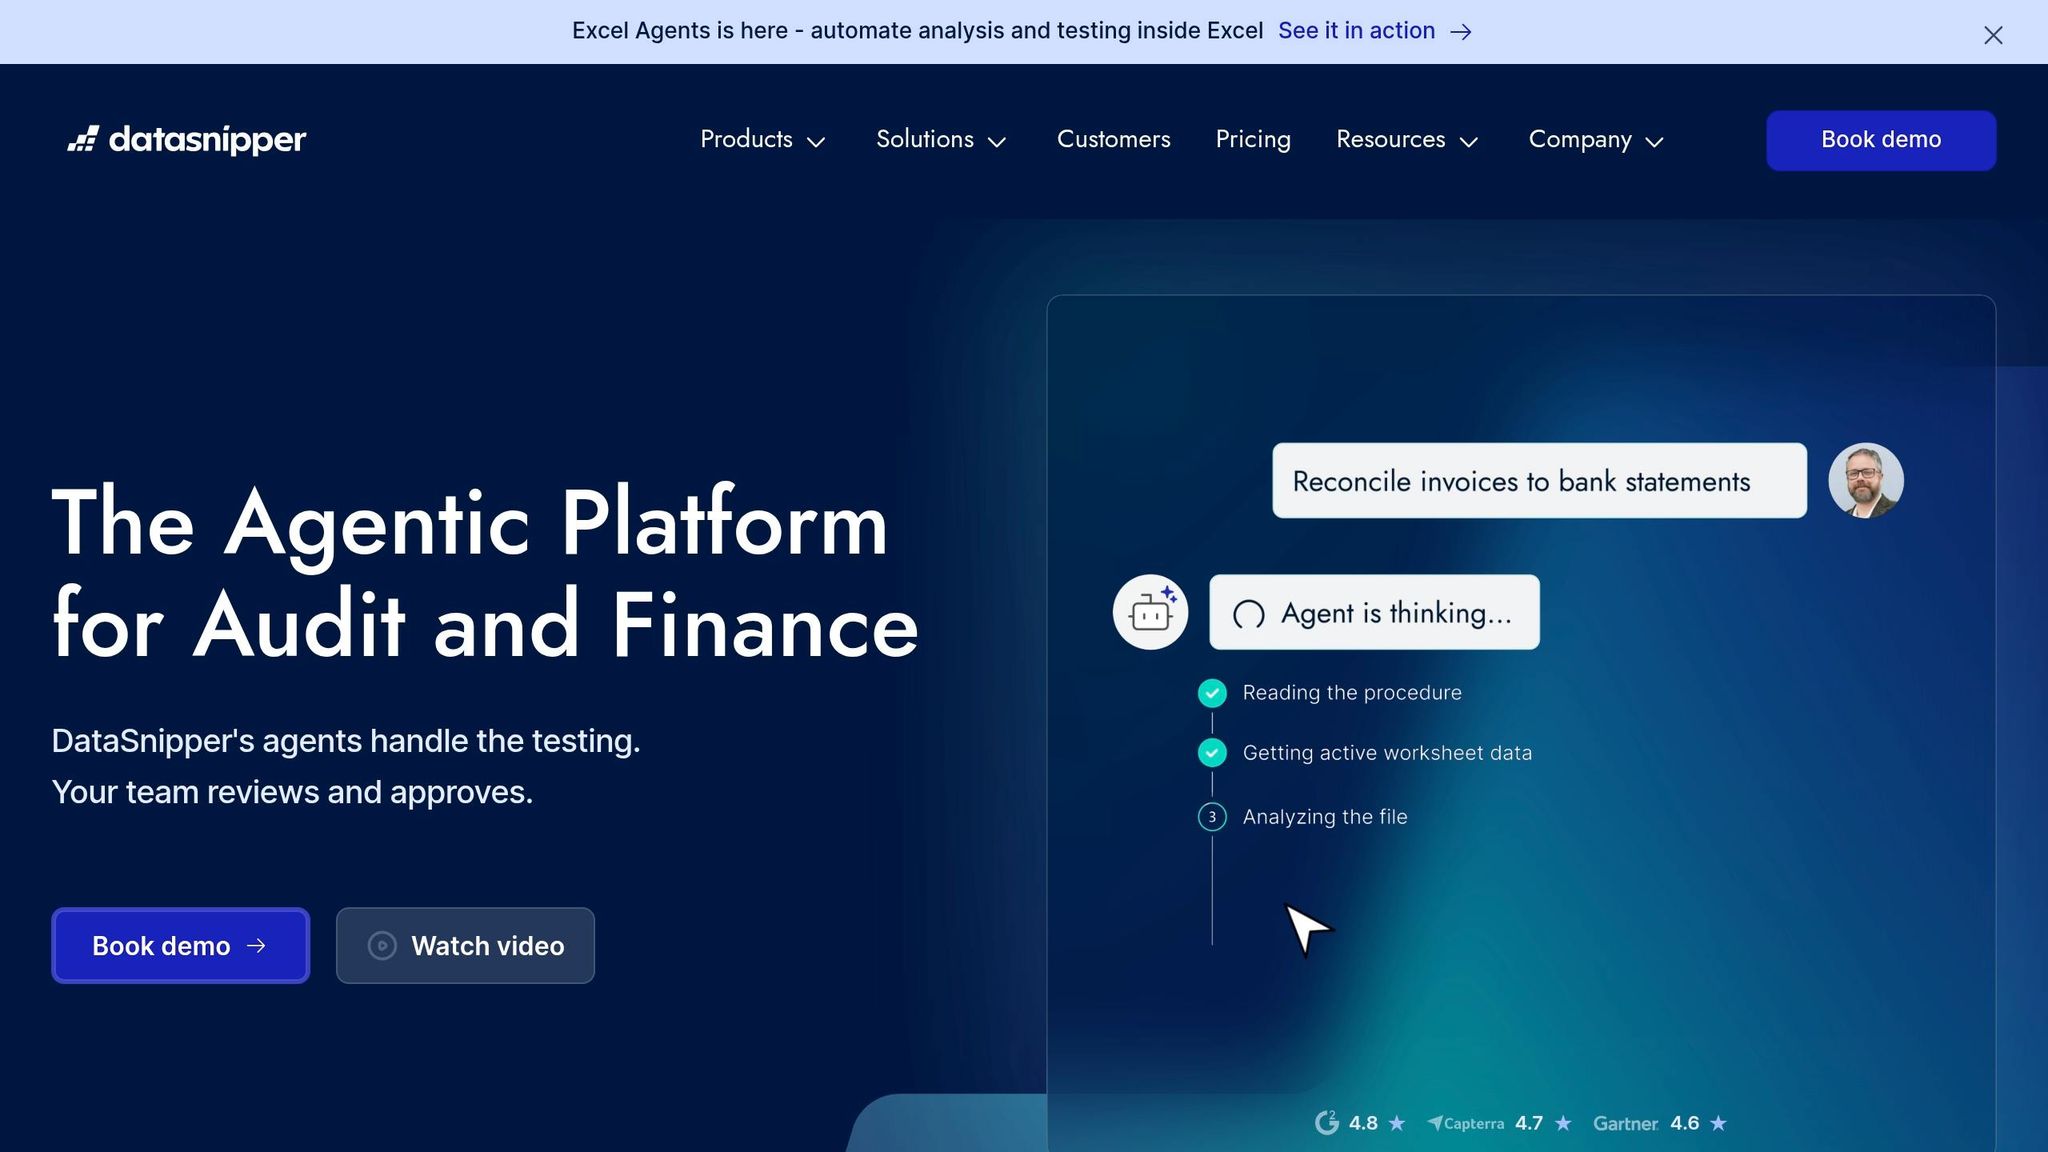
DataSnipper stands out by integrating directly into Excel. As an Excel add-in, it uses AI to streamline tedious financial analysis tasks like extracting data from PDFs, matching figures to their sources, and identifying anomalies before they impact forecasts. Over 600,000 professionals, including teams from the Big Four accounting firms (Deloitte, EY, KPMG, and PwC), rely on this tool [44]. Let’s look at how it simplifies data extraction and validation within Excel.
DataSnipper turns unstructured documents into actionable data. Its DocuMine feature pulls critical figures from sources like bank statements, contracts, and quarterly reports. AI Extractions processes and cleans scanned data, while Excel Agents handle variance checks and reconciliations automatically. To ensure transparency, every AI-generated result is connected back to its original document through a Connected Trust Layer, making your forecasting data both traceable and audit-ready.
"Amazing efficiency tool embedded directly in Excel. Revolutionized our internal audit processes as well as external audit." - Michael P., Verified Reviewer, Logistics and Supply Chain
The Start plan for DataSnipper is priced between $55–$64 per user/month. For more advanced features like DocuMine, enhanced AI capabilities, and enterprise-level security (including Azure AD directory sync), the Accelerate and Elevate tiers are available through custom pricing. A 14-day free trial is offered, but some users mention a minimum purchase of five licenses, which might be a hurdle for smaller teams [45].
This tool is best suited for mid-to-large FP&A teams that spend significant time collecting data and validating documents before diving into analysis. If your team is still manually transferring numbers from PDFs into Excel, DataSnipper can save hours of prep work, ensuring your forecasts are both faster and more accurate.

If your organization relies heavily on the Microsoft ecosystem, integrating Power BI with Copilot is a logical step for FP&A. Instead of adopting a separate forecasting tool, you can enhance your current setup by linking actuals, budgets, and forecasts through OneLake, Microsoft’s unified data layer. This eliminates the need for manual reconciliations and ensures a streamlined workflow. By leveraging OneLake, Power BI fits seamlessly into your existing Microsoft environment, enabling efficient, real-time forecasting.
With Copilot, you can query financial data using natural language, automatically generate DAX measures, and create narrative summaries to explain variances. On the forecasting front, Power BI uses statistical models to analyze historical data and predict revenue and cost trends. These projections update continuously as new transactions are recorded. Organizations using Microsoft Fabric for planning have reported an average 379% ROI over three years, and AI-driven models have been shown to reduce planning cycles by up to 70% [46].
Power BI’s tiered licensing structure ensures flexibility, allowing you to pay based on your needs:
| License Type | Monthly Cost (USD) | Copilot Included? | Best Fit |
|---|---|---|---|
| Power BI Pro | $14.00/user | No | Basic visualization for small teams |
| Premium Per User (PPU) | $24.00/user | Yes (with Fabric trial) | Individual power users and analysts |
| Fabric F64+ Capacity | $5,258.88+ | Yes | Large enterprises with broad self-service needs |
For smaller teams, the Premium Per User plan at $24.00 per user per month offers access to advanced AI tools without requiring a large capacity commitment. Larger enterprises needing organization-wide Copilot access, including free license users for report viewing, will require the F64+ tier [47].
Power BI with Copilot is particularly suited for mid-market and enterprise organizations in industries like manufacturing and professional services. These features allow businesses to scale planning processes without increasing headcount. A useful tip: before enabling Copilot, rename technical column names (e.g., change "SLS_AMT" to "Sales Amount") and add table descriptions. This can improve DAX generation accuracy by 15–20% [48]. While AI provides the baseline, your FP&A team retains control over final assumptions. Together, Power BI and Copilot offer a scalable solution for FP&A in mid-size to large enterprises.
Phoenix Strategy Group takes a hands-on approach to AI forecasting, positioning itself as an AI-enabled advisory partner rather than just offering a standalone SaaS tool. Their focus is on embedding forecasting capabilities directly into a company's existing financial systems, backed by expert guidance to ensure actionable insights.
The firm specializes in building an AI-native finance infrastructure, using machine learning and driver-based models to forecast key metrics like revenue, cash runway, and SaaS-specific indicators such as ARR, MRR, CAC payback, and churn. This system integrates seamlessly with tools that U.S. growth-stage companies already rely on. Instead of static annual budgets, forecasts are updated on a rolling monthly or weekly basis. Automated variance analysis helps pinpoint problem areas, such as unexpected spending spikes or underperforming revenue streams, enabling finance teams to address critical issues more effectively.
"AI-native companies will outpace everyone else by building connected systems, centralized operational intelligence, and real-time decision infrastructure into the core of the business rather than treating AI as another disconnected productivity tool." - Phoenix Strategy Group [8]
Phoenix Strategy Group works with widely used platforms like QuickBooks Online, NetSuite, Salesforce, HubSpot, Stripe, Chargebee, and data warehouses such as Snowflake and BigQuery. The implementation process typically takes 4–8 weeks, starting with high-priority tasks like a 13-week cash forecast or a 12-month revenue model. From there, the scope can expand to include headcount planning and scenario analysis. To ensure continuity, Excel outputs and BI dashboards are kept consistent with existing finance workflows.
Pricing is customized and quote-based, tailored to one of three service tiers: Basic, Growth, and Enterprise. These tiers range from bookkeeping to full M&A advisory services. Engagements are structured as retainers for ongoing financial planning and analysis (FP&A) support, fixed fees for specific projects like creating investor-ready models, or a combination of both. Importantly, there are no long-term software licensing commitments.
The ideal client is a U.S.-based growth-stage company with annual revenue between $5M and $150M, a workforce of 40–500 employees, and a recurring revenue model. These companies are usually at the Seed to Series C/D stage or part of a private equity portfolio. They benefit most from AI modeling when they have sufficient historical data, pressing cash runway decisions, and finance teams that are too stretched to handle complex manual models effectively.
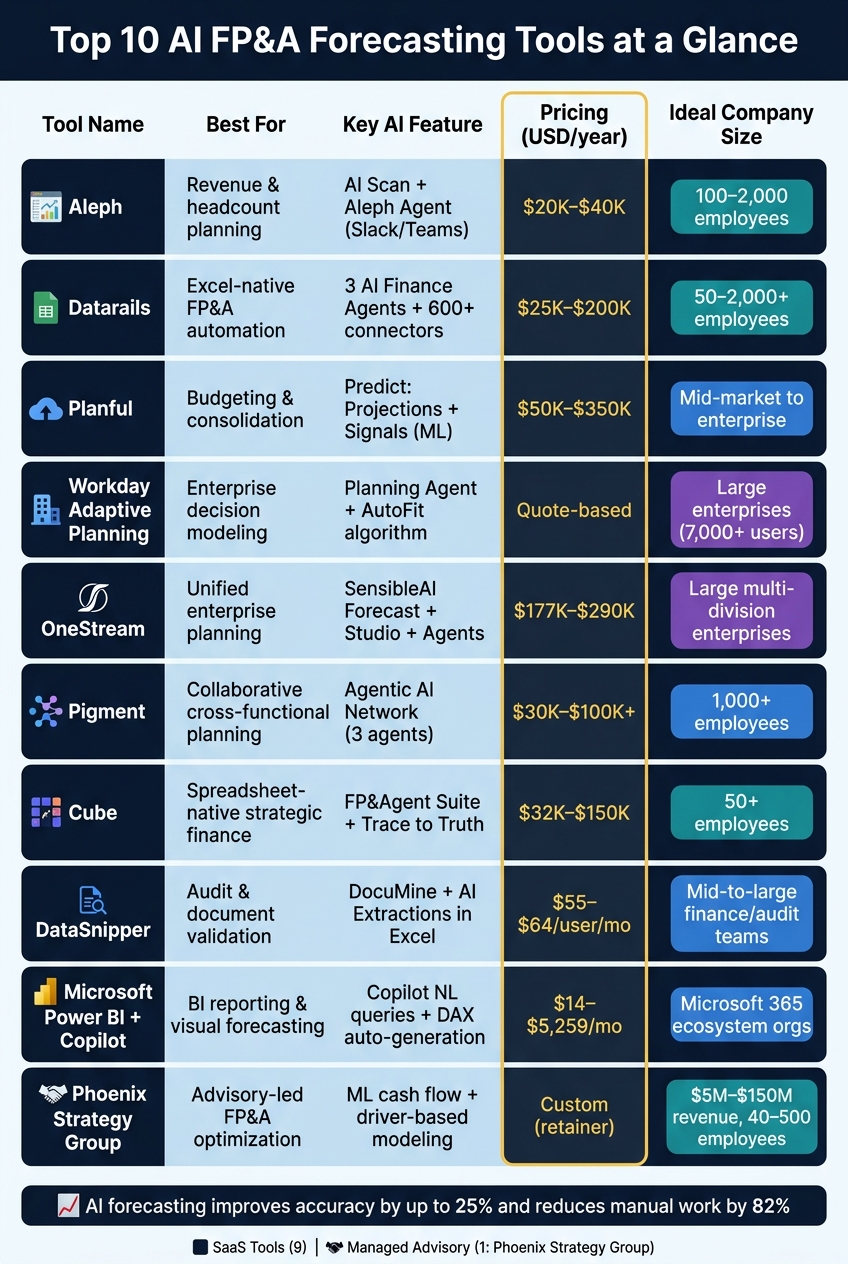
Top 10 AI Forecasting Tools for FP&A: Side-by-Side Comparison
Selecting the best AI forecasting tool comes down to factors like your company’s size, current technology stack, and the level of hands-on support you need. Below is a comparison of the ten tools covered in this article, highlighting their deployment models, pricing structures, and the types of businesses they’re best suited for. This table condenses the detailed reviews provided earlier.
| Tool | Primary Use Case | Key AI Features | Deployment Model | Pricing Approach (USD) | Ideal Fit |
|---|---|---|---|---|---|
| Aleph | Revenue & headcount planning | AI-assisted driver modeling and scenario analysis | Cloud SaaS | Subscription or custom quote | Series A–C startups |
| Datarails | Excel-native FP&A automation | Natural language queries and anomaly detection | Cloud SaaS | Tiered subscription | SMBs that rely heavily on Excel |
| Planful | Budgeting & consolidation | ML-powered forecasting and structured planning | Cloud SaaS | Custom quote | Mid-market companies |
| Workday Adaptive Planning | Enterprise decision modeling | Planning Agent with conversational "what-if" analysis and predictive forecasting | Cloud SaaS | Custom quote | Large enterprises |
| OneStream | Unified enterprise planning | SensibleAI (Forecast, Studio, Agents) alongside ML forecasting | Cloud SaaS | Custom quote | Large enterprises |
| Pigment | Collaborative business planning | AI-driven scenario modeling with real-time data syncing | Cloud SaaS | Custom quote | High-growth, cross-functional teams |
| Cube | Strategic finance for spreadsheet teams | Smart Forecasting featuring driver-based AI plus Excel & Google Sheets integration | Cloud SaaS | Tiered subscription | Spreadsheet-heavy finance teams |
| DataSnipper | Audit & financial document review | AI-driven document extraction with automated cross-referencing | Cloud SaaS | Subscription or custom quote | Finance and audit teams |
| Microsoft Power BI with Copilot | BI reporting & visual forecasting | Copilot-powered natural language queries and AI-generated insights | Cloud SaaS | Per-user subscription (starting at ~$10/user/mo) | Companies in the Microsoft 365 ecosystem |
| Phoenix Strategy Group | Advisory-led FP&A optimization | Integrated financial modeling, cash flow forecasting, and real-time data insights | Managed advisory service (non-SaaS) | Custom quote (retainer or project-based) | U.S. growth-stage companies |
Nine of these tools operate as software solutions that you configure and manage on your own. Phoenix Strategy Group stands apart by offering a managed advisory service, taking care of your forecasting infrastructure so you can focus on high-level decision-making.
For companies ready to adopt SaaS tools, Cube and Datarails are excellent choices for self-service capabilities. However, if your team requires more tailored support beyond software, Phoenix Strategy Group provides a hands-on, advisory-driven approach.
Selecting the right AI forecasting tool depends on where your business stands. Startups often find spreadsheet-native tools like Datarails or Cube to be a good fit. Mid-market companies typically need specialized platforms with strong ERP integration, while large enterprises require solutions capable of handling multi-entity consolidations. Whichever option you choose, it all starts with clean, dependable data.
Reliable data is key - make sure your systems are in order before rolling out any tool. Take the time to clean your chart of accounts and gather at least two to three years of consistent historical data. Skipping this step is one of the leading reasons implementations fail to meet expectations.
Keep human oversight in the loop. AI is excellent at spotting patterns, but financial judgment still requires experienced professionals. Relationship management, strategic thinking, creativity, regulatory compliance, and ethical considerations remain firmly in the human domain.
For growth-stage companies dealing with complex financial challenges, software alone isn’t enough. Advisory support becomes critical. For example, Phoenix Strategy Group offers tailored services that go beyond just providing software. Their team takes charge of data engineering, financial modeling, and cash flow forecasting infrastructure, letting your team focus on decision-making rather than setup. As they explain:
"AI-native companies will outpace competitors by building connected systems, centralized operational intelligence, and real-time decision infrastructure into the core of the business rather than treating AI as another disconnected productivity tool." [8]
If you’re unsure where to begin, the comparison table above can help guide your decision. Align your company’s size, current systems, and internal resources with the tools listed. And if your current setup doesn’t meet your forecasting needs, advisory support can help bridge the gap quickly.
Before diving into AI forecasting, it’s crucial to start with clean, consistent, and well-organized data. Ideally, aim for 18–36 months of detailed historical financial records, ensuring consistent accounting practices throughout. Include transaction-level details and complement them with operational and external inputs like sales pipelines, headcount figures, production metrics, and macroeconomic trends.
For growth-stage businesses, Phoenix Strategy Group specializes in integrating data from platforms like accounting systems, CRMs, and operational tools to create precise AI-powered financial models.
To find an AI forecasting tool that works with Excel, start by figuring out what you need. If your focus is on tasks like generating formulas or tidying up data, a Tier 1 or Tier 2 AI assistant or plugin should do the job. However, if you're looking for a solution for comprehensive planning and reporting, a Tier 3 FP&A platform is a better fit. These platforms connect seamlessly with ERP, CRM, and HRIS systems, pulling in live data while keeping your current models and templates intact.
Implementation timelines for AI FP&A tools can differ widely depending on a company's size and operational complexity. On average, full transformations take anywhere from 9 to 36 months. To achieve quicker results, many organizations opt for a phased approach.
Several factors influence the timeline, including data integration, system setup, and change management. These steps require careful planning to ensure the technology aligns seamlessly with a company's operational needs and growth objectives. With the right expertise, businesses can simplify these processes and make the transition smoother.