Published on
June 22, 2026


Most biotech losses start with one missed risk check. If I were reviewing a biotech today, I’d focus on 10 areas first: data, IP, trial design, manufacturing, FDA path, payer risk, cash runway, team, contracts, and competition.
Here’s the short version:
So when I look at a biotech, I’m not asking only, “Does the science look good?” I’m asking:
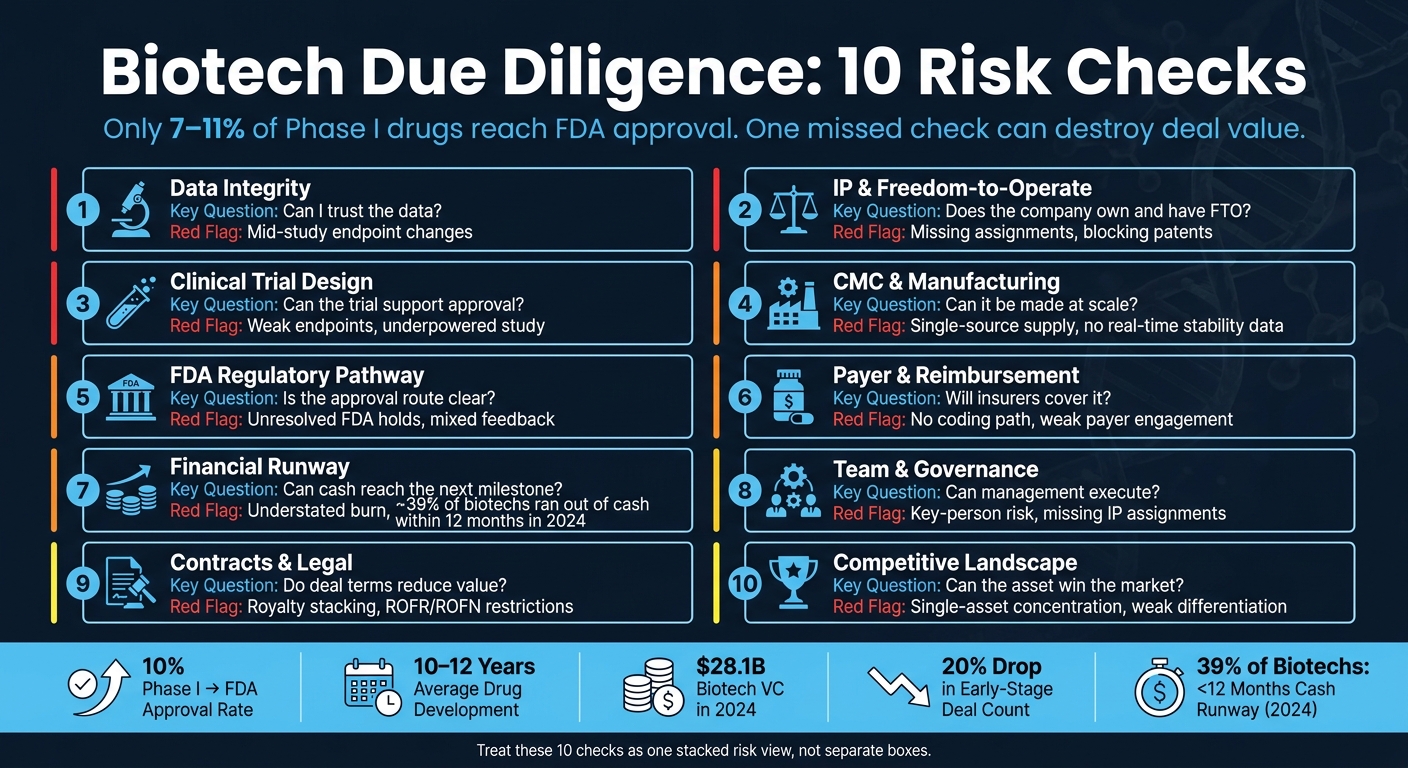
Biotech Due Diligence: 10 Risk Checks at a Glance
| Risk Check | What I’d ask first | What can go wrong |
|---|---|---|
| Data | Can the results be verified? | Weak files, endpoint changes, post-hoc storytelling |
| IP | Does the company own it and have FTO? | Missing assignments, blocking patents, stacked royalties |
| Trial design | Will the study support approval? | Weak endpoints, poor comparator, underpowered study |
| CMC | Can it be made the same way every time? | Scale-up delays, single-source supply, shelf-life gaps |
| FDA path | Is the route to approval clear? | Mixed FDA feedback, wrong pathway, policy delays |
| Payer access | Will insurers pay? | Weak coding path, no payer support, price pressure |
| Runway | Can cash reach the next readout? | Understated burn, thin runway, painful dilution |
| Team | Can management hit milestones? | Key-person risk, weak records, thin development depth |
| Contracts | Do deal terms reduce value? | ROFR/ROFN limits, partner exits, legal disputes |
| Competition | Can the asset take share? | Weak edge, old comparator, one-asset concentration |
Bottom line: I’d treat these 10 checks as one risk stack, not separate boxes. If even one core area breaks, valuation, timing, and follow-on funding can all change fast.
Data integrity risk is simple, and brutal: if a biotech's results can't be checked or repeated, the investment can fall apart.
Start with the raw evidence, not the story.
Before you underwrite the asset, review the full data package.
Don't lean on the pitch deck. Ask for the full Clinical Study Report (CSR), the pre-specified Statistical Analysis Plan (SAP), and the complete intent-to-treat (ITT) analysis, not just top-line results. For preclinical assets, that includes GLP-compliant toxicology packages, in vitro and in vivo efficacy data across multiple models, and PK/PD profiles [8].
A complete, version-controlled data room is often a sign of strong operating discipline [3]. On the flip side, missing source files or fuzzy documentation should put you on alert.
Clinical accrual errors can warp runway planning and push a company into dilutive rescue financing. That risk gets sharper when Phase 2 costs start drifting toward Phase 3 spend.
Mid-study endpoint changes are one of the clearest high-risk signals an investor can spot. They may point to regulatory misalignment or cherry-picking [8].
There are a few ways to limit the hit before full capital goes in:
These tools can help cap downside before full deployment [8].
| Scrutiny Area | Key Documents to Review | Red Flags |
|---|---|---|
| Clinical Data | CSRs, SAP, ITT analysis, safety database | Mid-study endpoint changes, post-hoc subgroup focus [8] |
| Regulatory | FDA meeting minutes, CRLs, IND filings | Unresolved clinical holds, safety-related correspondence [8] |
| Financials | Trial ledgers, vendor invoices, accrual policies | Underaccrued expenses, inconsistent burn rate tracking [9] |
| Preclinical | GLP toxicology packages, PK/PD profiles, lab records | Results not reproducible across multiple models, no GLP compliance [8] |
If the data checks out, the next issue is whether the asset is protected by enforceable IP.
After data integrity, the next issue is enforceability: can the company actually own and sell the asset? Those are not the same thing.
A company can hold patents and still be blocked from selling its product if someone else owns a patent it needs and hasn’t licensed. That’s the heart of Freedom-to-Operate (FTO) risk.
Start with ownership. You want to see a continuous chain of title from the inventor to the company. Missing assignments from founders, university researchers, or contractors can create a serious ownership problem.
Check the VDR for signed assignments from every contributor. Then confirm those records against USPTO assignment filings. For FTO, look for an independent review that maps the company’s product - as sold, formulated, and used - against the third-party patent landscape.
Once ownership is clear, the next question is simple: can third-party rights still block commercialization?
Unresolved IP issues can cut valuation and weaken leverage in a deal. That problem gets worse once clinical spending is high.
Run FTO early. Leverage drops hard after Phase III. If you spot a blocking patent early, the company still has options:
"The single most common investor mistake in biotech IPO due diligence is treating FTO as a post-investment concern - something the company's lawyers will figure out during commercialization." - DrugPatentWatch [10]
One way to cut exposure is to layer patent rights with regulatory exclusivity. Composition of Matter patents usually offer the strongest shield because they cover the molecule itself. After that come Method of Use and Manufacturing Process patents.
Relying on just one compound patent can be risky. By the time FDA approval arrives, that patent may not have much useful life left.
Also watch for royalty stacking. If the company owes royalties to several third parties, net revenue can shrink fast. And check for any rights of first refusal (ROFR) or rights of first negotiation (ROFN) that could box in future deal-making. It’s smart to budget for an FTO opinion early.
| Exclusivity Type | Duration (US) | Key Benefit |
|---|---|---|
| New Chemical Entity (NCE) | 5 years | Prevents ANDA submission for small molecules [10] |
| Biologic Reference Product | 12 years | Protects reference biological products [10] |
| Orphan Drug Exclusivity | 7 years | For drugs treating fewer than 200,000 persons in the US [10] |
| Patent Term Extension (PTE) | Up to 5 years | Compensates for time lost to FDA regulatory review [10] |
With IP mapped, diligence moves to clinical strategy and endpoint risk. If IP is clean, the next check is whether the trial can still prove the asset works.
Once IP is clear, the next step is simple: can the trial actually support approval?
The big issue is endpoint selection. Regulators care about endpoints that show real clinical benefit, not just a nice p-value. If a trial leans on a surrogate marker the FDA hasn't backed, or uses a weak comparator arm, approval risk goes up fast. Review the VDR for Special Protocol Assessment (SPA) agreements and End-of-Phase 2 (EOP2) meeting minutes. When the FDA has formally agreed with the trial design and endpoints, that gives you meaningful cover. Also check that the study is adequately powered and that the SAP deals with multiplicity adjustments.
A mid-study change to the primary endpoint should set off alarms. Ask for the original SAP and every later amendment. If the goalposts moved, you need to know why and whether that shows up in the regulatory correspondence.
Trial design feeds straight into valuation because it shapes approval odds. Phase 2-to-approval success rates are about 15% to 20%, but oncology falls to 10% to 15%, while rare disease moves up to 25% to 30% [8]. If the endpoint plan is weak or the study is underpowered, those odds can shrink even more. And when a program moves from Phase 2 into Phase 3, cash burn can jump hard because of more sites and heavier patient monitoring [9].
One way to cut risk is to stage financing around clear, measurable clinical milestones, such as a Phase 2 readout. That limits how much capital is exposed at each step and gives you more room to react if the program starts to wobble.
It also helps to bring in independent experts before backing a Phase 3 investment. They should pressure-test the mechanism of action and the biomarker plan. If those experts don't think the endpoint reflects real clinical benefit, payers may feel the same way.
If the trial design holds up, the next question is whether the product can be manufactured reliably at scale.
Strong trial data can still fall apart if the product can't be made the same way every time. That's what CMC risk comes down to: can the product be manufactured reliably, at scale, and at a cost that works commercially?
The main issue is process maturity. Look at whether CQAs link clearly to CPPs, whether release specs are based on enough clinical batches, and whether real-time stability data supports the proposed shelf life. Accelerated stability data by itself is not enough to prove shelf life.
If the process still isn't locked, supplier risk often becomes the next weak spot. Single-source supply is a major red flag. Watch for single-source inputs, weak quality agreements, and CDMO exposure that could force an expensive transfer. Fragile supply chains can lead to bridge financing, repricing, or milestone resets.
Post-close remediation can take 18 months or more and cost tens of millions of dollars. So if CMC readiness looks weak, that should affect price or lead to milestone-based funding.
Ask for the Site Master File, batch records, process flow diagrams, QTPP, deviation logs, CAPA records, and any Form 483s or Warning Letters.
If backup CDMO qualification, analytical validation, or real-time stability work hasn't started, build launch delay into the investment case.
Run a CMC gap assessment before committing capital. Verify that CDMO capacity is secured through signed agreements, not verbal commitments [13]. Backup supplier identification and clear trigger points for switching CDMOs show that management has planned for the downside, not just the upside.
Once CMC is de-risked, the next test is whether the asset can clear regulation without surprises.
| CMC Focus Area | Key Red Flags | Investor Impact |
|---|---|---|
| Process Robustness | No CQA-to-CPP mapping; limited batch characterization | High technical risk; failed validation |
| Stability Data | Accelerated data only; missing real-time results | Approval delays; uncertain commercial shelf life |
| Supply Chain | Single-source materials; no backup CDMO; no signed capacity | Launch delays; forced renegotiation under pressure |
| Compliance History | Unresolved Form 483s; data integrity gaps | Post-close enforcement risk; Warning Letters |
The next question is simple: can the asset get through FDA review on time? That answer shapes the timeline, cash burn, and the odds of a return. If CMC is in decent shape, FDA review becomes the next big gate.
Start by locking down the right pathway: 505(b)(2), BLA, or Accelerated Approval. Then confirm which milestones have already happened, including Pre-IND meetings, End-of-Phase 2 (EOP2) meetings, and Pre-NDA/BLA meetings. A Special Protocol Assessment (SPA) matters because it means FDA has directly agreed to the pivotal study design. That takes some guesswork off the table.[3][8]
Every claim in the pitch deck should line up with FDA correspondence and CSRs. If you find a mismatch, an endpoint change, or a polished subgroup story that doesn't match the record, that's a red flag for credibility.[8]
Policy risk adds a second hit. BIOSECURE can disrupt China-linked CDMO supply. The IRA can squeeze returns through price negotiation. Don't tuck those into the blue-sky case. Put them straight into the base-case model.
Regulatory uncertainty cuts probability-adjusted valuation. Use PTRS to discount peak sales. If the pathway is unclear or FDA feedback is still unresolved, your probability-adjusted value should go down, not up.
That also feeds into dilution risk. A murky path often means more studies, more delays, and more cash needed before a financing event or exit.
Ask for the full regulatory correspondence log: every email, phone call, and formal submission. A clean, complete log suggests the team is on top of the process. Missing pieces suggest risk.
Also check the live status of any special designations:
These designations can shorten timelines and improve exclusivity, but only if they are still active and properly documented.[8]
Pre-IND meetings and Phase 2 data readouts are major value inflection points. If neither has happened, there is more uncertainty, and the path to liquidity is likely longer.
This is one of those spots where timing matters almost as much as outcome. A company may have a good story, but if the next hard proof point is far off, the asset deserves a heavier discount today.
If the company waited too long to engage regulators, price that in. Early Scientific Advice meetings or Pre-IND meetings with the FDA are relatively low-cost ways to cut late-stage surprises.
Payer-relevant endpoints should also be built into the plan from the start. Approval without reimbursement still breaks the investment case. Getting the drug cleared is only part of the job if coverage never shows up.
| Regulatory Milestone | Value Impact | Key Documentation |
|---|---|---|
| Pre-IND Meeting | High (de-risking) | Briefing book, official minutes [3] |
| End-of-Phase 2 Meeting | Very High (pivotal design) | SPA or equivalent, meeting minutes [8] |
| Special Designation (Breakthrough Therapy / Fast Track / RMAT / Orphan Drug) | High (timeline/exclusivity) | Active status verification [8] |
| Phase 3 Data Readout | Very High (approval probability) | Clinical study reports, raw data [6] |
After regulatory risk, the next issue is simple: will payers cover the drug at a price that works? FDA approval does not mean coverage. A drug can get approved and still miss the market if payers refuse to reimburse it at a workable price. Early payer input cuts the risk of building a clinically strong asset that still has no reimbursable market. Payers want proof that a product improves outcomes or changes care, not just a favorable p-value [14]. That’s why market access needs its own diligence gate, not a box to check after approval.
Reimbursement risk flows straight into valuation. If pricing assumptions are weak, valuation gets inflated. Price negotiation risk can cut long-term value in a material way [8]. And if reimbursement milestones slip, the company may need more financing rounds, which means more dilution.
Look closely at the health economic model, payer letters, pilot agreements, and coding plan. If the plan assumes broad payer uptake within six months of launch, but there’s no documented payer engagement, that’s a red flag.
Also check whether current CPT/HCPCS codes already fit the product or if a new code request is needed. A product without a billing path can stall even when the clinical case looks strong [14]. The commercial evidence investors should underwrite includes:
Market access planning should begin 12 to 18 months before launch [15]. Use HTA and payer advisory meetings to test endpoints and code/billing assumptions before launch gets close [15].
The best way to reduce this risk is to line up trial design and pricing evidence before pivotal studies begin. Start payer engagement before pivotal design is locked, and tie deal tranches to reimbursement milestones [14][15].
Coverage delays also tighten runway, which makes financing risk the next diligence test.
If reimbursement slips, the next issue is simple: who pays for the delay? Cash runway decides whether a biotech can make it to the next milestone. And if the company has to do an emergency raise before getting there, the deal is already under pressure.
The biggest risk is a runway model built on old assumptions. When accruals miss the Phase II-to-Phase III cost jump, the runway math falls apart.
That problem usually hits valuation first. A burn rate that looks too low on paper can force a rescue raise before the next milestone. And if the cap table is messy, dilution can be harder to spot than it should be. Preferred stock, warrants, and convertibles can all chip away at ownership in ways that aren't obvious at first glance.
What matters most is the support behind the model. Look closely at clinical trial accruals and compare them with vendor contracts and site budgets. Also check whether R&D costs are being capitalized instead of expensed. If the financial data room is disorganized, that's a bad sign. It can point to weak controls and slow the diligence process.
The table below sums up the main financial data points and why each one matters:
| Financial Data to Review | Why It Matters |
|---|---|
| Clinical Trial Accruals | Prevents "fictional" runway; ensures burn reflects trial stage [9] |
| Cap Table Details | Identifies post-transaction dilution risk for new investors [9] |
| R&D Capitalization | Ensures development costs aren't improperly inflated as assets [9] |
| Cost-to-Completion | Reconciles actual spending to future funding needs [9] |
| Quality of Earnings | Reveals true economic performance; foundation for valuation [9] |
Cash projections need to tie back to specific milestones, not generic growth curves.
The best move is to put the financial setup in place before diligence begins. A fractional CFO such as Phoenix Strategy Group can prepare audit-ready financials and milestone-based cash forecasts before diligence. Inside the company, teams should surface and fix red flags like aggressive revenue recognition, incomplete enrollment cost tracking, or cost-to-completion estimates that do not reconcile with actual spend [9].
Runway only matters if the team can turn cash into milestones. A biotech can have plenty of funding and still stall if leadership is thin, governance is messy, or a key executive walks out at the wrong time.
Investors back teams that can move from strong science to milestones, financing, and execution. A common trap shows up when founders can explain the science in detail, but struggle to explain the path to development, funding, or approval.
Proven management teams - those with prior exits and drug development experience - can lower deal risk and support higher valuations [1]. The reverse is just as important. If the company depends too heavily on one person, execution gets shaky fast, especially when there’s no succession plan.
The Virtual Data Room (VDR) often acts like a window into management quality. Investors want to see complete, version-controlled records: key employee bios, executed IP assignment agreements, Scientific Advisory Board (SAB) member agreements, board meeting minutes, and employment agreements with invention assignment clauses [3][1].
Those gaps aren’t just paperwork issues. They show whether the team can stay organized and execute when pressure builds [3].
The table below shows the main documentation categories and what each one can tell an investor:
| Documentation Category | What to Assess | Risk Flag |
|---|---|---|
| Leadership Depth | Bios, exit records, clinical development history | No industry-specific experience; history of legal disputes [1] |
| Talent Retention | Executive contracts, non-competes, retention agreements | Missing IP assignments; vague ownership clauses [8][1] |
| Governance | Board minutes, SAB agreements, cap table | Unsigned or loosely defined SAB agreements; undocumented board approvals [3][8] |
| Operational Maturity | Staff training records (GCP/GLP), SOPs | Discrepancies between pitch decks and raw clinical data [3][6] |
If the team and control setup look solid, the next step is contracts and legal exposure.
Missing assignments, board approvals, and SAB agreements should be resolved before the funding close.
The first move is an internal cleanup before the data room opens. Teams should fix every governance gap: executed IP assignments, formalized SAB agreements, non-compete clauses, and version-controlled SOPs [6][3]. Retention pay also needs to line up with burn and milestone timing, since team costs often make up a big share of early-stage spend.
A fractional CFO from Phoenix Strategy Group can help clean up the data room and spot governance gaps before diligence shifts to contracts and legal contingencies. Then it makes sense to check contracts and legal contingencies for hidden downside.
After governance issues are fixed, the next place risk hides is in the contracts. At that point, the key question shifts from who runs the company to what the company actually controls on paper. Partnership agreements, license deals, and open legal matters can chip away at value long before a term sheet shows up.
The biggest valuation risks usually come from stacked royalties and partner rights that allow termination or renegotiation. If a company has licensed technology from several parties, each royalty sits on top of the next. That can eat into net revenue enough to turn a strong-looking asset into one that barely works on an economic basis [6][8].
Some licensing and co-development agreements create another problem: they give a partner the right to terminate or reopen terms if the company is acquired. That can narrow deal options and make buyers less willing to bid hard [8].
Rights of First Refusal (ROFR) and Rights of First Negotiation (ROFN) can create the same kind of drag. They don't often kill a deal outright, but they can weaken leverage and shrink the field of bidders [8].
The data room should contain fully executed copies of every material contract. Drafts, half-signed versions, and unsigned agreements are red flags [9][8]. Buyers and investors will want to see that the paperwork is complete, current, and enforceable.
The contracts that need the closest review include:
For university-originated assets, check that the license was signed by an authorized institutional signatory. If that piece is missing, the whole chain of rights can come under scrutiny.
The table below highlights the four contract types that most often create trouble during diligence:
| Contract Type | Key Review Items | Common Red Flags |
|---|---|---|
| University License | Chain of title, march-in rights, sublicensing | Missing institutional signatures, retained commercial rights |
| CDMO Agreement | Assignment rights, termination, step-in rights | Vague termination triggers, no step-in rights for buyer |
| Licensing/Partner | ROFR/ROFN, royalty stacking, change of control | High stacked royalties, restrictive territory limits |
| CRO Agreement | Data ownership, GCP compliance, audit rights | Incomplete patient enrollment tracking, underaccrued expenses |
Some legal issues clear fast. Others hang around for years.
CDMO migration often takes 12 to 24 months for biologics [8]. Patent disputes, including Inter Partes Review (IPR) petitions, can stay open through several funding rounds. That timing matters. A risk that takes two years to sort out doesn't just sit in the background - it can shape financing terms, partner interest, and exit paths the whole way through.
There are a few common ways to price unresolved issues into a deal: escrow holdbacks, milestone-based payments, and indemnities [8][16]. These tools don't make the problem disappear, but they can keep one open dispute from poisoning the whole transaction.
Before investors enter the data room, run a contract audit focused on royalty stacking, consent rights, and missing assignments. That's the kind of cleanup work that pays off later. It's usually much better to disclose a known issue early, along with a plan to fix it, than to let it pop up halfway through diligence.
Clean paper helps protect leverage in the next financing, partnership process, or exit. When contracts are in good shape, there's less valuation leakage. When rights issues stay unresolved, they can still block the next round or stop a sale cold. If the contract stack is clean, the next question is whether the asset can still beat better-funded competitors.
The last check is simple: can the asset win in the market? And just as important, is the company betting too much on one program to make that happen?
Even when the science holds up, competition and single-asset concentration can wipe out value. That’s why competitive mapping belongs in price discovery, not in some later commercial review.
You need to underwrite whether the asset stands apart on efficacy, safety, dosing, or convenience. Is there a clear clinical or commercial edge, or is the story mostly marketing?
Don’t lean on the company’s peak sales forecast. Build your own bottom-up model.
A one-asset company also comes with binary downside. If the lead program fails, the damage can be severe. So the next move is to test management’s claims against the actual competitive set, not the version shown in a pitch deck.
Competitive mapping has to go past a slide deck. Look at approved and clinical-stage competitors across:
Also look closely at the comparator used in the company’s trials. If the study was run against an old or weaker treatment instead of the current standard of care, the efficacy data may look stronger than it is.
Then check whether the differentiation story lines up with both the clinical data and the planned commercial position. Competitive standing doesn’t stay still. Markets shift, patents expire, and the IP picture can change fast.
Competitive risk can move within a single financing cycle. New entrants can advance, patents can expire, and FDA designations can change.
A multi-asset platform lowers single-program risk [7]. At the deal level, investors can use milestone-based payment structures and independent risk-adjusted NPV (rNPV) models built from indication-specific success rates instead of broad industry averages [8].
A formal SWOT analysis against the top three current and emerging competitors is a good place to start [8]. Keep it tight and focused on physician and patient switching barriers, because that’s often where the market fight is won or lost.
Platform breadth and pipeline depth affect downside severity, not just upside optionality. Weak positioning and concentration risk should be priced directly into the deal, then carried through the full risk score across the diligence checklist.
Use four filters to rank every risk: valuation impact, evidence quality, time to resolution, and mitigation path. That gives you a simple way to sort the risk maps by what can kill the deal, what should move the price, and what can wait.
Deal-breakers like data manipulation, undisclosed FDA holds, or blocking IP are walk-away issues. Serious problems such as CMC scale-up gaps, sole-source API suppliers, or weak commercial differentiation can still be negotiated, but they should affect price. Lower-severity findings, like routine protocol deviations or minor documentation gaps, usually don't change valuation much [16][6].
Valuation impact comes first. Data integrity sits at the top because one integrity failure can wipe out trust in the whole story. IP and freedom-to-operate come next, since blocking patents can crush the program's NPV. Clinical strategy also carries heavy weight because PTRS is a major input in risk-adjusted NPV. Stage risk usually drops as a program moves from Phase 1 to Phase 3, but Phase 2 tends to swing the most by indication.
Use the table below to rank each diligence area by valuation impact.
| Rank | Diligence Area | Primary Valuation Impact |
|---|---|---|
| 1 | Data Integrity | Binary - deal or no deal; total loss of trust |
| 2 | IP & FTO | Defines the exclusivity window; blocking IP kills NPV |
| 3 | Clinical Strategy | Directly sets PTRS and drives rNPV |
| 4 | Commercial / Market Access | Sets the peak sales ceiling; reimbursement is the real hurdle |
| 5 | Regulatory Pathway | Determines time-to-market and total R&D cost |
| 6 | CMC & Supply Chain | Launch delays and transfer cost |
| 7 | Financial Runway | High burn equals high dilution; fractional CFO services can help manage these levers to preserve negotiating leverage |
| 8 | Team & Governance | Execution risk; key-person dependencies |
| 9 | Partnerships / Legal | Royalty stacking erodes net margins |
| 10 | Competitive Landscape | Differentiation determines market share capture |
Time to risk resolution is where the runway math stops being abstract. In 2024, about 39% of biotechs were projected to run out of cash within 12 months [2]. If a major risk can't be worked through before the next fundraise, the company loses leverage. That often means punitive terms and heavy dilution [8].
If internal fixes won't get the business to the next inflection point, the deal structure has to do some of the work. Options include:
The next sections turn these rankings into quick-read risk maps. Use this order as the lens for everything that follows.
Data integrity is the first filter: if the record breaks, the deal breaks.
This matrix helps you tell the difference between files that are ready for diligence and claims that look good only in a pitch deck.
| Dimension | High Integrity Posture | High-Risk Posture |
|---|---|---|
| Raw Data Access | Full access to raw datasets, instrument readouts, and bioinformatics pipelines [3][5] | Access limited to top-line summaries, press releases, or cherry-picked summary slides [8] |
| Lab Documentation | Electronic Lab Notebooks (ELNs) with time-stamped entries; version-controlled protocols; instrument calibration logs [3][5] | Paper-based or disorganized records; missing source files; unsigned drafts; no SOPs [3] |
| CRO Oversight | Regular site monitoring reports; executed quality agreements; vendor-level cost and data tracking [3][9] | Aggregated summary reports with no vendor-level detail; missing GCP compliance records [3] |
| External Validation | GLP-compliant toxicology; independent FTO opinions; third-party validation of key efficacy models [8][3] | Reliance on internal discovery data only; lack of independent verification for pivotal claims [8][3] |
| Statistical Rigor | Pre-specified SAP with ITT analysis; multiplicity adjustments; adequate power [8] | Post-hoc endpoint changes; mid-study primary endpoint shifts; favorable subgroup analysis only [8] |
A simple rule: if files are mislabeled or CRO records are missing, treat that as an operating-control problem, not a small paperwork issue.
If the data trail holds up, the next step is IP and freedom-to-operate.
Once the data trail holds up, the next step is simple: figure out whether the asset is protected, owned, and clear to sell. If there’s a gap here, it can hit valuation, weaken financing leverage, or slow an exit. That’s why this map helps you decide whether to pay full price, apply a discount, or pass.
These six items shape whether the company can defend exclusivity and get financing done.
| IP Dimension | What to Verify | Red Flag |
|---|---|---|
| Composition of Matter (CoM) | Does the patent claim the novel molecule, vector, or cell line itself? | Weak CoM protection sharply lowers valuation. |
| Method of Use (MoU) | Are claims broad enough to cover the target indication and prevent workarounds? | A narrow MoU leaves workarounds open. |
| Key Geographies | Are patents filed and maintained in the U.S., EU, Japan, and China? | Gaps in major markets shrink exclusivity and deal value. |
| Ownership / Chain of Title | Executed assignments from every founder, employee, consultant, and academic collaborator. | A missing assignment can derail a deal at closing, especially if university rights are involved. |
| Encumbrances | Are there royalty stacking obligations, ROFRs, or academic march-in rights? | Multiple royalty streams erode NPV and deal flexibility. |
| FTO Status | Formal FTO opinion on blocking patents. | A missing FTO opinion is a material gap; budget $20,000 to $50,000 or more for a credible letter from a reputable IP firm [3]. |
Start with filing coverage in the U.S., EU, Japan, and China. Miss one of those markets, and exclusivity can shrink fast. So can deal value. On top of that, check whether the asset qualifies for Patent Term Extensions (PTEs) in the U.S. or Supplementary Protection Certificates (SPCs) in the EU. If you skip that step, your revenue-tail model may be off [8].
There’s also a supply-chain angle. If manufacturing depends on Chinese CDMOs, you need to model BIOSECURE-related migration risk and the 12- to 24-month delay that can come with it [8]. That kind of delay isn’t just annoying. It can move launch timing, strain margins, and change how buyers look at the whole asset.
One more layer matters here: many companies now stack process patents on top of CoM and MoU claims. The idea is pretty straightforward. Even after the core patent expires, process claims can still make life hard for competitors. That can shape pricing power, launch timing, and margin pressure in a big way.
If those rights don’t hold together, the next question is whether the trial can still support approval.
After exclusivity is clear, the next question is simple: can the asset still get approved? That means scoring each lead asset on its own data package and trial design, not on top-line claims or a polished pitch. If one asset scores poorly, that should affect valuation, tranche size, or the timing of any follow-on check.
The table below lays out the main areas to review for each asset in the portfolio.
| Evaluation Dimension | What to Verify | High-Risk Signal | Low-Risk Signal |
|---|---|---|---|
| Phase-to-financing fit | Does the current phase support the target product profile? | Phase II data used to justify Phase III spend without clear power or FDA feedback | Robust Phase II data with clear FDA guidance on Phase III design |
| Label and market fit | Does the asset fit a clear target profile? | No clear KOL support; weak commercial case | Clear unmet need with documented KOL backing |
| Primary Endpoint | Is it clinically meaningful and FDA-validated? | Novel surrogate with no regulatory precedent | Accepted, validated endpoint with prior FDA clearance in the indication |
| Comparator | Is it the actual standard of care? | Placebo arm when an active standard of care exists | Current standard-of-care therapy used as the active comparator |
| Enrollment Assumptions | Are site activation timelines and inclusion criteria realistic? | Overly restrictive criteria; single-site; no historical benchmark | Multi-site; broad criteria; benchmarked against historical accrual data |
| Trial execution | What could delay or derail the next study? | Slow enrollment, weak site activation, incomplete CRO cost tracking | Multi-site with backup sites; reconciled accrual tracking |
| FDA Precedent | Has FDA accepted this evidence package in the same indication? | Contentious or limited FDA correspondence | Collaborative, with SPA or clear meeting minutes |
A few of these checks matter more than they first appear. Primary endpoint and comparator can make or break the whole program. An endpoint may look good on a slide, but if FDA has not accepted it in that setting, the risk jumps fast. Same idea with the control arm: if the study uses placebo when doctors already use an active therapy, the readout may not hold up the way management hopes.
Execution risk also deserves a hard look. Enrollment models often look neat in a deck, then fall apart in practice. Tight inclusion criteria, weak site activation, or thin CRO tracking can drag timelines and burn cash. On the other hand, multi-site plans, backup sites, and accrual assumptions tied to prior studies usually point to a more grounded setup.
Use these checks to pressure-test asset-level PTRS by indication and phase, not seller forecasts.
Treat missing CSRs or ITT analyses as a material diligence gap.
CMC risk often decides whether a biotech launches on time and without blowing up cost. And that risk looks very different depending on the modality. So the next move is simple: review remediation cost and supply-chain fragility asset by asset.
The table below shows where the biggest gaps tend to sit and what it may take to fix them.
| Modality | Development Stage | Major Manufacturing Gaps | Assay and Release-Method Readiness | Single-Source Risk | Cold-Chain Complexity | Approximate Remediation Cost |
|---|---|---|---|---|---|---|
| Small Molecule | IND-Enabling / Phase 2/3 | Weak justification of starting materials (ICH Q11); impurity profiling; nitrosamine risk assessment | Gaps in method validation for clinical release; stability-indicating methods needed | Moderate - single-source API risk | Low (ambient storage) | $5M–$10M |
| Biologics | Clinical (Ph 2/3) | Cell line characterization; inability to bridge preclinical and clinical lots; CDMO migration | Assays qualified, not commercial-ready | High - China-based CDMOs raise BIOSECURE Act exposure; migration typically takes 12–24 months | Moderate (2–8°C); PUPSIT compliance for EU | $15M–$30M |
| Cell & Gene Therapy | Pre-Pivotal / Pre-Approval | Process lock issues; scalability; facility not ready for Pre-Approval Inspection (PAI) | Potency assay gaps; characterization still incomplete | Critical - highly specialized CDMO network | High (cryogenic, chain-of-custody requirements) | $20M–$50M+ |
| ADCs | Phase 1/2 | Cross-contamination risk; complex multi-site manufacturing; conjugation process control | Stability methods not fully validated | High - requires specialized conjugation facilities | Moderate to High | $10M–$25M |
A few patterns jump out fast. Small Molecules may look easier on paper, but weak starting-material justification, impurity work, and nitrosamine review can still create delay and added spend. Biologics carry a different problem set: lot bridging, cell line work, and CDMO transfer can drag for 12 to 24 months, which is a long time when deal timing is tight. Cell & Gene Therapy usually brings the heaviest lift, with process lock, scale-up, potency assays, and PAI readiness all in play at once. ADCs sit in the middle but can get messy fast because conjugation control and multi-site manufacturing leave more room for error.
Single-source dependence is one of the biggest pressure points here, especially when it involves China-based CDMOs. That can create BIOSECURE exposure and trigger transfer delays of 12 to 24 months. In plain English, what looks like a supplier issue can turn into a deal-timing issue.
That’s why unresolved CMC gaps should be treated as pre-close pricing and timing risks, not something to clean up later. They also shape approval timing, so they need to feed straight into regulatory diligence.
Cost ranges are approximate and depend on asset stage, modality, and the scope of remediation [11][12][8].
Once CMC is stable, the next gate is simple: can the asset get through FDA review, and can it get covered by payers? Those are two separate gates. Approval does not mean revenue. An asset can look strong on paper and still go nowhere if it can’t get both approval and coverage.
Start by confirming the actual approval pathway from FDA correspondence, not the pitch deck. That choice should feed straight into the timeline, cash needs, and pricing model. If the company claims a designation, audit it against FDA correspondence and make sure it is still active and documented.
Market access risk should show up in diligence before launch planning, not after approval.
| Factor | What to Assess |
|---|---|
| Companion Diagnostic Dependency | Diagnostic co-development can delay launch and increase burn. Check biomarker validation status and the regulatory co-submission burden [8] |
| U.S. Reimbursement Route | Medicare Part B (physician-administered) vs. Part D (pharmacy-dispensed); NCD/LCD fit [8] |
| Expected Price Band (USD) | Benchmarked against the current standard of care in the same therapeutic area |
| Payer Friction Points | Reliance on surrogate endpoints, limited real-world evidence, and prior authorization risk - payers may reject the launch economics [14] |
| Budget Impact Concerns | IRA price negotiation exposure, high upfront cost risk for cell and gene therapies, and inflated peak-sales assumptions [8] |
The Inflation Reduction Act has changed Medicare exposure in a major way, especially for products that may face price negotiation. The Part B vs. Part D split matters because it shapes who holds reimbursement leverage and how fast coverage decisions move. Approval without coverage still leaves the asset stranded.
Use PTRS to set rNPV, not to sell hope. Approval and coverage assumptions should flow straight into the financing model.
Approval and coverage only matter if the company has enough cash to get there.
That’s why runway needs a reset after every phase change. A move from Phase II to Phase III can push burn up fast as patient counts grow, more sites come online, and monitoring gets heavier. If the next readout gets delayed, the company often has to raise money on weaker terms.
Burn isn’t just what shows up in current cash spend, either. It also includes unpaid CRO, site, and vendor obligations. You need to match accruals against contracts and site budgets, line by line, so the burn picture reflects what the business actually owes.
Cash flow should tie to clear value inflection points, not just old spending patterns. That means mapping cash needs to milestones like:
This is the only way to see whether the company can fund the steps that matter most [3][9].
A delay in coverage makes the problem worse in a direct way. If reimbursement slips, that’s not only a commercial issue. It also shortens runway.
In a selective funding market, weak milestone planning often leads to punitive raises or fire-sale pricing [4][9]. This is where FP&A support helps. It can model dilution, financing timing, and downside cases so management isn’t flying blind.
If runway is thin, the next question becomes pretty simple: can management still hit milestones on time?
Biotech due diligence is not about picking the science that looks strongest on paper. It is about spotting the risks most likely to destroy value before you put money to work.
Read these 10 checks as one stacked risk view, not 10 separate boxes to tick. A single-source CDMO dependency can push back approval timelines, eat through cash, and force a distressed raise. One unresolved CMC gap can weaken the entire investment case. In practice, this framework leads to one of three calls: price it correctly, size the tranche to the risk, or pass.
That is why the base rate matters. Phase 1-to-approval success is only 7% to 11% [8], so discipline matters more than optimism. The best investors know the difference between promising science and fundable science: de-risked, priced correctly, and capital-efficient. For financial diligence support - burn, runway, and financing scenarios - Phoenix Strategy Group works with growth-stage life sciences companies.
First, put clinical data quality at the top of the list. Before anything else, check whether the science holds up. Did the program hit its primary endpoints? Is the data strong enough to support the claim?
That means the results shouldn’t be cherry-picked, borderline, or compromised.
Look past the press release headline and read the actual clinical study reports.
A few red flags tend to show up fast:
That kind of thing matters. A study can sound good in a headline and still fall apart once you read the fine print.
It also helps to check whether the effect size is clinically meaningful, not just statistically positive. Then look for consistency across trial phases. If Phase 2 points one way and Phase 3 tells a different story, that gap deserves a hard look.
One more thing: the review should be backed by centralized documentation and third-party audits. If the paper trail is thin or the oversight feels loose, take that as a warning sign.
Enough cash runway should carry the company to its next major value inflection point, like a clinical trial milestone, FDA approval, or commercial launch.
That runway shouldn’t come from a generic timeline. It needs to come from detailed projections that tie the actual burn rate to specific development goals. That matters even more in biotech, where costs can jump fast from Phase II to Phase III.