Published on
June 22, 2026


If your dashboard shows three revenue numbers, the issue is usually not math. It’s system mismatch.
I’d boil this article down to one point: a CFO dashboard works only when each metric has one source, one mapping rule, one refresh schedule, and one close-control process. For U.S. companies in the $500,000 to $10,000,000 revenue range, that usually means tying together ERP/accounting, payroll, CRM, banking, and billing into one reporting layer in USD ($).
Here’s the short version:
A few numbers stand out:
| Area | What I’d use as the main source | Why it matters |
|---|---|---|
| Financial reporting | Accounting / ERP | Final numbers for closed-period reporting |
| Subscription metrics | Billing platform | MRR, ARR, churn, expansions |
| Pipeline | CRM | Bookings, stages, close dates |
| Cash | Banking | Cleared cash movement and balances |
| Headcount and pay | Payroll / HRIS | FTEs, salaries, benefits, department cost |
Bottom line: if you want one dashboard that your fractional CFO, controller, and board can use without arguing over the numbers, you need clear ownership, clean joins, fixed metric definitions, and close-period controls from day one.
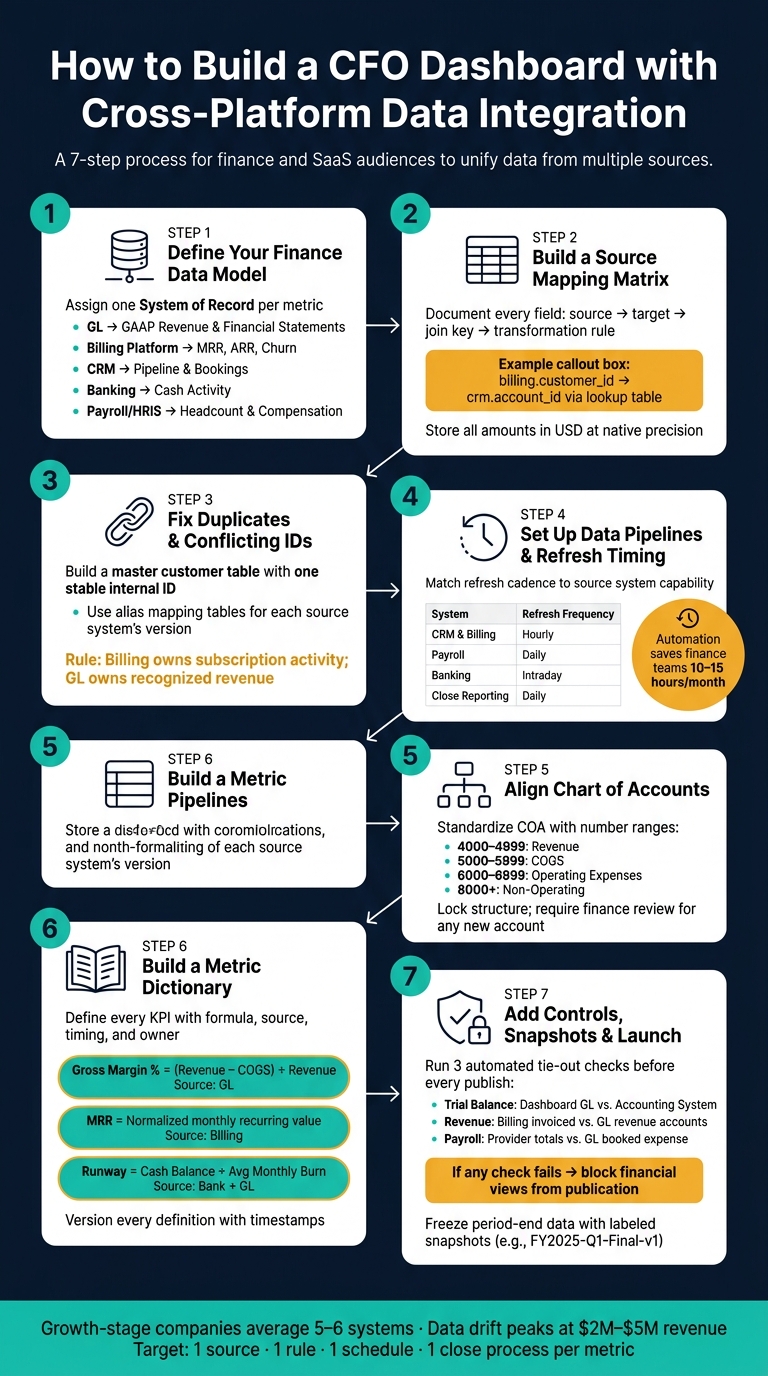
CFO Dashboard Integration Blueprint: 7-Step Setup Process
Start with a blueprint. If you skip this step, you'll end up rebuilding joins and fixing rules later.
Begin by listing every core entity the dashboard needs: the general ledger, chart of accounts, customers, invoices, subscriptions, payroll runs, bank transactions, and opportunities. Then give each metric one system of record - one source that owns that number.[4][5]
A practical split looks like this:
| Domain | System of Record | Examples |
|---|---|---|
| Financial statements | Accounting / ERP | Revenue, expenses, accounts receivable, balance sheet |
| Subscription metrics | Billing platform | MRR, ARR, churn, expansions |
| Pipeline metrics | CRM | Opportunities, stage, close date |
| Cash activity | Banking | Inflows, outflows, cleared transactions |
| Headcount and compensation | Payroll / HRIS | FTE count, salaries, department cost |
Use operating systems for drill-down. Use the general ledger for final financial reporting.
Once ownership is set, map each source field to a target field.
After the data model is set, document every field. A source mapping matrix shows each source field, target field, join key, and transformation rule.[4][5]
For example, one row might map billing.customer_id to crm.account_id with a lookup table as the join key. Another row might convert source dates into a standard MM/DD/YYYY format for the reporting layer. A third might translate product and plan labels into finance categories like "core subscription" or "usage revenue." Miss these mappings, and the same record can split across systems and wreck your rollups.
Store amounts in USD at native precision, then format them in the dashboard as $1,234,567.89.[4][5]
Once field mapping is done, fix duplicate IDs and conflicting records before loading data.
A single customer can show up under different names across systems. Without a canonical customer ID, the dashboard creates separate records. That inflates customer counts and breaks ARR rollups.[4][5]
The fix is simple: build a master customer table with one stable internal ID, then add a mapping table that stores each source system's version as an alias. If revenue views conflict, use billing for subscription activity and the general ledger for recognized revenue. Put that rule in writing inside the blueprint.[4][5]
Once ownership and IDs are sorted out, define refresh timing and load rules.
Once the model and field mappings are in place, move source data into a reporting layer before you transform it. That step helps preserve history and makes backfills much less painful. It also has a direct effect on whether the CFO dashboard closes fast and shows one number everyone trusts.
What’s the target here? A clean, auditable feed for cash, burn, runway, revenue, and headcount.
For standard finance systems like Salesforce, Stripe, or QuickBooks, managed connectors are usually the fastest way to get up and running. They also tend to be more stable. If you’re dealing with custom or nonstandard systems, custom APIs are often the right fallback. Webhooks work well for real-time alerts, while CDC is a strong match for high-volume transaction data.
A simple way to think about it:
Pick tools that flag schema changes before they break reporting. That kind of warning can save a lot of cleanup later.
The main options are summarized below [6].
| Integration Method | Setup Effort | Reliability | Auditability | Fit for Finance |
|---|---|---|---|---|
| Managed Connectors | Low | High | High | Best for standard ERP/CRM |
| APIs (Custom) | High | Moderate | High | Good for niche systems |
| Webhooks | Moderate | High | Moderate | Best for real-time alerts |
| CDC (Change Data Capture) | High | High | High | Best for high-volume transactions |
Finance reporting should preserve source, timestamp, and lineage.
Once you’ve picked the integration method, set refresh timing based on what each source system can support.
Don’t set SLAs by dashboard. Set them by source. CRM and billing data often need hourly refreshes. Payroll is usually fine on a daily schedule. Banking data may need intraday refreshes when the team wants a current view of cash movement.
Daily refreshes are enough for close reporting. Intraday refreshes are more about operating visibility.
To keep routine updates stable, use scheduled refreshes, threshold alerts, and anomaly detection. Automated reconciliation and error detection can save finance teams 10 to 15 hours per month [6].
After refresh timing is defined, switch to incremental loads to keep updates fast and steady.
After the initial load, pull only changed records. That cuts processing time and reduces pressure on source systems. For high-volume transactional platforms, CDC helps keep refreshes efficient while lowering source-system load.
Backfills come into play when the chart of accounts changes, metric logic changes, or historical source data changes. Add retry logic and an error queue so short-term API failures don’t cause dropped records. That’s the kind of setup that helps keep the dashboard auditable over time [6].
Pipelines move data. The COA and metric map make that data show up the same way everywhere.
Once data from each source lands in one reporting layer, align the COA so every finance metric rolls up the same way.
Start by exporting the full COA and merging near-duplicate accounts. This shows up a lot in growth-stage companies. Fast hiring, new tools, and system migrations often leave behind a messy trail: "Software Subscriptions", "SaaS Tools", and "Online Tools" may all exist as separate line items. The point isn't just to make the ledger look neat. The point is to build a COA that rolls cleanly into dashboard reporting.
A simple top-level hierarchy for U.S. growth-stage companies looks like this:
Gross profit equals Revenue minus COGS. Taxes should sit as a reporting line below operating income, not as a main account group.
It also helps to use account number ranges that show hierarchy at a glance: 4000–4999 for revenue, 5000–5999 for COGS, 6000–6999 for OpEx, and 8000+ for non-operating. Once that structure is in place, lock it down. Any new account should go through finance review before it gets added.
Next, build mapping tables that convert source fields into standard finance categories.
For billing, map each product and plan ID to one revenue account and one reporting dimension. Discounts need one rule, not three different ones depending on the system. You can record them as a contra-revenue account, such as 4190 Discounts and Credits, or net them against gross revenue. Either path works. What matters is picking one and using it everywhere.
For payroll, map job titles and cost centers to the same functional categories used in the GL. That mapping should include wages, payroll taxes, and benefits in the same allocation. If someone works in a hybrid role, set a clear allocation rule and apply it the same way in journal entries each time.
For CRM, standardize segment fields like SMB, Mid-Market, and Enterprise, along with lead source values and opportunity stages. Those fields should line up with the revenue dimensions used in billing and the GL. When that match is in place, metrics like CAC by channel and LTV by segment become measurable instead of fuzzy estimates.
Once those source categories line up, freeze the KPI definitions in a metric dictionary.
A metric dictionary spells out each KPI, its formula, source, timing rule, and owner. Without one, gross margin can mean one thing to the CFO, another to the VP of Sales, and something else again in the board deck.
For each metric, document:
| Metric | Formula | Source | Timing Rule | Owner |
|---|---|---|---|---|
| Gross Margin % | (Revenue − COGS) ÷ Revenue | GL accounts 4000–4999, 5000–5999 | Closed-period GL | FP&A |
| MRR | Sum of normalized monthly recurring contract value | Billing system (active subscriptions) | As of last day of month | RevOps |
| CAC | Total S&M spend ÷ New customers acquired | GL and payroll mapping | Quarter-to-date | FP&A |
| Net Revenue Retention (NRR) | (Starting MRR + Expansion − Contraction − Churn) ÷ Starting MRR | Billing system | Trailing 12 months | RevOps |
| Burn Rate | Net cash used in operations per month | Bank and GL | Prior full month | CFO |
| Runway | Current cash balance ÷ Average monthly burn | Bank + Burn Rate | Rolling 3-month avg burn | CFO |
Version every metric definition. If revenue recognition policy changes or a new product line goes live, update the dictionary with a timestamp and a note that explains what changed and why.
That audit trail matters. When investors or lenders ask why a number moved between reporting periods, you need more than "we updated the model." You need a clear record.
Next, use these definitions to lock access, QA, and period-close rules before launch.
After KPI definitions are approved, lock down governance, controls, and period-close rules.
Once the metric dictionary is approved, put it into practice with governance and access controls.
Assign three owners:
Any proposed change - a new data source, a new field, or an updated KPI formula - should go through a written review before it reaches production.[2][3]
Access should follow least privilege. Managers see only their cost center totals, while Treasury, the Controller, and the CFO keep account-level detail.[2]
Before any executive opens the dashboard, run three automated tie-out checks on every refresh:
| Check | What It Compares | Who Reviews |
|---|---|---|
| Trial balance reconciliation | Dashboard GL totals vs. accounting system trial balance | Controller |
| Revenue reconciliation | Billing system invoiced revenue vs. GL revenue accounts | FP&A |
| Payroll reconciliation | Payroll provider totals by department vs. booked GL expense | Controller / Payroll Manager |
If any check fails, block financial views from publication until the variance is resolved.[2]
Once controls are in place, freeze period-end data with snapshots.
At period close, snapshot the trial balance, income statement, balance sheet, subledgers, ARR by customer, active customers, pipeline, and headcount. Board views should pull from those snapshot tables for closed periods, not live tables.[2]
Tag each snapshot with a label like FY2025-Q1-Final-v1, and record any post-close change in a new version with a short log.[2]
Roll this out in a clear sequence: define the finance data model → map each source field → set refresh timing → align the chart of accounts → document KPI formulas → add governance and controls → launch to executives.[1][2]
When this is set up well, reporting stays tied to the close package and can be reproduced after period-end.
Choose the system of record based on where the data first lives and which system owns it.
Use accounting platforms like NetSuite or QuickBooks for financial records. Use billing platforms like Stripe or Chargebee for invoice details. Use payment processors for transaction-level data, and use bank feeds for cash flow records.
If you want a reliable single source of truth, the flow should go one way: other systems should feed into the accounting system, not the other way around.
Before you connect data sources, take stock of the systems you already use and check data quality. That helps you spot bottlenecks early instead of dragging them into the new setup. It also pays to standardize your chart of accounts across entities and line up shared identifiers, like customer IDs, so the same record means the same thing in every system.
Next, define a canonical data model for your main entities. Then map fields from each source into that model and normalize metric definitions. The goal is simple: a measure like revenue should mean the same thing everywhere before you automate pipelines.
It should line up with how your team makes decisions and how fast the data changes. A lot of teams use automated syncs every 15 minutes, but not every metric needs that pace.
Cash positions often need real-time updates. Working capital, revenue, and expenses are usually updated daily. Boards, on the other hand, tend to look at monthly or quarterly trends.