Published on
June 15, 2026


If you use one blended LTV number to set spend, you can miss weak new customer groups for 4 to 6 months - and in some cases for 12 to 18 months. That can lead you to overpay for growth, back the wrong channels, and misread retention.
Here’s the short version:
A few numbers from the article make the gap clear:
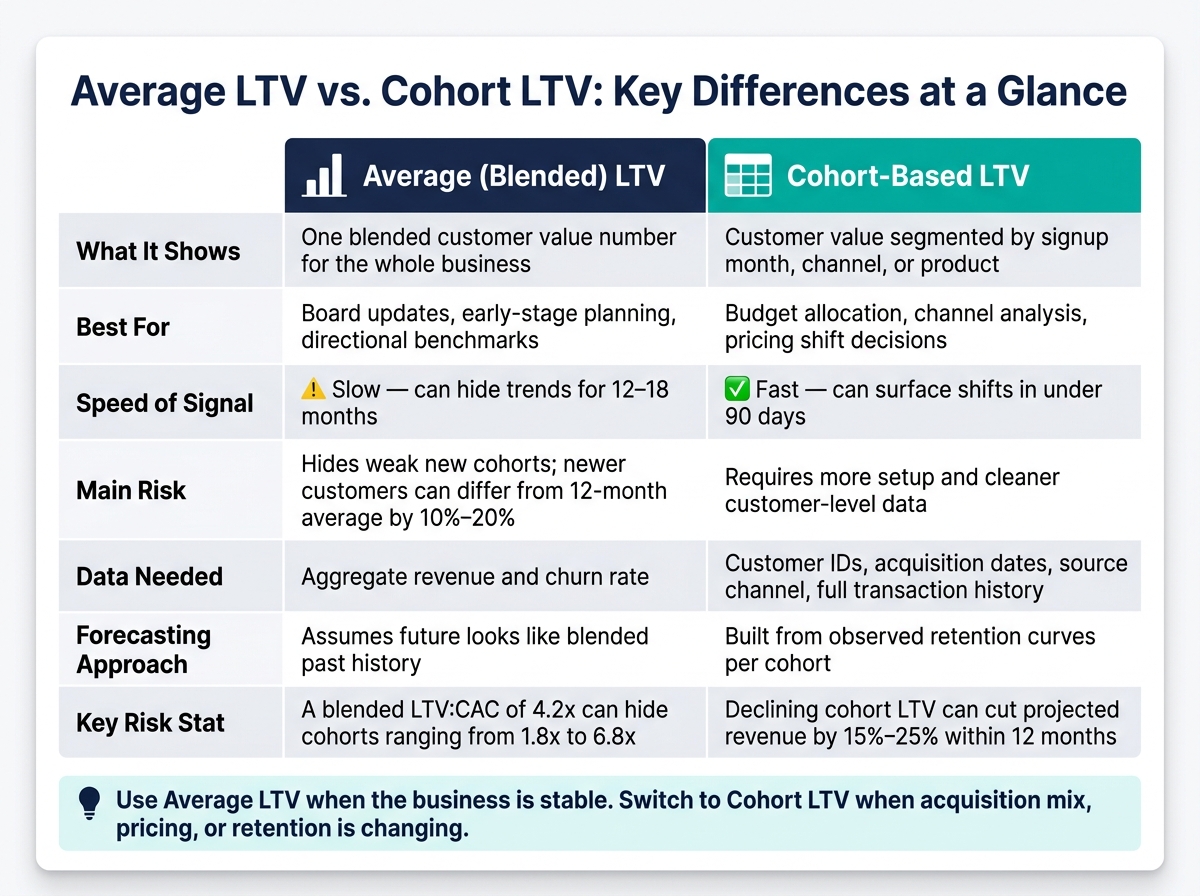
Average LTV vs. Cohort LTV: Key Differences at a Glance
| Criteria | Average LTV | Cohort LTV |
|---|---|---|
| What it shows | One blended customer value number | Customer value by group over time |
| Best for | Board updates, early-stage planning | Budgeting, channel analysis, pricing shifts |
| Signal speed | Slow | Faster |
| Main risk | Hides weak new cohorts | More setup and cleaner data needed |
| Data needed | Aggregate revenue and churn | Customer-level revenue, dates, channel, refunds, plan changes |
To me, the core idea is simple: average LTV tells you what the business looked like on average, while cohort LTV tells you what is changing right now. If your company is still simple, average LTV may be enough. If your growth engine is changing, cohort analysis is usually the better guide.
Average LTV starts with a simple question: how much gross profit does the average customer bring in? That gives you a useful baseline, but only when the inputs match what your customers look like right now.
The most common subscription formula is:
Average LTV = average revenue per account (ARPA) / Monthly Churn Rate [2]
If you want a number that reflects profit, not just top-line revenue, teams often use this version:
Average LTV = (ARPA × Gross Margin %) / Monthly Churn Rate [8]
Here’s a plain example: if a customer pays $120/month, your gross margin is 80%, and monthly churn is 2%, the result is $4,800 in average LTV and an implied lifespan of 50 months.
Two inputs do most of the heavy lifting here:
Average LTV works well in board decks and dashboards because it’s easy to explain and easy to track. It also gives you a rough upper limit for customer acquisition spend and supports the common 3:1 LTV:CAC ratio [7][1].
That said, once customer behavior starts to vary by cohort, one blended number stops telling the whole story.
This is where things get messy.
A blended LTV of $4,800 can look solid on paper while hiding major differences between channels. Your Organic Search customers might be worth $458.40 over 12 months with 12.8% churn, while your Instagram Paid Ads customers are worth only $236.00 with 38.1% churn [4].
Put those together, and the average smooths over the problem. You lose the detail that would help you decide whether to scale a channel or shut it down.
There’s also a timing issue. Older, better customers stay in the blended calculation and keep the number afloat, even when newer cohorts are getting weaker. If new-customer quality drops, it may take 4 to 6 months for that decline to show up in the average LTV figure - long after acquisition budgets have already been set [3].
That’s the blind spot cohort analysis is built to catch.
Average LTV rolls all customers into one number. Cohort LTV breaks them into groups based on when they started, where they came from, or what they bought first.
That changes the whole picture.
Cohort-based LTV looks at how specific customer groups perform over time, not what the "average" customer looks like. The big win here is simple: you can compare customers at the same age instead of mixing early-stage and mature customers into one blended figure.
A cohort is usually built by signup month. So, everyone who signed up in one month becomes one group, and the next month becomes the next group.
From there, you track cumulative revenue or gross profit per starting customer over time. This creates a cohort grid:
That grid makes trends easier to spot. You can see, cohort by cohort, whether performance is getting better or slipping.
You can also group cohorts by acquisition channel, like Paid Social vs. Organic Search, or by first product purchased. Channel cohorts are useful because they show whether a source brings in customers who actually stay and spend.
Cohort curves show whether newer customers are doing better or worse than older cohorts at the same point in their lifecycle.
If a newer cohort falls behind an older one at the same stage, that’s a sign to look into fast. Declining cohort LTV can cut projected revenue by 15% to 25% within 12 months [3].
If blended LTV and cohort LTV tell different stories, use the cohort view for operating decisions. That gap matters because cohort data changes how you read retention, pricing, and channel quality.
Companies that start tracking cohort LTV often find a 10% to 20% gap between their most recent three months of cohorts and their 12-month trailing average [3].
Cohort analysis needs more than a spreadsheet with total revenue.
You need customer-level records, including:
Without that level of detail, you can’t tell whether a shift came from acquisition quality, retention, or pricing. And in practice, messy billing data is usually where cohort analysis falls apart before it gets off the ground.
Once you build the cohort view, the next step is simple: compare it with the blended LTV most teams already report. One gives you a clean top-line number. The other shows what's going on under the hood.
Here’s the side-by-side view:
| Feature | Average (Blended) LTV | Cohort-Based LTV |
|---|---|---|
| Granularity | One blended number for the whole business | Segmented by month, channel, or product |
| Speed of signal | Slow; can hide trends for 12–18 months [6] | Fast; can surface shifts in under 90 days [6] |
| Forecasting | Forecasts from blended history; assumes the future looks like the past | Built from observed retention by cohort |
| Channel insight | Blends all channels together | Isolates ROI per acquisition source |
| Data needs | Aggregate revenue and customer counts | Transaction-level data, customer IDs, acquisition dates |
What matters most in practice is how fast each method picks up change.
Average LTV can smooth over timing effects. Cohort LTV shows whether newer customers are doing better or worse at the same point in their lifecycle.
That’s the main danger with blended reporting. If Simpson's Paradox shows up, strong older cohorts can hide weaker newer ones once everything gets rolled into one number.
Average LTV is fine for fractional CFO services and board-level reporting. It gives leaders a simple figure they can track over time.
But when it’s time to decide where to put budget, that simplicity becomes a problem. Cohort LTV is better for allocation because it shows channel-level differences that blended LTV washes out.
Average LTV wins on simplicity. It’s one number, easy to audit, and hard to manipulate.
Cohort LTV wins on usefulness. When leadership, lenders, or investors want to know why customer economics are moving, cohort data helps more because it shows what’s changing beneath the average. It makes the drivers of change visible before they stack up.
That tradeoff is what tells you when average LTV is enough and when cohort analysis starts to matter.
After looking at speed, detail, and forecasting, the next question is simple: which method fits the way your business runs?
If you're at the pre-seed or seed stage, average LTV is usually a solid place to start. It works well for directional planning and checking whether the business model makes sense.
This approach tends to hold up when cohort variance is low. In plain English, that means your pricing, customer mix, and acquisition channels don't change much. When things stay steady, one blended number is often close enough to reality to help you make decisions [7].
But once growth picks up, pricing changes, or channel mix starts moving around, that simplicity can start to work against you.
Cohort analysis starts to make sense when the business gets more dynamic. A few common triggers include:
The same shift often happens when investors or your board start asking tougher questions about payback periods and retention. A single average number can't give clear answers there [5].
Average LTV is a good fit for stable, early-stage businesses and board reporting.
Cohort LTV is a better fit when acquisition mix, pricing, or retention is changing, and when capital allocation depends on what each channel is doing.
The best choice comes down to fit, not complexity. Average LTV works when the business is simple and cohort variance stays low. Cohort LTV starts to pull ahead when acquisition mix, pricing, or customer behavior begins to shift. At that point, a blended number can hide differences that matter across cohorts.
Average LTV stops being useful when it no longer matches how recent customer cohorts behave.
This usually happens after shifts in business conditions, product changes, or a change in acquisition channels. The average may still look fine on paper, but it can hide what’s going on with newer customers.
One of the clearest red flags shows up in cohort analysis: newer cohorts have lower 6- or 12-month LTV, while the blended average stays flat or high. When that happens, older, higher-value cohorts are likely masking weaker retention, less expansion, or higher churn among newer customers.
You need transaction-level data, including:
That data gives you the basics you need to build acquisition cohorts and then follow how those customers behave over time. From there, you can track revenue and retention by cohort instead of looking at your customer base as one big blur.
Use gross profit instead of revenue when you calculate LTV. It gives you a more accurate view of customer profitability because it accounts for COGS and variable delivery costs that affect margins.
If you use revenue alone, you can overstate customer value. That’s a common trap in businesses with low gross margins, where top-line numbers may look strong but leave less money than expected after costs. In practice, that can lead to misleading decisions about customer acquisition costs and overall profitability.